Clinical Trial
. 2021 Jan;26(1):012706.
doi: 10.1117/1.JBO.26.1.012706.

Contact, high-resolution spatial diffuse reflectance imaging system for skin condition diagnosis: a first-in-human clinical trial

Affiliations
Clinical Trial

Contact, high-resolution spatial diffuse reflectance imaging system for skin condition diagnosis: a first-in-human clinical trial

Anne Koenig et al. J Biomed Opt. 2021 Jan.

Abstract

Significance: Oxygenation is one of the skin tissue physiological properties to follow for patient care management. Furthermore, long-term monitoring of such parameters is needed at the patient bed as well as outside the hospital. Diffuse reflectance spectroscopy has been widely used for this purpose.

Aim: The aim of the study is to propose a low-cost system for the long-term measurement of skin physiological parameters in contact.

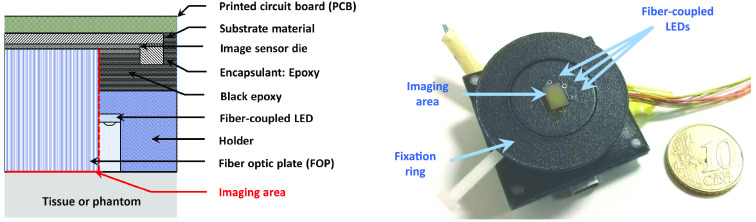
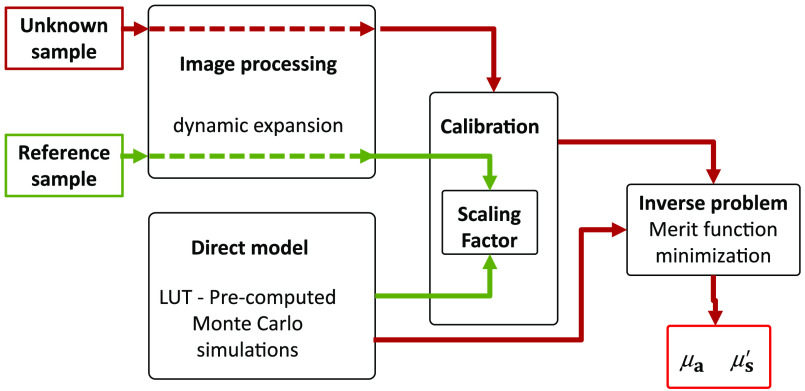
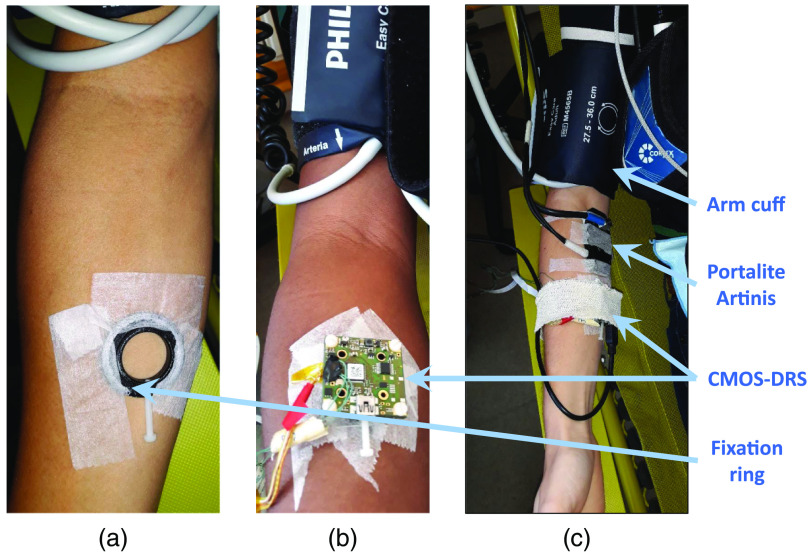
Approach: We have developed a low-cost, wearable, CMOS-based device. We propose an original method for processing diffuse reflectance data to calculate the tissue oxygen saturation (StO2).

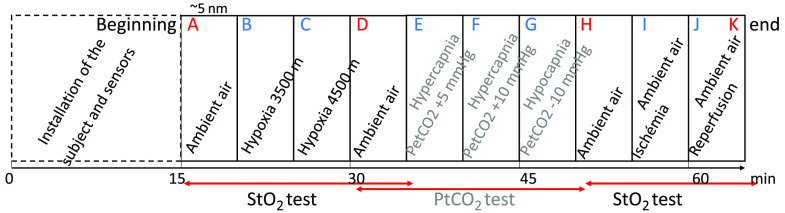
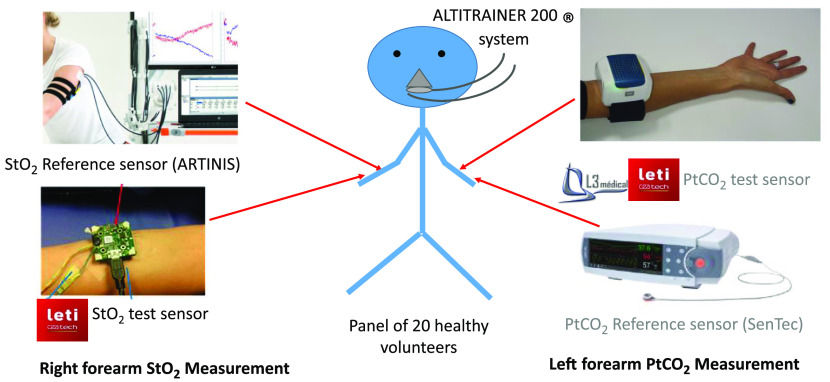
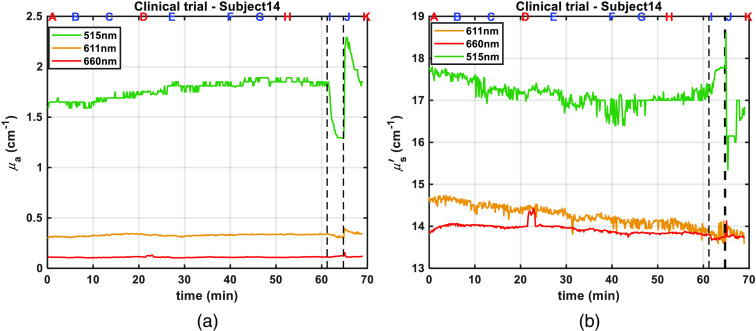
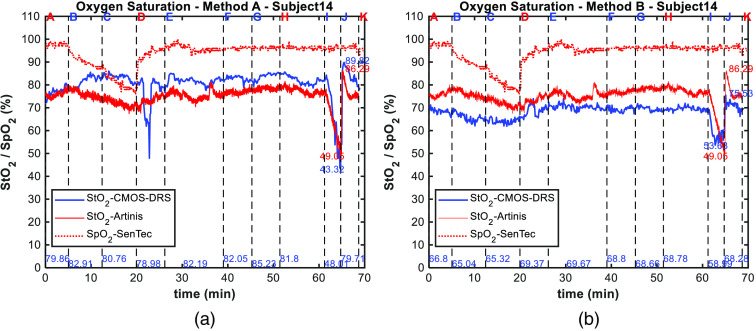
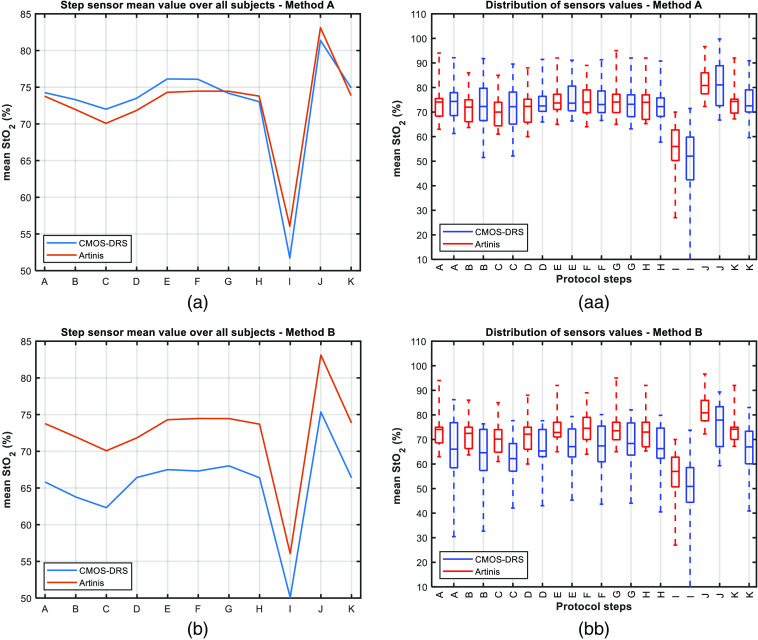
Results: We tested the device for the assessment of tissue oxygenation during a first-in-human clinical trial that took place at the Grenoble University Hospital France.

Conclusions: The results of this clinical trial show a good accordance between our sensor and commercial devices used a reference.

Keywords: contact imaging; diffuse reflectance; multipixel sensor; optical properties; skin characterization; tissue oxygen saturation; wearable device.


Figures

Fig. 1
Fig. 1
Layout and photograph of the CMOS-based srDRS prototype.
Fig. 2
Fig. 2
Flowchart of the data processing steps for optical properties quantification.
Fig. 3
Fig. 3
Protocol steps summary.
Fig. 4
Fig. 4
Schematic and photograph of the sensors placement on the volunteer.
Fig. 5
Fig. 5
Installation steps of sensors for in vivo StO2 measurement. (a) Attachment of the CMOS-DRS system was performed using a fixation ring and medical adhesive tapes. (b) The wearable CMOS-DRS system was placed on the inner forearm and away from the Artinis illumination field to avoid parasite light signals. (c) An ischemia of the upper right arm was performed using a cuff inflated at 250-mmHg pressure.
Fig. 6
Fig. 6
Optical properties: (a) absorption coefficient, (b) reduced scattering coefficient, measured for subject 14 using phantom B2 as reference, at 515 nm (green), 611 nm (orange), and 660 nm (red). Letters on top of figures correspond to protocol steps, and black dashed lines correspond to ischemia steps I and J.
Fig. 7
Fig. 7
(a) Oxygen saturation readings for subject 14 using method A, (b) using method B. Measurements of the tissue oxygen saturation obtained using the CMOS-DRS (blue line) and Artinis (red line) systems are plotted along with the pulsed oxygen saturation measured by the SenTec sensor (red dotted line). At the bottom of figure are indicated in blue mean CMOS-DRS StO2 values for last 30 s of each protocol step, and near the curves min and max of StO2 value at ischemia for both sensors (in blue for CMOS-DRS and in red for Artinis). Vertical black dashed lines and letters on top correspond to protocol steps.
Fig. 8
Fig. 8
(a), (b) StO2 mean value for all subjects measured with the reference (red) and CMOS-DRS (blue) StO2 sensors. (aa), (bb) Value distribution for each step as measured with the reference (red) and CMOS-DRS sensor (blue). On each box, the median value is represented by the central mark. Bottom and top edges of the box indicate the 25th and 75th percentiles of the measurements, respectively. (a, aa) using method A. (b), (bb) using method B.
Fig. 9
Fig. 9
Mean deviation between StO2 values measured with the CMOS-DRS sensor and the Artinis. For each step, deviations are averaged over all subjects and expressed in percent of the expected value (Artinis measurement). Error bars correspond to the standard deviation of this mean deviation over all subjects. (a) Using method A. (b) Using method B.

Similar articles

Cited by

References

    1. Smit J. M., et al. , “Advancements in free flap monitoring in the last decade: a critical review,” Plast. Reconstr. Surg. 125(1), 177–185 (2010).10.1097/PRS.0b013e3181c49580 - DOI - PubMed
    1. Delpy D. T., Cope M., “Quantification in tissue near-infrared spectroscopy,” Philos. Trans. R. Soc. Lond. B 352(1354), 649–659 (1997).PTRBAE10.1098/rstb.1997.0046 - DOI
    1. Jones N. F., “Intraoperative and postoperative monitoring of microsurgical free tissue transfers,” Clin. Plast. Surg. 19(4), 783–797 (1992).10.1016/S0094-1298(20)30796-3 - DOI - PubMed
    1. Farrell T. J., Patterson M. S., Wilson B., “A diffusion theory model of spatially resolved, steady-state diffuse reflectance for the noninvasive determination of tissue optical properties in vivo,” Med. Phys. 19(4), 879–888 (1992).MPHYA610.1118/1.596777 - DOI - PubMed
    1. Koenig A., et al. , “Diffuse reflectance spectroscopy: a clinical study of tuberculin skin tests reading,” Proc. SPIE 8592, 85920S (2013).PSISDG10.1117/12.2002314 - DOI

Publication types