. 2021 Aug 4;37(14):2004–2011.
doi: 10.1093/bioinformatics/btab050. Epub 2021 Jan 30.

McSplicer: a probabilistic model for estimating splice site usage from RNA-seq data

Affiliations

McSplicer: a probabilistic model for estimating splice site usage from RNA-seq data

Israa Alqassem et al. Bioinformatics. .

Abstract

Motivation: Alternative splicing removes intronic sequences from pre-mRNAs in alternative ways to produce different forms (isoforms) of mature mRNA. The composition of expressed transcripts gives specific functionalities to cells in a particular condition or developmental stage. In addition, a large fraction of human disease mutations affect splicing and lead to aberrant mRNA and protein products. Current methods that interrogate the transcriptome based on RNA-seq either suffer from short read length when trying to infer full-length transcripts, or are restricted to predefined units of alternative splicing that they quantify from local read evidence.

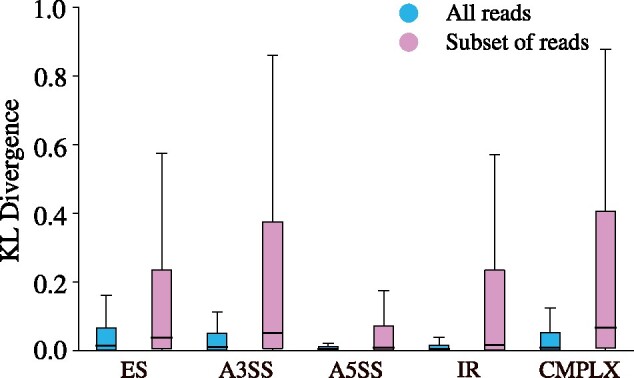
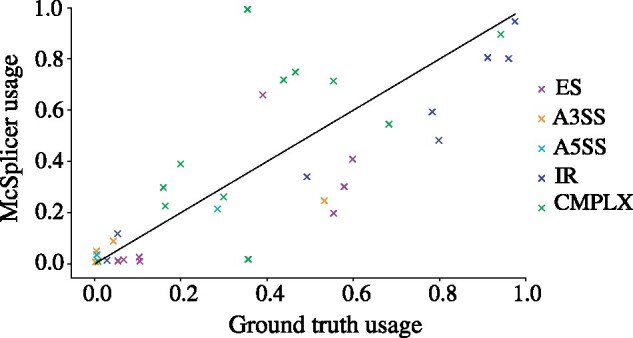
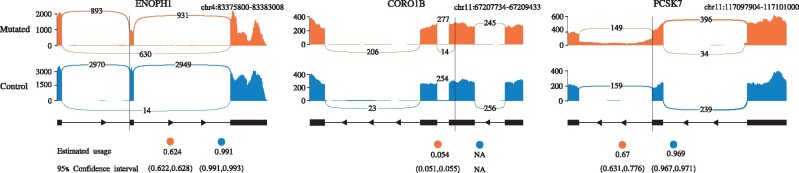
Results: Instead of attempting to quantify individual outcomes of the splicing process such as local splicing events or full-length transcripts, we propose to quantify alternative splicing using a simplified probabilistic model of the underlying splicing process. Our model is based on the usage of individual splice sites and can generate arbitrarily complex types of splicing patterns. In our implementation, McSplicer, we estimate the parameters of our model using all read data at once and we demonstrate in our experiments that this yields more accurate estimates compared to competing methods. Our model is able to describe multiple effects of splicing mutations using few, easy to interpret parameters, as we illustrate in an experiment on RNA-seq data from autism spectrum disorder patients.

Availability: McSplicer source code is available at https://github.com/canzarlab/McSplicer and has been deposited in archived format at https://doi.org/10.5281/zenodo.4449881.

Supplementary information: Supplementary data are available at Bioinformatics online.


Figures

Fig. 1.
Fig. 1.
Complex alternative splicing involving five different transcripts. The two classical exon skipping events between t1 and t5, and between t4 and t5 do not fully capture the overall complexity. The two exon skippings marked in blue are not considered classical events and would not be reported by methods such as SplAdder, since they also differ in the last exon. Methods such as MAJIQ generalize simple events to more complex AS units that contain all introns sharing a common splice site. Two such AS units are required to describe the simple exon skipping event marked in orange, one comprising three introns sharing donor s1 and one containing three different introns sharing acceptor s2
Fig. 2.
Fig. 2.
McSplicer workflow summary. The main steps of the McSplicer analysis are: (A) Map RNA-seq reads to the reference genome sequence. (B) Identify annotated as well as novel splice sites through the reference-based assembly of transcripts using, e.g. StringTie (Pertea et al., 2015). (C) Divide the gene into non-overlapping segments bounded by splice sites, TSS and TES and count the number of reads mapping to distinct combinations of segments. In this example, only the start of the first exon and the end of the last exon are bounded by TSS and TES, respectively, the remaining exon start and end sites correspond to splice sites. (D) Estimate splice site usages using McSplicer. (E) Leverage splice site usages in various kinds of downstream analyses, such as the quantification of different types of alternative splicing events
Fig. 3.
Fig. 3.
Example of hidden states representing three different transcripts. Five exon start sites and four exon end sites divide the gene into eight segments. Note, however, that the TSS bounding X1 from the left and the TES bounding X8 from the right are not labeled here since our model treats them differently (see main text). Therefore, Ms = 4, Me = 3 and M =8. The three sequences of states of Z, (1, 1, 0, 1, 0, 0, 1,1), (0, 1, 0, 0, 0, 1, 1,1) and (1, 1, 0, 0, 0, 0, 1,0), represent the three transcripts t1, t2 and t3, respectively
Fig. 4.
Fig. 4.
Accuracy of McSplicer and competing methods in quantifying the usage of variable splice sites from 50 million simulated RNA-seq reads. For each method, only splice sites in events that the method reports and quantifies are considered. SplAdder is limited to the quantification of simple AS events
Fig. 5.
Fig. 5.
McSplicer leverages all RNA-seq reads mapped to a gene to improve the accuracy of splice site usage estimates. On the dataset with 50 million simulated reads, McSplicer achieves lower KL divergence from true splice site usages when considering all reads mapped to a gene locus at once (blue) compared to using only reads that overlap any of the event’s exons (pink). ES denotes exon skipping, A3SS alternative 3′ splice site, A5SS alternative 5′ splice site, IR intron retention and CMPLX complex events
Fig. 6.
Fig. 6.
McSplicer results on spike-in RNA variants (SIRV), donor sample 5. Ground truth splice site usages computed from known mixing ratios of SIRV isoforms are compared to usages estimated by McSplicer. Out of 38 variable splice sites, 26 belong to simple events and 12 belong to complex events. ES denotes exon skipping, A3SS alternative 3′ splice site, A5SS alternative 5′ splice site, IR intron retention and CMPLX complex events
Fig. 7.
Fig. 7.
McSplicer splice site usage estimates and 95% bootstrapping confidence intervals for three disrupted splicing events reported in ASD patients versus control individuals. Variant locations are indicated by black vertical lines. Each plot illustrates the gene structure around the event with the precise genomic window specified on top, the read coverage and the junction read count. The Sashimi plots shown here are created using the ggsashimi tool (Garrido-Martín et al., 2018)

References

    1. Alamancos G.P. et al. (2015) Leveraging transcript quantification for fast computation of alternative splicing profiles. RNA, 21, 1521–1531. - PMC - PubMed
    1. Anna A., Monika G. (2018) Splicing mutations in human genetic disorders: examples, detection, and confirmation. J. Appl. Genet., 59, 253–268. - PMC - PubMed
    1. Braunschweig U. et al. (2014) Widespread intron retention in mammals functionally tunes transcriptomes. Genome Res., 24, 1774–1786. - PMC - PubMed
    1. Bray N.L. et al. (2016) Near-optimal probabilistic RNA-seq quantification. Nat. Biotechnol., 34, 525–527. - PubMed
    1. Brooks A.N. et al. (2011) Conservation of an RNA regulatory map between drosophila and mammals. Genome Res., 21, 193–202. - PMC - PubMed

Substances