. 2021 Mar 2;120(5):936-949.
doi: 10.1016/j.bpj.2021.01.018. Epub 2021 Jan 28.

Detailed evaluation of pyruvate dehydrogenase complex inhibition in simulated exercise conditions

Affiliations

Detailed evaluation of pyruvate dehydrogenase complex inhibition in simulated exercise conditions

Bodhi A Jelinek et al. Biophys J. .

Abstract

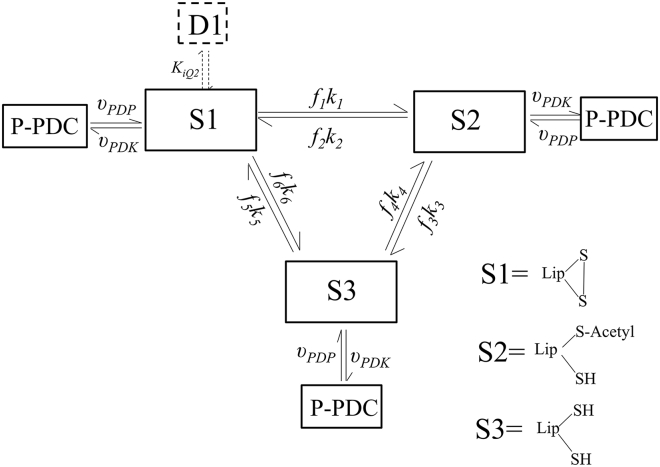
The mammalian pyruvate dehydrogenase complex (PDC) is a mitochondrial multienzyme complex that connects glycolysis to the tricarboxylic acid cycle by catalyzing pyruvate oxidation to produce acetyl-CoA, NADH, and CO2. This reaction is required to aerobically utilize glucose, a preferred metabolic fuel, and is composed of three core enzymes: pyruvate dehydrogenase (E1), dihydrolipoyl transacetylase (E2), and dihydrolipoyl dehydrogenase (E3). The pyruvate-dehydrogenase-specific kinase (PDK) and pyruvate-dehydrogenase-specific phosphatase (PDP) are considered the main control mechanism of mammalian PDC activity. However, PDK and PDP activity are allosterically regulated by several effectors fully overlapping PDC substrates and products. This collection of positive and negative feedback mechanisms confounds simple predictions of relative PDC flux, especially when all effectors are dynamically modulated during metabolic states that exist in physiologically realistic conditions, such as exercise. Here, we provide, to our knowledge, the first globally fitted, pH-dependent kinetic model of the PDC accounting for the PDC core reaction because it is regulated by PDK, PDP, metal binding equilibria, and numerous allosteric effectors. The model was used to compute PDH regulatory complex flux as a function of previously determined metabolic conditions used to simulate exercise and demonstrates increased flux with exercise. Our model reveals that PDC flux in physiological conditions is primarily inhibited by product inhibition (∼60%), mostly NADH inhibition (∼30-50%), rather than phosphorylation cycle inhibition (∼40%), but the degree to which depends on the metabolic state and PDC tissue source.


Figures

Figure 1
Figure 1
The PDC consists of three main catalytic subunits, E1, E2, and E3. The overall reaction involves the oxidative decarboxylation of pyruvate, with an acetyl group from pyruvate being transferred to CoA to form acetyl-CoA and reduction of NAD+ to NADH, each reaction taking place in three different subunits. The overall reaction is mediated by a substrate-channeling mechanism such that the acetyl group from pyruvate and reducing equivalents can be transferred from one subunit to the next. The complex also contains a specific kinase (PDK) that acts to deactivate the PDC through phosphorylation near the E1 active site and reactivation by the specific phosphatase (PDP). To see this figure in color, go online.
Figure 3
Figure 3
PDC pH and product ratio dependence. Model predictions are lines and data are circles. (A) Pig heart PDC initial rates with varied pH in 0 (blue), 0.2 (green), and 1 mM acetyl-CoA (red). (B) Pig heart PDC initial rates with varied pH in 0 (blue), 0.1 (green), and 0.2 mM NADH (red). (C) % Pig heart PDC activity as a function of acetyl-CoA/CoA (blue) and NADH/NAD+ (green). Error bars are based on a 10% error using the max value in each data curve, which was used for weighting the data for model fitting. To see this figure in color, go online.
Figure 2
Figure 2
The PDC reaction is converted into a kinetic scheme in which S1, S2, and S3 represent the major states of lipoamide in which substrates and products bind rapidly. The inactivated phosphorylated complex is represented by P-PDCs and is formed and consumed by PDK (υPDK) and PDP (υPDP) flux, respectively. D1 is a dead-end complex formed by acetyl-CoA inhibition. The dead-end complex is rendered in dashed lines to indicate that it is not an absolute requirement to fit the data compiled here but does improve global fitting efforts (see Fig. S4 and Model fitting).
Figure 4
Figure 4
PDK: ATP, ADP, TPP, pyruvate, and metal dependence and binding; model predictions are represented as lines and data circles. (A) Varied ATP in 0 (blue), 0.005 (green), and 1 (red) mM TPP in 0 mM K+. Data were obtained from Fig. 1 (top panel) in (47). (B) Varied ATP in 0 (blue), 0.005 (green), and 1 (red) mM TPP in 120 mM K+. Data were obtained from Fig. 1 (bottom panel) in (47). (C) (Green) PDK initial velocity varying ADP in 111 mM K+, 60 mM Cl, and 63 μM ATP. (Magenta) PDK initial velocity varying ADP in 14 mM K+ and 80 μM ATP. (Blue) PDK initial velocity varying ADP in 111 mM K+, 60 mM Cl, and 25 μM ATP. (Red) PDK initial velocity varying ADP in 14 mM K+ and 32 μM ATP. Data were obtained from Fig. 1 in (48). (D) PDK initial velocity in varied pyruvate at different ADP/ATP ratios of 0.178 (blue), 0.362 (green), and 0.731 (red). Data were obtained from Fig. 5 in (48). (E) PDK protein fluorescence quenching monitored the binding of ATP. Data were obtained from Fig. 1 B in (49). (F) PDK protein fluorescence quenching monitored the binding of ADP. Data were obtained from Fig. 1 C in (49). Error bars are based on a 10% error using the max value in each data curve, which was used for weighting the data for model fitting. To see this figure in color, go online.
Figure 5
Figure 5
PDK allosteric effectors: model predictions are represented as lines and data circles. (A) PDK initial velocity as function of NADH/NAD+ ratio. Data were obtained from Fig. 9 A in (19). (B) PDK initial velocity as a function of acetyl-CoA/CoA ratio. Data were obtained from Fig. 9 B in (19). (C) PDK normalized % activity with varied dichloroacetate (DCA) in 0 (blue) and 10 μM TPP (green). Data were obtained from Fig. 3 C in (27). (D) Pyruvate binding followed by PDK protein fluorescence quenching. Data were obtained from Fig. 3 A in (49). Error bars are based on a 10% error using the max value in each data curve, which was used for weighting the data for model fitting. To see this figure in color, go online.
Figure 6
Figure 6
PDP/PDK Ca2+, Mg2+, and pH dependence. Model predictions are represented as lines and data circles. (A) Normalized PDP activity as a function of NADH/NAD+ ratio. Data were obtained from Table 2 in (51). (B) PDP activity with varied Mg2+ in 0 (blue) and 0.16 mM Ca2+ (green). Data were obtained from Fig. 4 A in (20). (C) Normalized PDP activity with varied free Ca2+ in 10 mM Mg2+. Data were obtained from Fig. 2 A in (21). (D) PDP activity with varied Pi in 10 mM (blue) and 5 mM (green) Mg2+. Data were obtained from Fig. 13 in (17). (E) PDP activity as a function of pH. Data were obtained from Fig. 2 (top panel) in (17). (F) PDK activity as a function of pH. Data were obtained from Fig. 2 (top panel) in (17). Error bars are based on a 10% error using the max value in each data curve, which was used for weighting the data for model fitting. To see this figure in color, go online.
Figure 7
Figure 7
Phosphorylation-dependent PDH regulatory complex (R-PDC) activity in various conditions. Model predictions are represented as lines and data circles. Data and model predictions in (A)–(D) were produced by subjecting the PDK and PDP reaction, on PDC, to each effector shown with subsequent analysis of R-PDC activity in a standard condition (13,51,55). (A) Bovine kidney R-PDC % activity as a function of NADH/NAD+ effects on the phosphorylation state. Data were obtained from end points in Fig. 2 of (51). (B) Bovine kidney R-PDC % activity as a function of acetyl-CoA/CoA effects on the phosphorylation state. Data were obtained from the end points in Fig. 1 of (51). (C) Bovine kidney R-PDC % activity as a function of ATP effects on the phosphorylation state. Data were obtained from the data end points of Fig. 2 in (13). (D) Bovine kidney R-PDC % activity as a function of ADP/ATP ratio that depend only on phosphorylation state. Data were obtained from end points in the middle panel of Fig. 1 in (55). (E) % R-PDC activity as a function of % VO2max using data obtained from ex vivo assays from rat gastrocnemius muscle (56) that depend only on phosphorylation state. Data in (E) were obtained from Fig. 1 in (56). Error bars are based on a 10% error using the max value in each data curve, which was used for weighting the data for model fitting. To see this figure in color, go online.
Figure 8
Figure 8
Pig heart PDC regulatory complex model predictions of inhibition in exercise conditions. Simulation concentrations were perturbed randomly by 10% of their starting values to create an ensemble of concentrations (Fig. S6). Perturbed conditions were used to compute the model using several thousand parameter sets that fit the data. Errors bars were determined from the standard deviation of the model predictions. (A) and (B) were computed in more oxidizing conditions (NAD+/NADH ranged from 4 to 10), and (C) and (D) were computed in more reducing conditions (NAD+/NADH ranged from 1 to 4). (A) The R-PDC computed flux is shown as a function of % VO2max (exercise intensity). (B) The R-PDC model was computed as in (A), in which the % inhibition of R-PDC flux was determined for PDK, NADH, and acetyl-CoA relative to the R-PDC flux with no inhibition such that ATP, NADH, and acetyl-CoA were set to 0 (Eq. 8). (C) Same as in (A), except the NAD+/NADH ratio varied from 1 to 4 to mimic a more reducing condition. (D) Same as in (B), except the NAD+/NADH ratio varied from 1 to 4 to mimic a more reducing condition. Error bars represent the standard deviation. To see this figure in color, go online.
Figure 9
Figure 9
Pig heart R-PDC % total relative inhibition of model predicted a flux in exercise conditions. (A) The R-PDC model was computed in the corresponding conditions (Fig. S8) to simulate exercise at different intensities using the pig heart R-PDC parameters. In this panel, the NAD+/NADH ratio varied from 4 to 10 to simulate a more oxidizing condition. At each intensity, the % inhibition of the R-PDC flux was determined for PDK, NADH, and acetyl-CoA relative to the R-PDC flux with no inhibition such that ATP, NADH, and acetyl-CoA were set to 0. The total % inhibition from this calculation was summed, and the relative % inhibition for PDK, NADH, and acetyl-CoA was determined using each of their % inhibitions over the total. (B) The R-PDC model was computed in the corresponding conditions (Fig. S9) to simulate exercise at different intensities. In this panel, the NAD+/NADH ratio varied from 1 to 4 to simulate a more reducing condition. The mean R-PDC % relative inhibition was determined as described in (A). Error bars represent the standard deviation. To see this figure in color, go online.

Similar articles

Cited by

References

    1. Modak J., Deckwer W.D., Zeng A.P. Metabolic control analysis of eucaryotic pyruvate dehydrogenase multienzyme complex. Biotechnol. Prog. 2002;18:1157–1169. - PubMed
    1. Moxley M.A., Vinnakota K.C., Beard D.A. Systems-level computational modeling demonstrates fuel selection switching in high capacity running and low capacity running rats. PLoS Comput. Biol. 2018;14:e1005982. - PMC - PubMed
    1. Randle P.J., Garland P.B., Newsholme E.A. The glucose fatty-acid cycle. Its role in insulin sensitivity and the metabolic disturbances of diabetes mellitus. Lancet. 1963;1:785–789. - PubMed
    1. Hue L., Taegtmeyer H. The Randle cycle revisited: a new head for an old hat. Am. J. Physiol. Endocrinol. Metab. 2009;297:E578–E591. - PMC - PubMed
    1. Svensson K., Dent J.R., Schenk S. Defining the contribution of skeletal muscle pyruvate dehydrogenase α1 to exercise performance and insulin action. Am J Physiol Endocrinol Metab. 2018;315:E1034–E1045. - PMC - PubMed

Publication types

MeSH terms

Substances

LinkOut - more resources