

Multiparametric in vivo analyses of the brain and spine identify structural and metabolic biomarkers in men with adrenomyeloneuropathy
- PMID: 33516063
- PMCID: PMC7847955
- DOI: 10.1016/j.nicl.2021.102566
Multiparametric in vivo analyses of the brain and spine identify structural and metabolic biomarkers in men with adrenomyeloneuropathy
Abstract
Objective: Progressive myelopathy causes severe handicap in men with adrenomyeloneuropathy (AMN), an X-linked disorder due to ABCD1 pathogenic variants. At present, treatments are symptomatic but disease-modifying therapies are under evaluation. Given the small effect size of clinical scales in AMN, biomarkers with higher effect size are needed. Here we used high-resolution magnetic resonance techniques to identify non-invasive in vivo biomarkers of the brain and spine with high effect sizes.
Methods: We performed a multiparametric imaging and spectroscopy study in 23 male patients with AMN (age: 44 ± 11) and 23 male controls (age: 43 ± 11) of similar age and body-mass index. We combined (i) macrostructural analyses of the spine, using cross-sectional area (CSA) and magnetization transfer ratio (MTR), (ii) microstructural analyses of the spine and the brain, using diffusion tensor and the newly developed fixel-based analysis, and (iii) advanced metabolic analyses of the spine using metabolite cycling coupled to a semi-LASER sequences.
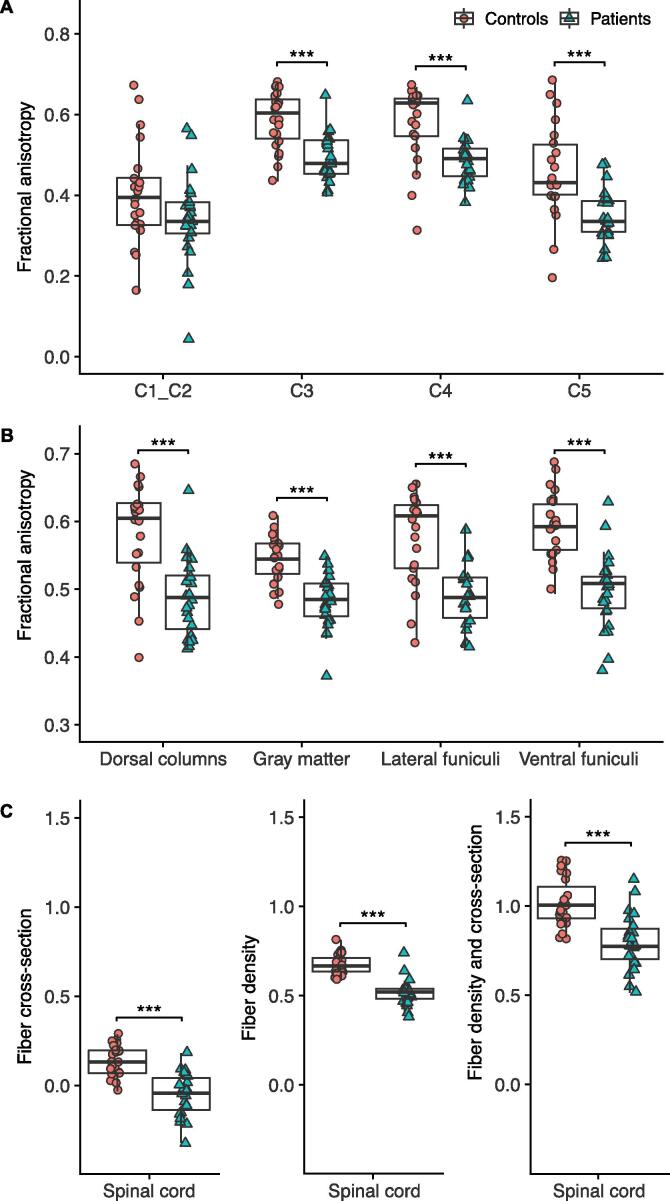
Results: Macrostructural alterations (decrease in CSA and MTR) were observed in patients at all spinal cord levels studied (C1-T2 for CSA and C1-C5 for MTR) (p < 0.001). Microstructural alterations were observed in the spine and brain on diffusion tensor and fixel-based metrics though the latter showed higher effect sizes. Metabolic alterations were observed in patients as a decreased total N-acetylaspartate/myo-inositol ratio (p < 0.001). Overall, MTR showed the highest effect size.
Conclusion: This cross-sectional study supports the use of multiparametric techniques that elucidate the structural, microstructural and metabolic alterations in AMN. These outcome measures should be tested longitudinally and in clinical trials.
Keywords: Adrenomyeloneuropathy; Fixel-based analysis; Imaging biomarkers; Metabolite cycling; Spinal cord imaging; Spinal cord toolbox.
Copyright © 2021. Published by Elsevier Inc.
Conflict of interest statement
The authors declare that they have no known competing financial interests or personal relationships that could have appeared to influence the work reported in this paper.
Figures


References
-
- Alexander D.C., Barker G.J., Arridge S.R. Detection and modeling of non-Gaussian apparent diffusion coefficient profiles in human brain data. Magn. Reson. Med. 2002;48(2):331–340. - PubMed
-
- Alley, S., Gilbert, G., Gandini, W.-K.,C.A., Samson, R., Grussu, F., Martin, A.R., Bannier, E., Callot, V., Smith, S.A., Xu, S., Dewey, B., Weber, K.A., Parrish, T.B., McLaren, D., Barker, G.J., Papinutto, N., Seif, M., Freund, P., Barry, R.L., By, S., Narayanan, S., Cohen-Adad, J., 2018. Consensus acquisition protocol for quantitative MRI of the cervical spinal cord at 3T. In: Paper presented at the 26th Annual Meeting of ISMRM, Paris.
-
- Aubourg P., Mosser J., Douar A.M., Sarde C.O., Lopez J., Mandel J.L. Adrenoleukodystrophy gene: unexpected homology to a protein involved in peroxisome biogenesis. Biochimie. 1993;75(3–4):293–302. - PubMed
Publication types
MeSH terms
Substances
Grants and funding
LinkOut - more resources
Full Text Sources
Other Literature Sources
Miscellaneous
