Case Reports
. 2021 Feb 9;34(6):108728.
doi: 10.1016/j.celrep.2021.108728. Epub 2021 Jan 21.

Early induction of functional SARS-CoV-2-specific T cells associates with rapid viral clearance and mild disease in COVID-19 patients

Affiliations
Case Reports

Early induction of functional SARS-CoV-2-specific T cells associates with rapid viral clearance and mild disease in COVID-19 patients

Anthony T Tan et al. Cell Rep. .

Abstract

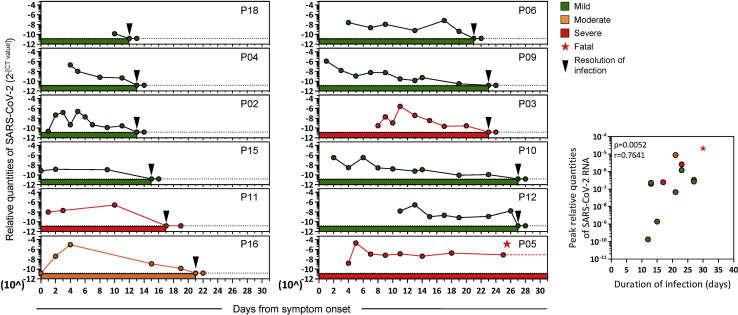
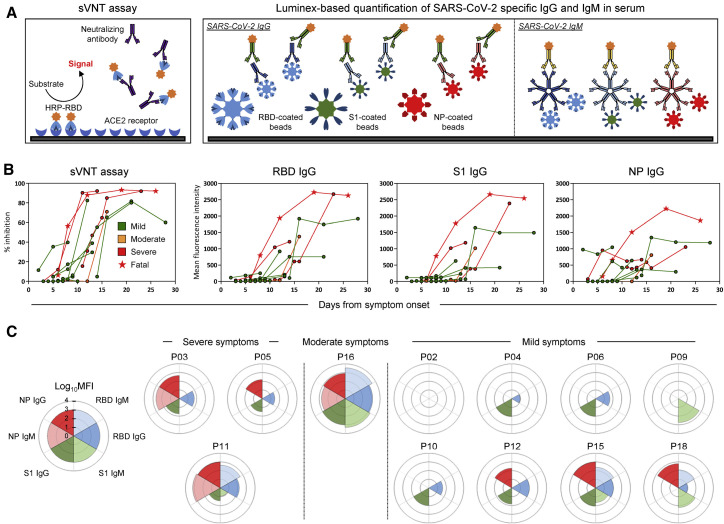
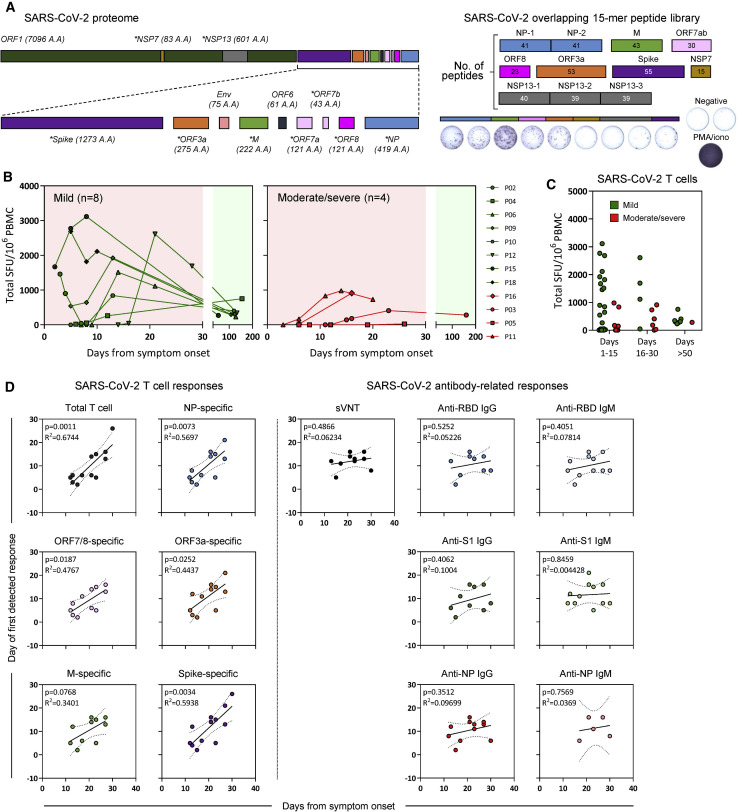
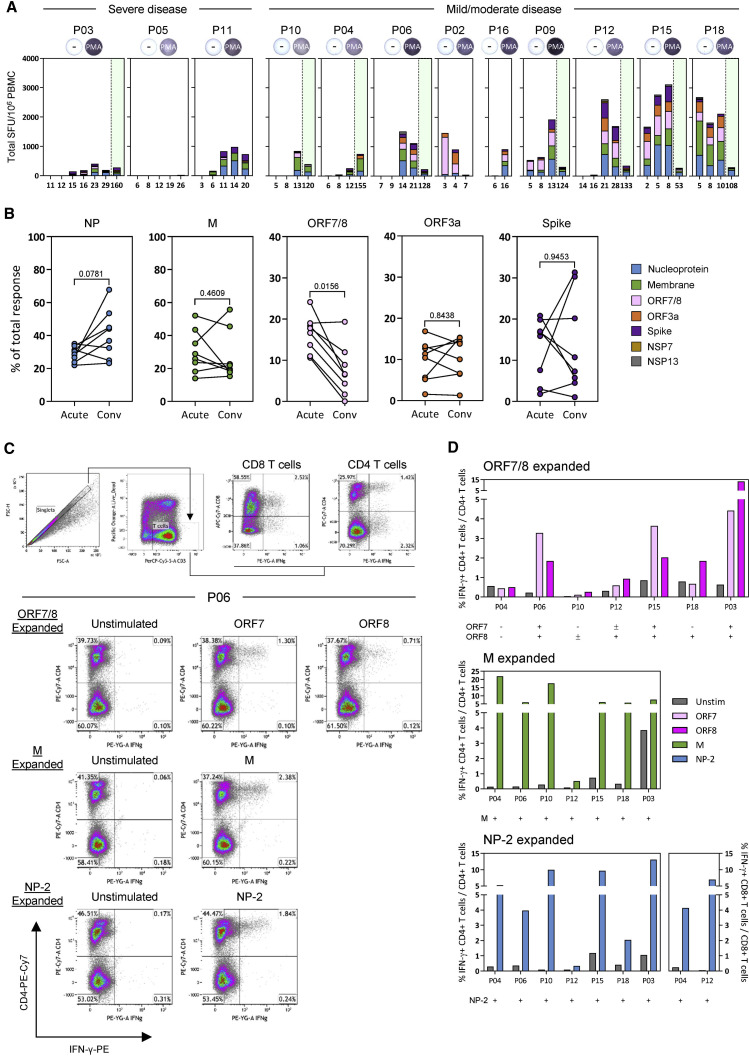
Virus-specific humoral and cellular immunity act synergistically to protect the host from viral infection. We interrogate the dynamic changes of virological and immunological parameters in 12 patients with symptomatic acute SARS-CoV-2 infection from disease onset to convalescence or death. We quantify SARS-CoV-2 viral RNA in the respiratory tract in parallel with antibodies and circulating T cells specific for various structural (nucleoprotein [NP], membrane [M], ORF3a, and spike) and non-structural (ORF7/8, NSP7, and NSP13) proteins. Although rapid induction and quantity of humoral responses associate with an increase in disease severity, early induction of interferon (IFN)-γ-secreting SARS-CoV-2-specific T cells is present in patients with mild disease and accelerated viral clearance. These findings provide support for the prognostic value of early functional SARS-CoV-2-specific T cells with important implications in vaccine design and immune monitoring.

Keywords: Acute phase4; Antibodies; Convalescence; Humoral response; Longitudinal; T cell response.


Conflict of interest statement

Declaration of interests A.B. is a cofounder of and A.T.T. consults for Lion TCR, a biotech company developing T cell receptors for treatment of virus-related diseases and cancers. None of the other authors has any competing interest related to the study.

Figures

None
Graphical abstract
Figure 1
Figure 1
Relative quantities of SARS-CoV-2 in the upper respiratory tract of symptomatic COVID-19 patients during acute infection Longitudinal RT-PCR of SARS-CoV-2 RNA in the upper respiratory tract of COVID-19 patients (n = 12) with variable disease severity from symptom onset until RT-PCR negativity. Dotted lines denote positive cutoffs. Inserts show correlations between the peak relative quantities of SARS-CoV-2 and the duration of infection. The p value and the non-parametric Spearman correlation coefficient are indicated.
Figure 2
Figure 2
Longitudinal analysis of SARS-CoV-2-specific antibody-related responses in acute COVID-19 patients (A) Schematic representation of the surrogate virus neutralization assay and the Luminex-based assay to quantify SARS-CoV-2 RBD-, S1-, and NP-specific IgG and IgM antibodies. Cutoffs to define significant virus neutralization and antibody quantities were set at 20% inhibition for the sVNT assay (as defined in ref (Tan et al., 2020)) and MFI (mean fluorescence intensity) > 100 for the Luminex-based assay, respectively. (B) SARS-CoV-2 neutralization and relative quantities of specific IgG and antibodies (n = 12). (C) Rose plots represent the quantity of RBD-, S1-, and NP-specific IgG and IgM antibodies at first detectable antibody response (n = 12). Patient P02 had no detectable antibody response at 3, 4, 7, and 9 days after symptom onset for which samples were available.
Figure 3
Figure 3
Longitudinal analysis of SARS-CoV-2 T responses in COVID-19 patients during acute infection and at convalescence (A) SARS-CoV-2 proteome organization. Analyzed proteins are marked by an asterisk. 15-mer peptides, which overlapped by 10 amino acids, comprising the NP, M, ORF7ab, ORF8, ORF3a, NSP7, and NSP13 were grouped into 10 pools with the indicated number of peptides in each pool. 15-mer predicted peptides previously shown to activate Spike-specific CD8 and CD4 T cells were grouped into a single pool. PMA+ionomycin was used as a positive control for all samples analyzed. (B) Longitudinal analysis of the total SARS-CoV-2 T cell response in COVID-19 patients (n = 12) from onset of disease until convalescence. Individual lines represent single patients. (C) Total SARS-CoV-2 T cell response detected in all COVID-19 patients (n = 12) during day 1–15, day 16–30, and >50 days after symptom onset. Patients with mild symptoms (n = 8) or moderate/severe symptoms (n = 4) are indicated. (D) Linear regression analysis of the duration of infection and the number of days to the first detectable T cell response (total and NP-, ORF7/8-, ORF3a-, M-, or Spike-specific T cell response) or antibody-related response (sVNT and RBD-, S1-, or NP-specific IgG and IgM) are shown in the respective dotplots. The p values and the corresponding r2 values are shown.
Figure 4
Figure 4
Hierarchy of cellular responses toward different SARS-CoV-2 proteins (A) Stacked bars denotes the frequency of peptide-reactive cells in all COVID-19 patients (n = 12) against the indicated SARS-CoV-2 protein at all time points tested. Green shaded areas denote the convalescence phase of the disease. Positive controls are inserted for each patient. (B) Plots show the proportion of peptide-reactive cells attributed to the respective SARS-CoV-2 protein at the peak response during the acute phase and the convalescence phase of the disease (n = 8). A Wilcoxon matched-pairs test was used to evaluate the differences, and the p values are shown. Short-term T cell lines were also generated from the convalescent samples using the respective SARS-CoV-2 peptide pools. Each line was then stimulated with the corresponding peptide pool used for expansion, and the frequency of IFN-γ-producing T cells was quantified. (C) Flow cytometry gating strategy is shown. Representative dotplots of ORF7/8-, M-, and NP-2-specific T cell lines generated from patient P06 are displayed. (D) Frequencies of IFN-γ-producing CD4 or CD8 T cells of all in vitro-expanded T cell lines generated from the convalescent PBMCs of respective COVID-19 patients (n = 7).

References

    1. Atyeo C., Fischinger S., Zohar T., Slein M.D., Burke J., Loos C., McCulloch D.J., Newman K.L., Wolf C., Yu J. Distinct Early Serological Signatures Track with SARS-CoV-2 Survival. Immunity. 2020;53:524–532.e4. - PMC - PubMed
    1. Braun J., Loyal L., Frentsch M., Wendisch D., Georg P., Kurth F., Hippenstiel S., Dingeldey M., Kruse B., Fauchere F. SARS-CoV-2-reactive T cells in healthy donors and patients with COVID-19. Nature. 2020;587:270–274. - PubMed
    1. Chen G., Wu D., Guo W., Cao Y., Huang D., Wang H., Wang T., Zhang X., Chen H., Yu H. Clinical and immunological features of severe and moderate coronavirus disease 2019. J. Clin. Invest. 2020;130:2620–2629. - PMC - PubMed
    1. Grifoni A., Weiskopf D., Ramirez S.I., Mateus J., Dan J.M., Moderbacher C.R., Rawlings S.A., Sutherland A., Premkumar L., Jadi R.S. Targets of T Cell Responses to SARS-CoV-2 Coronavirus in Humans with COVID-19 Disease and Unexposed Individuals. Cell. 2020;181:1489–1501.e15. - PMC - PubMed
    1. Gudbjartsson D.F., Norddahl G.L., Melsted P., Gunnarsdottir K., Holm H., Eythorsson E., Arnthorsson A.O., Helgason D., Bjarnadottir K., Ingvarsson R.F. Humoral Immune Response to SARS-CoV-2 in Iceland. N. Engl. J. Med. 2020;383:1724–1734. - PMC - PubMed

Publication types