. 2021 Mar;100(3):100869.
doi: 10.1016/j.psj.2020.11.046. Epub 2020 Nov 30.

A novel chicken model of fatty liver disease induced by high cholesterol and low choline diets

Affiliations

A novel chicken model of fatty liver disease induced by high cholesterol and low choline diets

Chiao-Wei Lin et al. Poult Sci. 2021 Mar.

Abstract

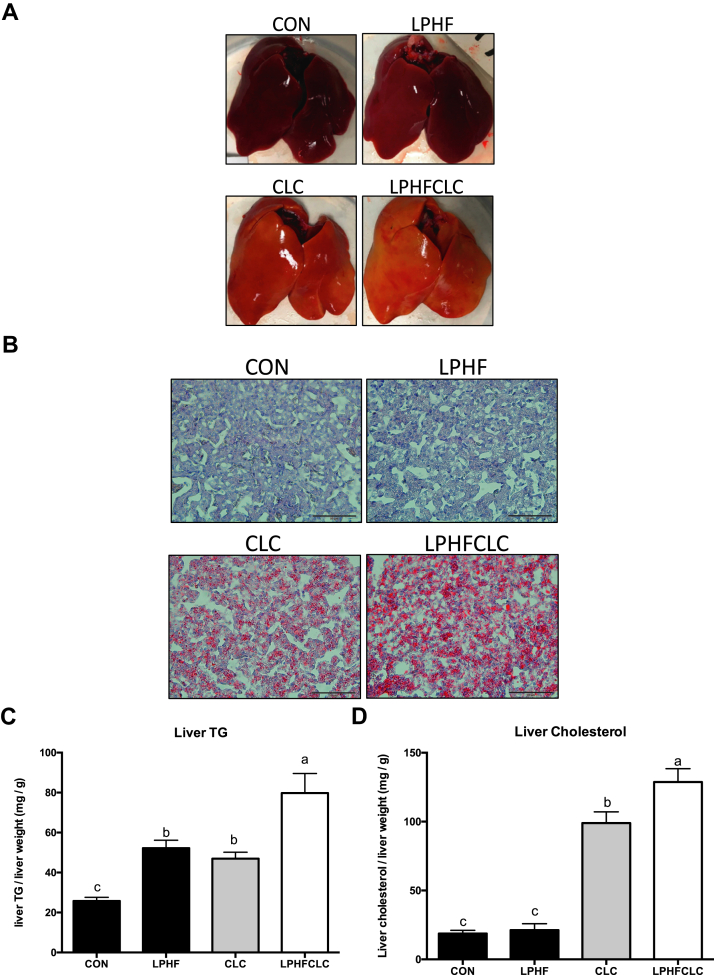
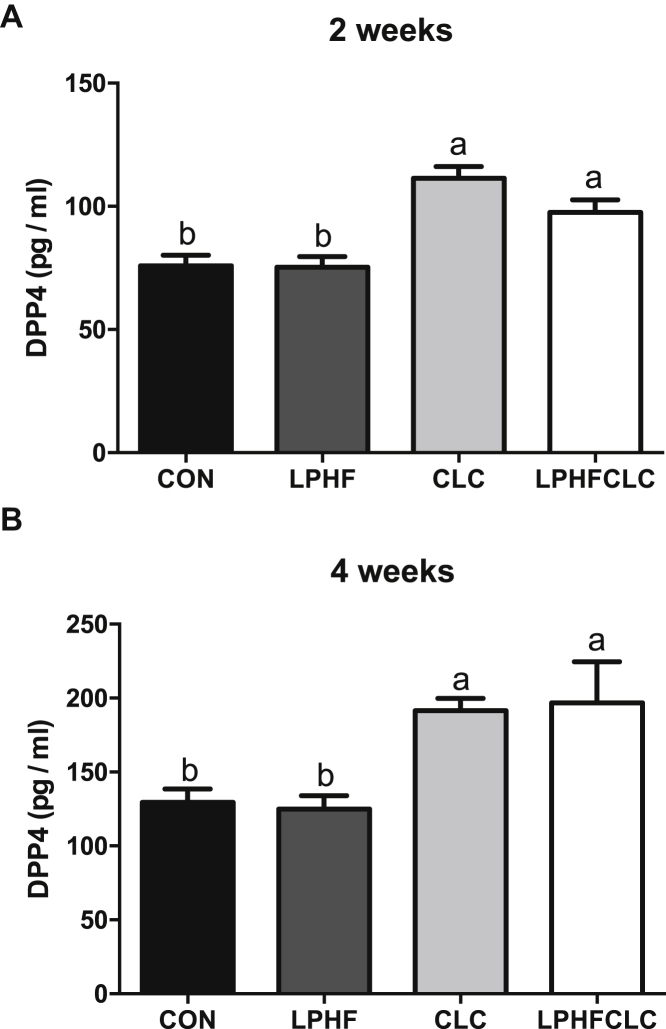
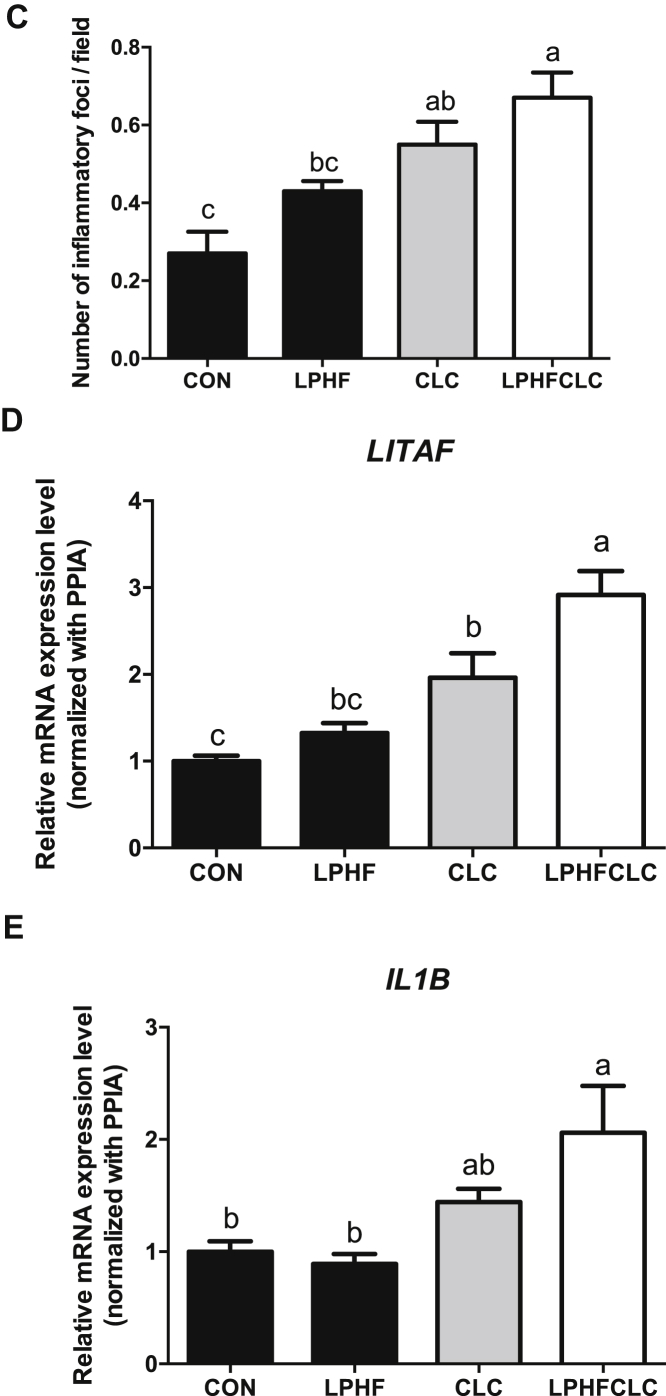
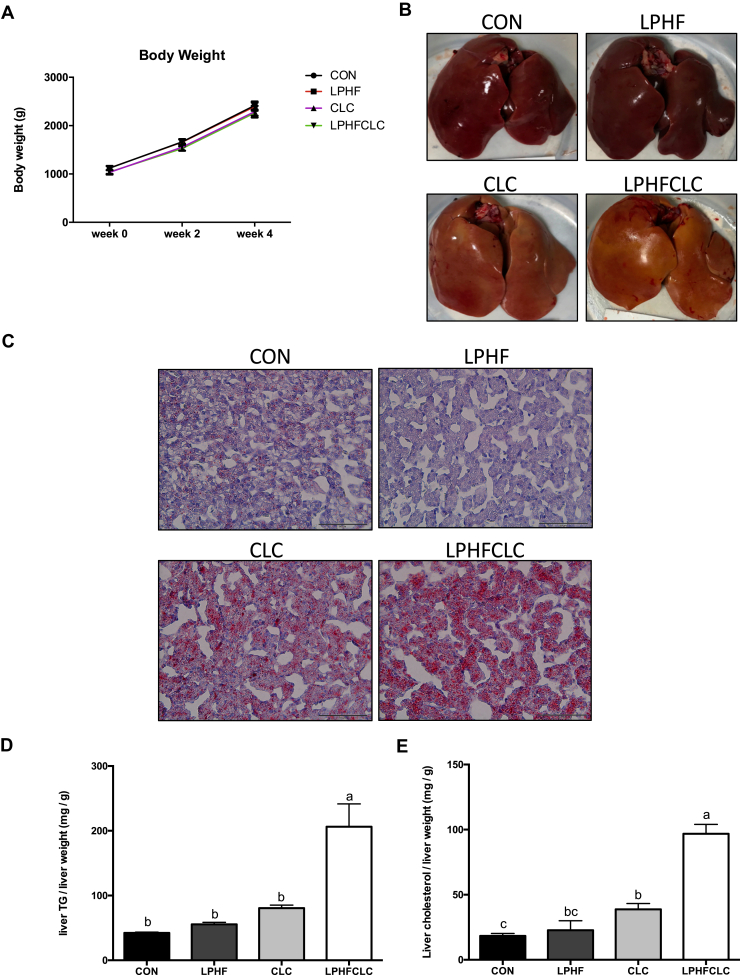
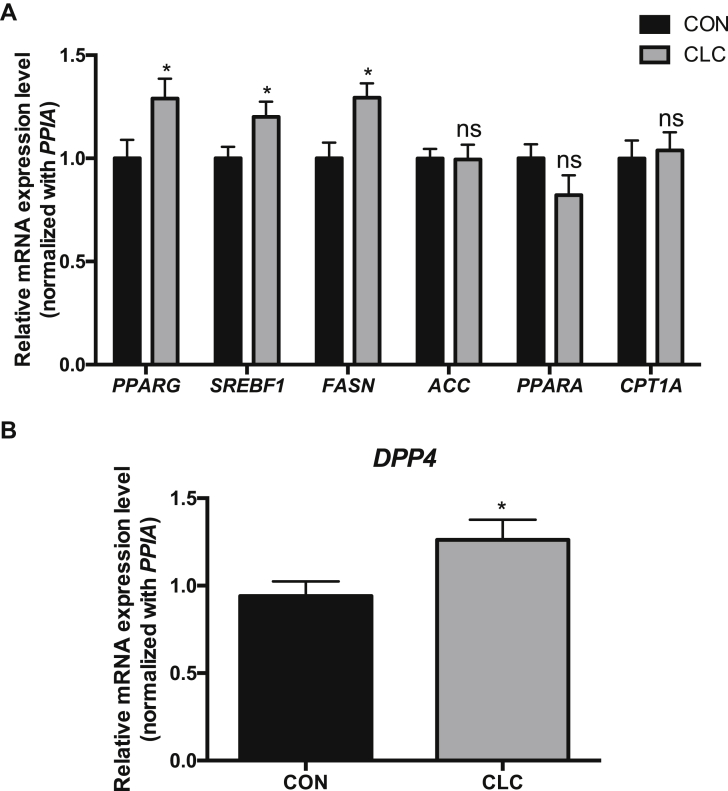
Fatty liver diseases, common metabolic diseases in chickens, can lead to a decrease in egg production and sudden death of chickens. To solve problems caused by the diseases, reliable chicken models of fatty liver disease are required. To generate chicken models of fatty liver, 7-week-old ISA female chickens were fed with a control diet (17% protein, 5.3% fat, and 1,300 mg/kg choline), a low protein and high fat diet (LPHF, 13% protein, 9.1% fat, and 1,300 mg/kg choline), a high cholesterol with low choline diet (CLC, 17% protein, 7.6% fat with additional 2% cholesterol, and 800 mg/kg choline), a low protein, high fat, high cholesterol, and low choline diet (LPHFCLC, 13% protein, 12.6% fat with additional 2% cholesterol, and 800 mg/kg choline) for 4 wk. Our data showed that the CLC and LPHFCLC diets induced hyperlipidemia. Histological examination and the content of hepatic lipids indicated that the CLC and LPHFCLC diets induced hepatic steatosis. Plasma dipeptidyl peptidase 4, a biomarker of fatty liver diseases in laying hens, increased in chickens fed with the CLC or LPHFCLC diets. Hepatic ballooning and immune infiltration were observed in these livers accompanied by elevated interleukin 1 beta and lipopolysaccharide induced tumor necrosis factor mRNAs suggesting that the CLC and LPHFCLC diets also caused steatohepatitis in these livers. These diets also induced hepatic steatosis in Plymouth Rock chickens. Thus, the CLC and LPHFCLC diets can be used to generate models for fatty liver diseases in different strains of chickens. In ISA chickens fed with the CLC diet, peroxisome proliferator-activated receptor γ, sterol regulatory element binding transcription factor 1, and fatty acid synthase mRNAs increased in the livers, suggesting that lipogenesis was enhanced by the CLC treatment. Our data show that treatment with CLC or LPHFCLC for 4 wk induces fatty liver disease in chickens. These diets can be utilized to rapidly generate chicken models for fatty liver research.

Keywords: chicken model; cholesterol; choline; fatty liver.


Figures

Figure 1
Figure 1
CLC and LPHFCLC induced hyperlipidemia in ISA chickens. (A) Body weights at week 0, 2, and 4 of ISA chickens fed either CON, LPHF, CLC, or LPHFCLC (1-way ANOVA) (B) Plasma TG and (C) cholesterol concentrations in ISA chickens at weeks 0, 2, and 4. Data are shown as mean ± SEM (n = 10, each group). Groups with no significant difference were labeled with a common letter (2-way ANOVA). Abbreviations: CLC, high cholesterol and low choline diet; CON, control diet; LPHF, low protein and high fat diet; LPHFCLC, low protein, high fat, high cholesterol, and low choline diet; TG, triglyceride.
Figure 2
Figure 2
CLC and LPHFCLC induced hepatic steatosis in ISA chickens. (A) Appearance of livers in ISA chickens fed with CON, LPHF, CLC, or LPHFCLC for 4 wk. (B) Oil Red O staining was used to detect the severity of lipid accumulation in livers of the above indicated chickens. Scale bar = 50 μm. The amount of (C) TG and (D) cholesterol in the livers of the above indicated chickens. The values for liver TG and cholesterol were normalized with the weights of liver samples. Data are shown as mean ± SEM (n = 10, each group). Groups with no significant difference were labeled with a common letter (1-way ANOVA). Abbreviations: CLC, high cholesterol and low choline diet; CON, control diet; LPHF, low protein and high fat diet; LPHFCLC, low protein, high fat, high cholesterol, and low choline diet; TG, triglyceride.
Figure 3
Figure 3
Plasma DPP4 was elevated in ISA chickens fed with CLC or LPHFCLC. The levels of plasma DPP4 in ISA chickens fed with CON, LPHF, CLC, or LPHFCLC for (A) 2 wk and (B) 4 wk. Data are shown as mean ± SEM (n = 10, each group). Groups with no significant difference were labeled with a common letter (1-way ANOVA). Abbreviations: CLC, high cholesterol and low choline diet; CON, control diet; DPP4, dipeptidyl peptidase 4; LPHF, low protein and high fat diet; LPHFCLC, low protein, high fat, high cholesterol, and low choline diet.
Figure 4
Figure 4
CLC and LPHFCLC induced nonalcoholic steatohepatitis in the livers of ISA chickens. (A) Livers of ISA chickens fed with CON, LPHF, CLC, or LPHFCLC stained with H&E. The white arrow indicates hepatic ballooning. Scale bar = 50 μm. (B) Livers of ISA chickens fed with CON, LPHF, CLC, or LPHFCLC stained with H&E. The green arrow indicates foci of immune infiltration. Scale bar = 100 μm. (C) Numbers of inflammatory foci in each section (H&E staining) were counted in 10 fields under 200× magnification. Field area = 0.145 mm2. The values for the 10 fields for each chicken were averaged. The relative levels of (D) hepatic LITAF and (E) IL1B mRNA in chickens fed with the indicated diets were analyzed by real-time PCR. The level of each gene was normalized with its internal control gene, PPIA. Data are shown as mean ± SEM (n = 10, each group). Groups with no significant difference were labeled with a common letter (1-way ANOVA). Abbreviations: CLC, high cholesterol and low choline diet; CON, control diet; H&E, hematoxylin and eosin; IL1B, interleukin 1 beta; LITAF, lipopolysaccharide induced tumor necrosis factor; LPHF, low protein and high fat diet; LPHFCLC, low protein, high fat, high cholesterol, and low choline diet; PPIA, peptidylprolyl isomerase A.
Figure 4
Figure 4
CLC and LPHFCLC induced nonalcoholic steatohepatitis in the livers of ISA chickens. (A) Livers of ISA chickens fed with CON, LPHF, CLC, or LPHFCLC stained with H&E. The white arrow indicates hepatic ballooning. Scale bar = 50 μm. (B) Livers of ISA chickens fed with CON, LPHF, CLC, or LPHFCLC stained with H&E. The green arrow indicates foci of immune infiltration. Scale bar = 100 μm. (C) Numbers of inflammatory foci in each section (H&E staining) were counted in 10 fields under 200× magnification. Field area = 0.145 mm2. The values for the 10 fields for each chicken were averaged. The relative levels of (D) hepatic LITAF and (E) IL1B mRNA in chickens fed with the indicated diets were analyzed by real-time PCR. The level of each gene was normalized with its internal control gene, PPIA. Data are shown as mean ± SEM (n = 10, each group). Groups with no significant difference were labeled with a common letter (1-way ANOVA). Abbreviations: CLC, high cholesterol and low choline diet; CON, control diet; H&E, hematoxylin and eosin; IL1B, interleukin 1 beta; LITAF, lipopolysaccharide induced tumor necrosis factor; LPHF, low protein and high fat diet; LPHFCLC, low protein, high fat, high cholesterol, and low choline diet; PPIA, peptidylprolyl isomerase A.
Figure 5
Figure 5
CLC and LPHFCLC induced hepatic steatosis in Plymouth Rock chickens. (A) Body weights of Plymouth Rock chickens fed CON, LPHF, CLC, or LPHFCLC at weeks 0, 2, and 4. (B) Appearance of livers in Plymouth Rock chickens fed the above indicated diets for 4 wk. (C) Oil Red O staining was used to detect the severity of lipid accumulation in livers of Plymouth Rock chickens fed the indicated diets for 4 wk. The amount of (D) TG and (E) cholesterol in the livers of Plymouth Rock chickens fed with the indicated diets for 4 wk. The values for hepatic TG and cholesterol were normalized with the weights of liver samples. CON, n = 6; LPHF, n = 5, CLC, n = 8; LPHFCLC, n = 6. Data are shown as mean ± SEM. Groups with no significant difference were labeled with a common letter (1-way ANOVA). Abbreviations: CLC, high cholesterol and low choline diet; CON, control diet; LPHF, low protein and high fat diet; LPHFCLC, low protein, high fat, high cholesterol, and low choline diet; TG, triglyceride.
Figure 6
Figure 6
The genes related to lipogenesis were upregulated in the livers of ISA chickens fed with CLC. (A) The mRNA levels of genes related to lipid metabolism and (B) DPP4 in the ISA chickens fed CON or CLC for 4 wk were analyzed using real-time PCR. The level of each gene was normalized with its internal control gene, PPIA. Data are shown as mean ± SEM (n = 10, each group). Unpaired t test, ∗P < 0.05, ∗∗P < 0.01. Abbreviations: ACC, acetyl-CoA carboxylase; CLC, high cholesterol and low choline diet; CON, control diet; CPT1A, carnitine palmitoyltransferase 1A; DPP4, dipeptidyl peptidase 4; FASN, fatty acid synthase; ns, not significant; PPIA, peptidylprolyl isomerase A; PPARA, peroxisome proliferator-activated receptor α; PPARG, peroxisome proliferator-activated receptor γ; SREBF1, sterol regulatory element binding transcription factor 1.

References

    1. Ampong I., Watkins A., Gutierrez-Merino J., Ikwuobe J., Griffiths H.R. Dietary protein insufficiency: an important consideration in fatty liver disease? Br. J. Nutr. 2020;123:601–609. - PubMed
    1. Arab J.P., Arrese M., Trauner M. Recent insights into the pathogenesis of nonalcoholic fatty liver disease. Annu. Rev. Pathol. 2018;13:321–350. - PubMed
    1. Ayala I., Castillo A.M., Adanez G., Fernandez-Rufete A., Perez B.G., Castells M.T. Hyperlipidemic chicken as a model of non-alcoholic steatohepatitis. Exp. Biol. Med. (Maywood) 2009;234:10–16. - PubMed
    1. Badaloo A., Reid M., Soares D., Forrester T., Jahoor F. Relation between liver fat content and the rate of VLDL apolipoprotein B-100 synthesis in children with protein-energy malnutrition. Am. J. Clin. Nutr. 2005;81:1126–1132. - PubMed
    1. Baumeier C., Schluter L., Saussenthaler S., Laeger T., Rodiger M., Alaze S.A., Fritsche L., Haring H.U., Stefan N., Fritsche A., Schwenk R.W., Schurmann A. Elevated hepatic DPP4 activity promotes insulin resistance and non-alcoholic fatty liver disease. Mol. Metab. 2017;6:1254–1263. - PMC - PubMed