. 2021:20:100001.
doi: 10.1074/mcp.RA120.002375. Epub 2020 Nov 24.

Protein Modification Characteristics of the Malaria Parasite Plasmodium falciparum and the Infected Erythrocytes

Affiliations

Protein Modification Characteristics of the Malaria Parasite Plasmodium falciparum and the Infected Erythrocytes

Jianhua Wang et al. Mol Cell Proteomics. 2021.

Abstract

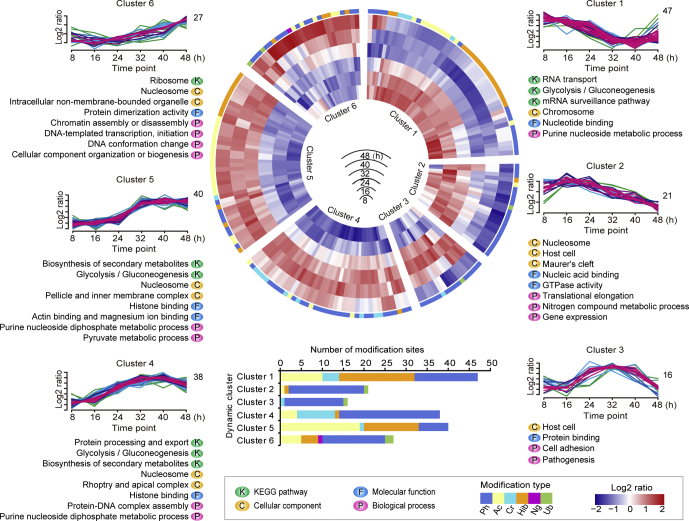
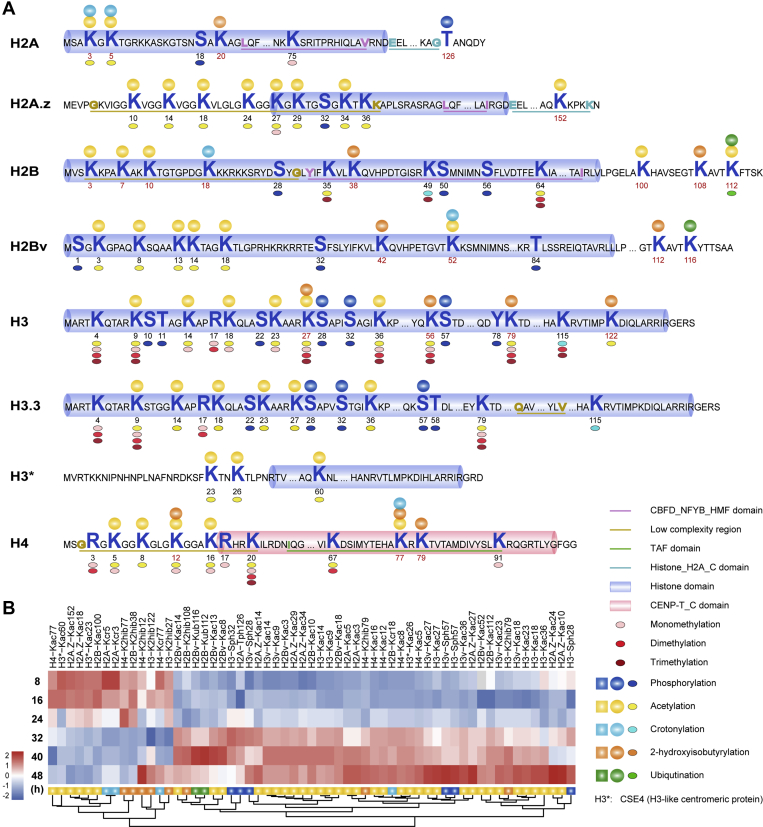
Malaria elimination is still pending on the development of novel tools that rely on a deep understanding of parasite biology. Proteins of all living cells undergo myriad posttranslational modifications (PTMs) that are critical to multifarious life processes. An extensive proteome-wide dissection revealed a fine PTM map of most proteins in both Plasmodium falciparum, the causative agent of severe malaria, and the infected red blood cells. More than two-thirds of proteins of the parasite and its host cell underwent extensive and dynamic modification throughout the erythrocytic developmental stage. PTMs critically modulate the virulence factors involved in the host-parasite interaction and pathogenesis. Furthermore, P. falciparum stabilized the supporting proteins of erythrocyte origin by selective demodification. Collectively, our multiple omic analyses, apart from having furthered a deep understanding of the systems biology of P. falciparum and malaria pathogenesis, provide a valuable resource for mining new antimalarial targets.

Keywords: Plasmodium falciparum; molecular function; protein posttranslational modification; regulation.


Conflict of interest statement

Conflict of interest The authors declare no competing interests.

Figures

None
Graphical abstract
Fig. 1
Fig. 1
Integration of proteome and six PTM-omics of P. falciparum and infected RBCs. A, histograms of proteomes and six PTM-omics of P. falciparum and pRBCs. The number of identified proteins and modification sites with significant variation (FDR < 0.01) are included. B, circos plot showing the abundance configurations of proteomes and six modification omics at each time point for P. falciparum proteins. The levels of each modification site at six time points are represented by a gradient color based on the Log2 geometric mean of the normalized expression values of the three repetitions. The larger the Log2 geometric mean, the darker the color. 1U = 100,000 amino acid. C, circos plot showing the abundance configurations of proteome and six modification omics at each time point of the RBC proteins. Ac, acetylation; Cr, crotonylation; FDR, false discovery rate; Hib, 2-hydroxyisobutyrylation; Ng, N-glycosylation; Ph, phosphorylation; Ub, ubiquitination.
Fig. 2
Fig. 2
Dynamic cluster heatmap of modification sites with significant changes (189 modification sites, FDR < 0.01) of P. falciparum proteins during the IDC. The circular heatmap in the middle represents the abundance variation of each modification site over time from 8, 16, 24, 32, 40, and 48 h after invasion. The redder the color, the higher the abundance. The bluer the color, the lower the abundance. The six sections of the heatmap correspond to the six clusters based on the abundance trends of modification during the IDC, and the main function terms enriched in each cluster are displayed below the graphs. The function entries were enriched from KEGG pathways (represented by “K”) and GO terms, which were divided into three categories: cell components (represented by “C”), molecular function (represented by “F”), and biological process (represented by “P”). FDR, false discovery rate; GO, Gene Ontology; IDC, intraerythrocytic development cycle; KEGG, Kyoto Encyclopedia of Genes and Genomes.
Fig. 3
Fig. 3
Dynamic cluster heatmap of modification sites with significant changes (348 modification sites, FDR < 0.01) of RBC proteins. The circular heatmap in the middle represents the abundance variation of each modification site of healthy RBC proteins and of P. falciparum−infected RBC proteins over time from 8, 16, 24, 32, 40, and 48 h after invasion. The redder the color, the higher the abundance. The bluer the color, the lower the abundance. The six sections of the heatmap correspond to the six clusters based on the abundance trends of modification during the IDC, and the main function terms enriched in each cluster are displayed below the graphs. The function entries were enriched from KEGG pathways (represented by “K”) and GO terms, which were divided into three categories: cell components (not shown in the figure), molecular function (represented by “F”), and biological process (represented by “P”). FDR, false discovery rate; GO, Gene Ontology; IDC, intraerythrocytic development cycle; KEGG, Kyoto Encyclopedia of Genes and Genomes.
Fig. 4
Fig. 4
PTMs of histones (H2A, H2B, H3, and H4) and histone variants (H2A.z, H2B variant, H3 variant, and H3-like centromeric protein CSE4). A, distribution diagram of modification sites of histones and histone variants. The conserved domains, including the histone domain, Histone_H2A_C domain, CBFD_NFYB_HMF domain, CENP-T_C domain, low complexity region, and TAF domain, are marked with colored lines. The PTMs identified in this study are presented on the corresponding amino acids, and novel PTMs identified are indicated with circular spheroids with gradient colors. PTMs identified earlier are represented underneath the corresponding amino acids in small oblate spheroids with even colors. Methylation (including monomethylation, dimethylation, and trimethylation) identified earlier is also displayed in addition to the modifications involved in this research. B, dynamic cluster heatmap of quantifiable modification sites on histones and histone variants. Log2 geometric means of normalized expression values (from the signal intensity of MS/MS) of the three repetitions were used to indicate the abundance of the modification site at a specific time during the IDC. The redder the color, the higher the abundance. The bluer the color, the lower the abundance. The middle color is white. The modification sites are named “histone name-amino acid-site number-PTM type.” (Notes: In most PTM-omics studies, the number of amino acid positions takes the starting amino acid methionine [M] as Position 1, so “M” was marked as Position 1 in the full text of this article. However, the number of sites of histones takes the next amino acid “M” as Position 1 in the existing histone modification research on P. falciparum. To facilitate the comparison and discussion with the existing literature, we subtracted one from the number of all histone sites, which was consistent with the previous studies on histone modifications in P. falciparum.) IDC, intraerythrocytic development cycle; PTMs, posttranslational modifications.
Fig. 5
Fig. 5
Networks of modified proteins associated with gene regulation and expression. Histone-related proteins are shown in the middle of the top area. The left and right sides are transcription-related proteins, including the transcription factors, splicing factors, and elongation factors. The elliptical region below indicates translation-related proteins, including the translation factors and ribosomal proteins in the middle and the elongation factors on both sides. Small triangles represent nucleic acid-binding proteins distributed in multiple regions. The colors of the lines indicate Pearson's correlation (Pearson's correlation > 0.9). The red line represents a positive correlation, and the blue line represents a negative correlation. Modification type and PTMs dynamic profiling are shown in the figure. PTMs, posttranslational modifications.
Fig. 6
Fig. 6
The posttranslational modifications of pathogenesis-related proteins in P. falciparum. A, the bar chart shows the number of modification sites in each pathogenesis-related parasite protein family. B, dynamic cluster heatmap of modification sites of the proteins during the IDC. The heatmap represents the abundance variation of each modification site over time. The modification sites are named “protein name-amino acid type-site number-PTM type,” such as “MSP1−K325−Cr.” C, the modification of MSP1. The conserved domains and modification sites of MSP1 are shown in the figure. The conserved domains contain the 235 kDa-fam superfamily domain, MSP1_C domain, EGF_MSP1_1 domain, and EGF_3 domain. IDC, intraerythrocytic development cycle; MSP 1, merozoite surface protein 1; PTM, posttranslational modifications.
Fig. 7
Fig. 7
Protein–protein interaction network of disease-related proteins of RBCs. The proteins in the interaction network contain complement factors (C2, C3, C4A, C4B, C4BPB, and C8A), complement receptor CR1/CD35, CD molecules (CD44, CD55), hemoglobin (HBA, HBB), and apolipoproteins (APOA1, APOL1). The size of the circle represents the node degree (depending on the number of connecting lines), and the colors of the lines indicate Pearson's correlation (Pearson's correlation >0.8). The red line represents a positive correlation, and the blue line represents a negative correlation. The stronger the correlation, the darker the color. Histograms of dynamic abundance variation of each modification site are displayed in the circles. PTMs, posttranslational modifications.

Similar articles

Cited by

References

    1. World Health Organization (WHO) WHO; Geneva, Switzerland: 2019. World Malaria Report 2019.
    1. Arie S. Researchers and WHO clash over global threat of drug resistant malaria. BMJ. 2017;359:j5127. - PubMed
    1. Ashley E.A., Pyae Phyo A., Woodrow C.J. Malaria. Lancet. 2018;391:1608–1621. - PubMed
    1. Cowman A.F., Healer J., Marapana D., Marsh K. Malaria: biology and disease. Cell. 2016;167:610–624. - PubMed
    1. Miller L.H., Baruch D.I., Marsh K., Doumbo O.K. The pathogenic basis of malaria. Nature. 2002;415:673–679. - PubMed

Publication types

MeSH terms

LinkOut - more resources