. 2022 Aug 26;226(3):441-452.
doi: 10.1093/infdis/jiab048.

Long-Lasting Imprint in the Soluble Inflammatory Milieu Despite Early Treatment of Acute Symptomatic Hepatitis C

Affiliations

Long-Lasting Imprint in the Soluble Inflammatory Milieu Despite Early Treatment of Acute Symptomatic Hepatitis C

Tanvi Khera et al. J Infect Dis. .

Abstract

Background: Treatment with direct-acting antivirals (DAAs) in patients with chronic hepatitis C infection leads to partial restoration of soluble inflammatory mediators (SIMs). In contrast, we hypothesized that early DAA treatment of acute hepatitis C virus (HCV) with DAAs may normalize most SIMs.

Methods: In this study, we made use of a unique cohort of acute symptomatic hepatitis C patients who cleared HCV with a 6-week course of ledipasvir/sofosbuvir. Plasma samples were used for proximity extension assay measuring 92 proteins.

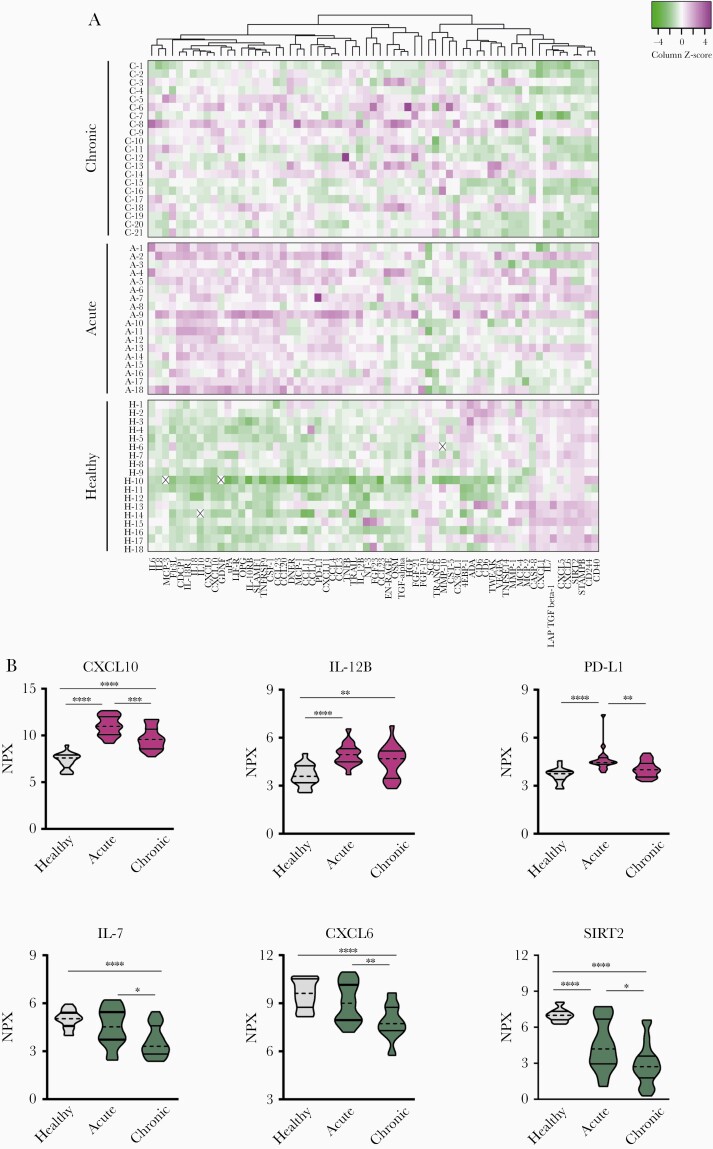
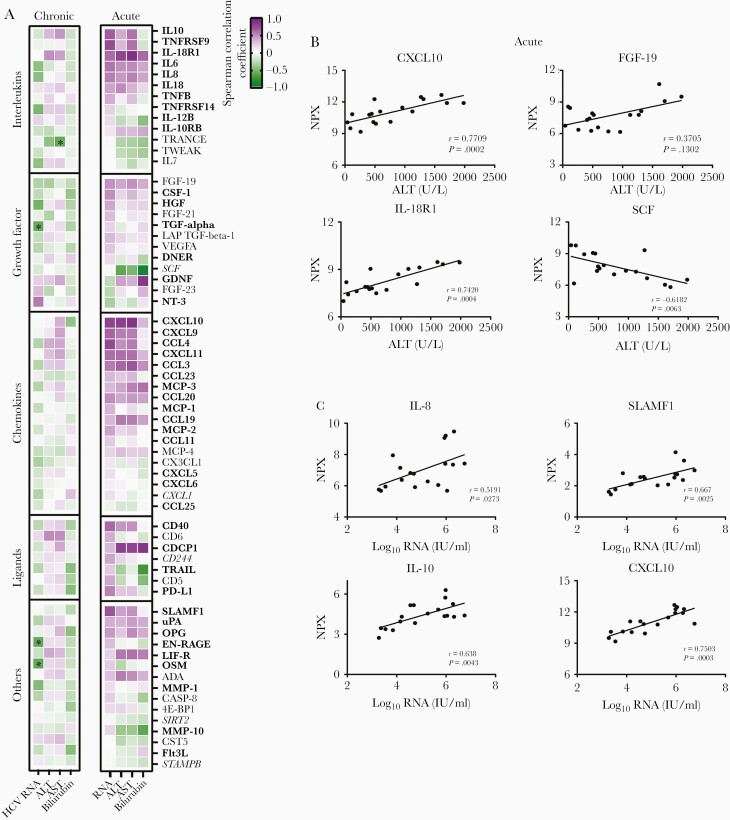
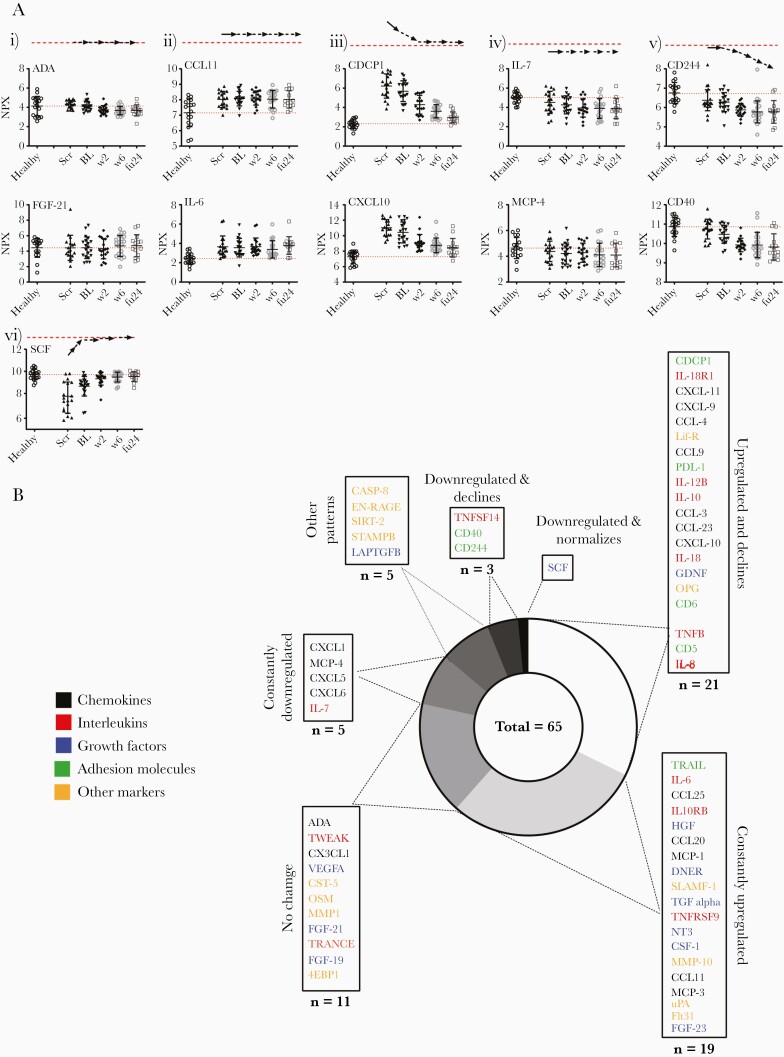
Results: Profound SIM alterations were observed in acute HCV patients, with marked upregulation of interleukin (IL)-6 and CXCL-10, whereas certain mediators were downregulated (eg, monocyte chemoattractant protein-4, IL-7). During treatment and follow-up, the majority of SIMs decreased but not all normalized (eg, CDCP1, IL-18). Of note, SIMs that were downregulated before DAA treatment remained suppressed, whereas others that were initially unchanged declined to lower values during treatment and follow-up (eg, CD244).

Conclusions: Acute hepatitis C was associated with marked changes in the soluble inflammatory milieu compared with both chronic hepatitis patients and healthy controls. Whereas early DAA treatment partly normalized this altered signature, long-lasting imprints of HCV remained.

Keywords: acute infection; direct-acting antivirals; hepatitis C virus; proximity extension assay; soluble inflammatory milieu.


Figures

Figure 1.
Figure 1.
Study population and the overview of the proximity extension assay. (A) Patients with acute symptomatic hepatitis C virus (HCV) infection (n = 20) from the HepNET Acute HCV IV study, treated early with ledipasvir (LDV) plus sofosbuvir (SOF) for 6 weeks were analyzed. As control, chronic patients (n = 23) treated with the same regimen for 8–12 weeks were included. In addition, healthy donors (n = 20) were used. Plasma was collected from all of these cohorts. Proximity extension assay was performed profiling a total of 92 cellular proteins across 96 samples simultaneously. Ninety-two antibody pairs, labeled with deoxyribonucleic acid (DNA) oligonucleotides, bind their target antigen in solution. Oligonucleotides that are in proximity hybridize and are extended by a DNA polymerase. This newly created piece of DNA barcode is amplified by polymerase chain reaction (PCR). The amount of each DNA barcode is quantified by microfluidic quantitative PCR. All samples were analyzed in 1 run. (B) Inflammation panel: in total, 92 soluble inflammatory molecules were measured, 65 of which were selected and categorized into chemokines, cytokines, growth factor, ligands, and others. The remaining 27 soluble inflammatory mediators were below the limit of detection and were excluded from analysis.
Figure 2.
Figure 2.
Distinct expression of the inflammation markers in acute and chronic hepatitis C virus compared with healthy control. (A) Heat map displaying expression pattern of 65 inflammation markers measured using proximity extension assay. Normalized data are presented with Z-score. Screen of the acute (n = 18), baseline for the chronic (n = 21), and healthy donors (n = 18) are shown. The heat map was created using Heatmapper using complete linkage clustering method (dendrogram on columns) and Spearman’s rank correlation distance measurement method. (B) Soluble inflammatory mediators (SIMs) expression differs between acute and chronic hepatitis C before the onset of treatment compared with healthy donors. Expression levels of several SIMs is shown by violin plots either upregulated (purple) or downregulated (green) as compared with healthy controls (gray) before the start of direct-acting antiviral treatment at screen for acute and baseline for chronic. Samples were tested for normal distribution with Shapiro-Wilks test, and, if normally distributed, significant differences were calculated with one-way analysis of variance followed by Tukey’s test (CXCL-10, IL-12B, IL-7, CXCL-6, and SIRT-2). Not normally distributed samples (PD-L1) were tested for significance with Kruskal-Wallis test followed by Dunn’s multiple comparison test. *, P < .05; **, P < .01; ***, P < .001; ****, P < .0001.
Figure 3.
Figure 3.
Soluble inflammatory mediator (SIM) expression correlates with clinical parameters. (A) Heat map displaying the correlation between selected clinical markers and SIMs for (1) acute and (2) chronic hepatitis C. Correlation strength is indicated by color intensity. Spearman’s test was used for calculating correlation. Adjusted P values were corrected for multiple comparisons by Benjamini-Hochberg correction method shown by asterisks (P < .05). The proteins marked in bold show statistically significant expression compared with healthy donors. (B) Linear regression analysis (alanine aminotransferase [ALT] and (C) hepatitis C virus [HCV] ribonucleic acid [RNA]) for some of the selected markers for acute HCV patients is depicted in the individual plots along with Spearman’s correlation coefficient (r). FGF-19, fibroblast growth factor; SCF, stem cell factor; SLAMF1, signaling lymphocytic activation molecule.
Figure 4.
Figure 4.
Different kinetics of longitudinal soluble inflammatory mediator (SIM) expression before, during, and after treatment of acute hepatitis C. (A) The soluble inflammatory milieu does not normalize upon successful direct-acting antiviral treatment for the majority of markers. The plots indicate the duration for which the analysis was performed starting from screen, baseline, during therapy, end of treatment, and 24 weeks of follow-up. The plots indicate 2 representative SIMs for each pattern. The arrows over the plot indicate the expression pattern of the SIM during the course of treatment until follow-up. The red dotted lines indicate the threshold values. These are the normalized protein expression values of the healthy donors for the respective marker. Six different kinetics were observed as shown by arrows on top of each plot: (i) no change to healthy, (ii) constantly upregulated, (iii) upregulated and stepwise decline, (iv) constantly downregulated, (v) downregulated and decline, and (vi) downregulated and normalizes. (B) Pie chart summarizing the distribution of the various markers within each kinetic as shown above. The markers are color coded according to their function.
Figure 5.
Figure 5.
Cluster analysis depicts dynamic changes over time with no restoration after hepatitis C virus (HCV) cure in acute HCV. Principal component analysis (PCA) was performed with the median values of measured soluble factors in acute HCV-infected patients at screen (scr), baseline (BL), during treatment (W2), end of treatment (W6), and follow-up (Fu 24). These values were compared with healthy controls. Dots indicate the included time points/subgroups, and each vector represents an individual soluble inflammatory mediator with length and direction equaling to the contribution to PCA and the difference between the groups, respectively.

References

    1. Wedemeyer H, Dore GJ, Ward JW. Estimates on HCV disease burden worldwide—filling the gaps. J Viral Hepat 2015; 22(Suppl 1):1–5. - PubMed
    1. Wiegand J, Deterding K, Cornberg M, Wedemeyer H. Treatment of acute hepatitis C: the success of monotherapy with (pegylated) interferon alpha. J Antimicrob Chemother 2008; 62:860–5. - PubMed
    1. Deterding K, Grüner N, Buggisch P, et al. ; Hep-Net Acute HCV-III Study Group . Delayed versus immediate treatment for patients with acute hepatitis C: a randomised controlled non-inferiority trial. Lancet Infect Dis 2013; 13:497–506. - PubMed
    1. Zoulim F, Liang TJ, Gerbes AL, et al. . Hepatitis C virus treatment in the real world: optimising treatment and access to therapies. Gut 2015; 64:1824–33. - PMC - PubMed
    1. Jaeckel E, Cornberg M, Wedemeyer H, et al. ; German Acute Hepatitis C Therapy Group . Treatment of acute hepatitis C with interferon alfa-2b. N Engl J Med 2001; 345:1452–7. - PubMed

Publication types