. 2021 Sep 17;224(6):1048-1059.
doi: 10.1093/infdis/jiab060.

Microdrop Human Immunodeficiency Virus Sequencing for Incidence and Drug Resistance Surveillance

Affiliations

Microdrop Human Immunodeficiency Virus Sequencing for Incidence and Drug Resistance Surveillance

Sung Yong Park et al. J Infect Dis. .

Abstract

Background: Precise and cost-efficient human immunodeficiency virus (HIV) incidence and drug resistance surveillances are in high demand for the advancement of the 90-90-90 "treatment for all" target.

Methods: We developed microdrop HIV sequencing for the HIV incidence and drug resistance assay (HIDA), a single-blood-draw surveillance tool for incidence and drug resistance mutation (DRM) detection. We amplified full-length HIV envelope and pol gene sequences within microdroplets, and this compartmental amplification with long-read high-throughput sequencing enabled us to recover multiple unique sequences.

Results: We achieved greater precision in determining the stage of infection than current incidence assays, with a 1.2% false recency rate (proportion of misclassified chronic infections) and a 262-day mean duration of recent infection (average time span of recent infection classification) from 83 recently infected and 81 chronically infected individuals. Microdrop HIV sequencing demonstrated an increased capacity to detect minority variants and linked DRMs. By screening all 93 World Health Organization surveillance DRMs, we detected 6 pretreatment drug resistance mutations with 2.6%-13.2% prevalence and cross-linked mutations.

Conclusions: HIDA with microdrop HIV sequencing may promote global HIV real-time surveillance by serving as a precise and high-throughput cross-sectional survey tool that can be generalized for surveillance of other pathogens.

Keywords: Drug resistance mutations; Genomic surveillance; HIV; Incidence.


Figures

Figure 1.
Figure 1.
Microdrop human immunodeficiency virus (HIV) sequencing. A, HIV RNA is extracted from plasma specimens of HIV-positive individuals, from which unique molecular identifier (UMI)–tagged complementary DNA (cDNA) is synthesized. Three distinct UMIs are shown in purple, blue, and green. The UMI-tagged HIV cDNA templates are compartmentalized and amplified within droplets. These amplified full-length HIV envelope or pol gene templates are then recovered from the droplets by the addition of perfluoro-N-octane (PFO) for downstream long-read, high-throughput sequencing. B, Comparisons of HIV full-length envelope gene sequence recovery between microdrop sequencing, bulk polymerase chain reaction (PCR), and bulk PCR with less cDNA input across 20 Consortium for the Evaluation and Performance of HIV Incidence Assays (CEPHIA) specimens (Supplementary Tables 1 and 2). Microdrop sequencing produced 3–14 envelope sequences from all 20 specimens. However, conventional bulk PCR produced envelope sequences from only 3 specimens, 7439, 0435, and 6472. In addition, microdrop sequencing produced a greater number of unique sequences than bulk PCR, on average (8.4 vs 1.2; P < .001). Even when the UMI–tagged cDNA input was reduced, the average number of unique sequences obtained from microdrop sequencing was greater than that obtained from bulk PCR (8.4 vs 5.1; P = .01). Color version of this figure is available at Journal of Infectious Diseases online.
Figure 2.
Figure 2.
Consortium for the Evaluation and Performance of HIV Incidence Assays (CEPHIA) incident- and chronic-infection specimens. A, Geographic distribution of 83 incident-infection and 81 chronic-infection specimens. Shown in dark gray, incident-infection specimens were collected from North America (United States), South America (Brazil), and Africa (Kenya, Rwanda, and South Africa) and chronic-infection specimens were collected from North America (United States) and Africa (Rwanda, South Africa, and Uganda). The proportions of incident- and chronic-infection specimens from each continent are represented by red and blue bars, respectively. B, Human immunodeficiency (HIV) subtype and host factor profiles of incident-infection (left bars) and chronic-infection (right bars) specimens. Specimen subtype distributions—by sex/sexual behavior (female [F], men who have sex with men (MSM), or male [M] [non-MSM]), race/ethnicity, age, viral load (in HIV RNA copies/mL), and CD4 T-cell count— were compared between the incident and chronic infection groups. Color version of this figure is available at Journal of Infectious Diseases online.
Figure 3.
Figure 3.
Incidence testing with the human immunodeficiency virus (HIV) incidence and drug resistance assay. A, Fourteen full-length envelope gene sequences (denoted as cs1 (consensus sequence 1), cs2, etc.) obtained from specimen 2778 were aligned. The single lineage distance (SLD) was measured to be 6, which is determined by the average HD among 31 sequence pairs with HD below the HD cutoff (HDcut). SLD denotes the average HD between sequences from the same founder lineage. Individuals with recent infections have a relatively low SLD, and those with chronic infections a relatively high SLD, reflecting viral diversification over the course of infection. B, SLDs and genome similarity indexes (GSIs) of 83 incident-infection (red) and 81 chronic-infection (blue) specimens from the Consortium for the Evaluation and Performance of HIV Incidence Assays (CEPHIA) panel. GSI is a measurement of genome similarity,; individuals with recent infections would have relatively high GSIs, and those with chronic infections relatively low GSIs, reflective of viral diversification over the course of infection. All chronic-infection specimens except 1 were clustered within the region of high SLD and low GSI (SLD>θSLD=9.9 and GSI<θGSI=0.67), as marked by dotted lines. In contrast, most incident-infection specimens were located outside this region (SLDθSLD or GSIθGSI). C, Receiver operating characteristic curves for HDcut values of 30 (green), 50 (red), and 70 (blue), with    θSLD=9.9 and    θGSI=0.67. The area under the curve was maximal (0.94) at an HDcut of 50. D, Probability of being recent, PR(t), in the first and second half-year bins of 83 incident-infection specimens. The probability of being recent was estimated as the proportion of incident-infection specimens that we classified as incident infection in each bin. The 95% confidence interval was obtained by resampling specimens with replacement. Color version of this figure is available at Journal of Infectious Diseases online.
Figure 4.
Figure 4.
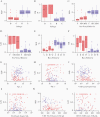
Incidence biomarkers and host factors. A, B, Single lineage distances (SLDs) (A) and genome similarity indexes (GSIs) (B) among incident-infection (red) and chronic-infection (blue) specimens, comparing subtypes B and C. A, Among incident-infection specimen, the SLDs of 45 subtype B specimens were comparable to those of 38 subtype C specimens (P = .23), and among chronic-infection specimens, the SLDs of 44 subtype B specimens were comparable to those of 37 subtype C specimens (P = .89). B, GSIs did not differ significantly between subtypes B and C among either incident-infection (P = .13) or chronic-infection (P = .18) specimens. C, D, SLDs (C) and GSIs (D) of specimens from female (F) donors and from male donors, including men who have sex with men (MSM) (MM), and non-MSM (MN). C, Among incident-infection specimens (red), SLDs did not differ significantly between 14 specimens from female (F) and 69 from male (MN or MM) donors (P = .10), or between 46 specimens from MSM (MM) or 37 from other donors (F or NM) (P = .51). Among chronic-infection specimens (blue), SLDs were comparable between 11 specimens from female and 70 from male (both MM and NM) donors (P = .69), and also between 40 specimens from MSM (MM) and 41 from other donors (F or NM) (P = .89). D, For both incident-infection and chronic-infection specimens, GSIs did not differ significantly between specimens from female and those from male donor groups (P = .21 and P = .56, respectively). For incident-infection specimens, GSIs did differ significantly between MSM and all other donors (F and MN) (P = .045), but chronic-infection specimens did not (P = .32). E, F, SLDs (E) and GSIs (F) of incident-infection (red) and chronic-infection (blue) specimens by donor race/ethnicity. E, SLDs of specimens from 13 Asian (A), 64 black (B), 24 Hispanic (H), and 60 white (W) donors. SLDs were significantly associated with race/ethnicity for incident-infection specimens (P = .004) but not for chronic-infection specimens (P = .43). F, GSIs were significantly associated with race/ethnicity for incident-infection specimens (P = .008), but not for chronic-infection specimens (P = .49). G, H, SLDs (G) and GSIs (H) for incident-infection (red) and chronic-infection (blue) specimens by donor age. G, SLDs were not associated with age for either incident-infection (r = −0.39; P = .08) or chronic-infection (r = 0.077; P = .50) specimens. H, GSIs were associated with age for incident-infection (r = 0.22; P = .045) but not for chronic-infection (r = −0.078; P = .49) specimens. I, J, SLDs (I) and GSIs (J) for incident-infection (red) and chronic-infection (blue) specimens by donor viral load. I, SLDs were not correlated with viral load for either incident-infection (r = −0.078; P = .49) or chronic-infection (r = 0.032; P = .78) specimens. J, GSIs were not correlated with viral load for either incident-infection (r = 0.086; P = .44) or chronic-infection (r = 0.024; P = .83) specimens. K, L, SLDs (K) and GSIs (L) for incident-infection (red) and chronic-infection (blue) specimens by CD4 T-cell count. K, SLDs were not correlated with CD4 T-cell count for either incident-infection (r = 0.063; P = .57) or chronic-infection (r = −0.28; P = .08) specimens. L, GSIs were not associated with CD4 T-cell count for either incident-infection (r = −0.15; P = .18) or chronic-infection (r = 0.14; P = .39) specimens. Color version of this figure is available at Journal of Infectious Diseases online.
Figure 5.
Figure 5.
Drug resistance screening with the human immunodeficiency virus (HIV) incidence and drug resistance assay (HIDA). A, Ten of the 38 treatment-naive Consortium for the Evaluation and Performance of HIV Incidence Assays (CEPHIA) specimens showed ≥1 or more surveillance drug resistance mutations (SDRMs), yielding a pretreatment drug resistance mutation (PDR) prevalence of 26.3% [12.3%–40.3%]. The PDR prevalence was 23.7% for the protease inhibitor (PI) group, and 21.1% for the nonnucleoside reverse-transcriptase inhibitor (NNRTI) group and 0% for both nucleoside reverse-transcriptase inhibitor (NRTI) and integrase strand transfer inhibitor (INSTI) groups. B, We detected 6 different SDRMs from the 38 specimens, and the prevalence of L90M and Y181C was highest at 13.2% (2.4%–23.9%). C, Predicted prevalence of high-level (red), intermediate-level (orange), and low-level (purple) resistance to each of 24 drugs screened. Abbreviations: 3TC, lamivudine; ABC, abacavir; ATV/r, atazanavir/ritonavir; AZT, azidothymidine; BIC, bictegravir; D4T, stavudine; DDI, didanosine; DOR, doravirine; DRV/r, darunavir/ritonavir; DTG, dolutegravir; EFV, efavirenz; ETR, etravirine; EVG, elvitegravir; FPV/r, fosamprenavir/ritonavir; FTC, emtricitabine; IDV/r, indinavir/ritonavir; LPV/r, lopinavir/ritonavir; NFV, nelfinavir; NVP, nevirapine; RAL, raltegravir; RPV, rilpivirine; SQV/r, saquinavir/ritonavir; TDF, tenofovir disoproxil fumarate; TPV/r, tipranavir/ritonavir. Color version of this figure is available at Journal of Infectious Diseases online.

References

    1. UNAIDS; Global HIV & AIDS statistics — 2020 fact sheet. https://www.unaids.org/en/resources/fact-sheet Accessed 22 March 2021.
    1. World Health Organization working group on HIV incidence measurement and data use. Meeting Report. March 3-4,2018, Boston, MA, USA.:
    1. Kassanjee R, Pilcher CD, Busch MP, et al. ; Consortium for the Evaluation and Performance of HIV Incidence Assays (CEPHIA) . Viral load criteria and threshold optimization to improve HIV incidence assay characteristics. AIDS 2016; 30:2361–71. - PMC - PubMed
    1. Kim AA, Rehle T. Assessing estimates of HIV incidence with a recent infection testing algorithm that includes viral load testing and exposure to antiretroviral therapy. Aids Res Hum Retrov 2018; 34:863–6. - PubMed
    1. Park SY, Love TMT, Reynell L, et al. . The HIV genomic incidence assay meets false recency rate and mean duration of recency infection performance standards. Sci Rep 2017; 7:7480. - PMC - PubMed

Publication types

Substances