. 2021 Jan 31;9(1):34.
doi: 10.1186/s40168-020-00988-6.

Gut microbiota-derived propionate mediates the neuroprotective effect of osteocalcin in a mouse model of Parkinson's disease

Affiliations

Gut microbiota-derived propionate mediates the neuroprotective effect of osteocalcin in a mouse model of Parkinson's disease

Yan-Fang Hou et al. Microbiome. .

Erratum in

Abstract

Background: Parkinson's disease (PD) is a neurodegenerative disorder with no absolute cure. The evidence of the involvement of gut microbiota in PD pathogenesis suggests the need to identify certain molecule(s) derived from the gut microbiota, which has the potential to manage PD. Osteocalcin (OCN), an osteoblast-secreted protein, has been shown to modulate brain function. Thus, it is of interest to investigate whether OCN could exert protective effect on PD and, if yes, whether the underlying mechanism lies in the subsequent changes in gut microbiota.

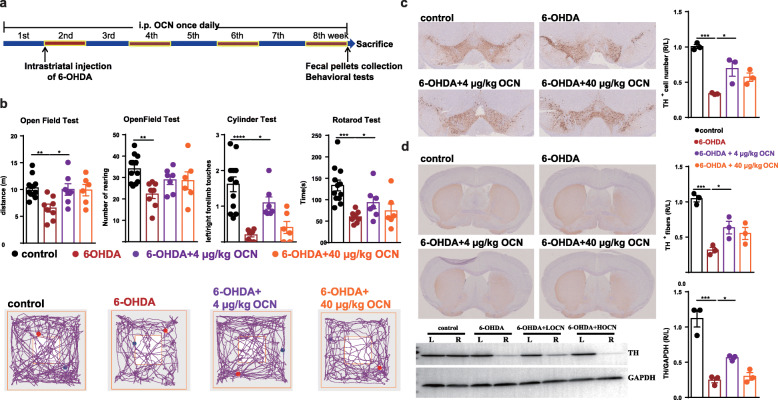
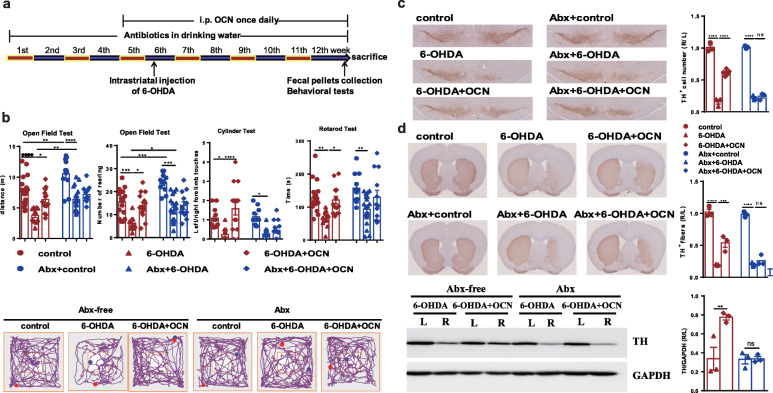
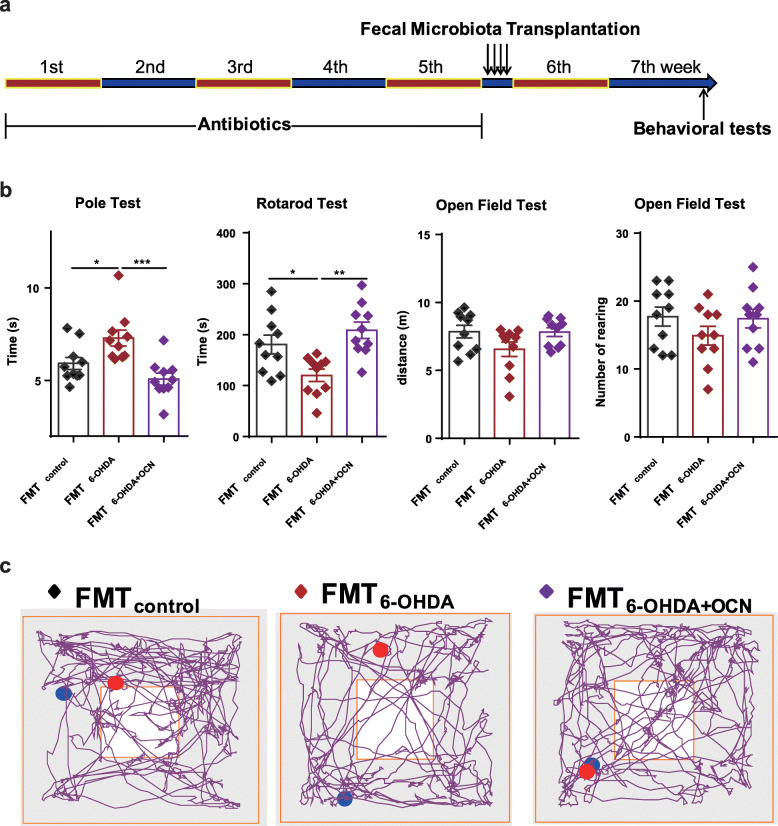
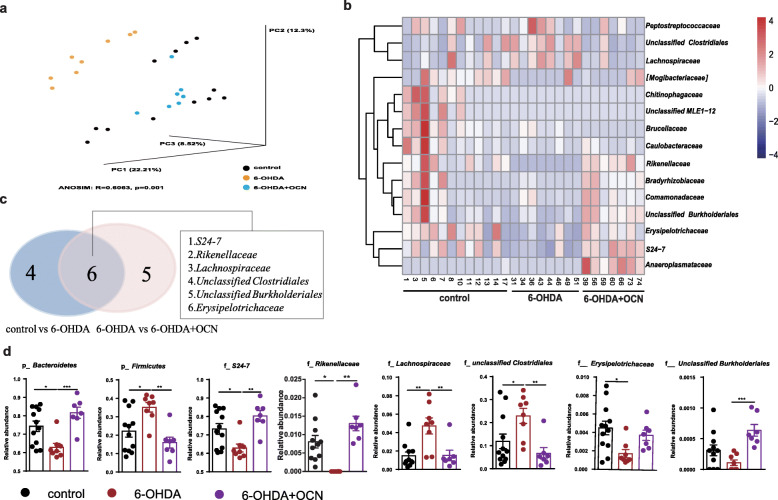
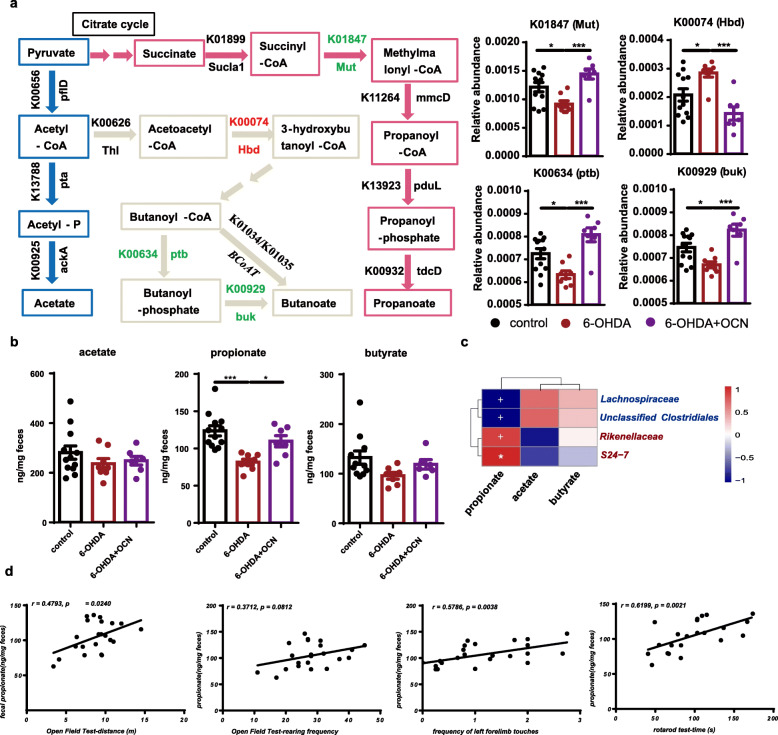
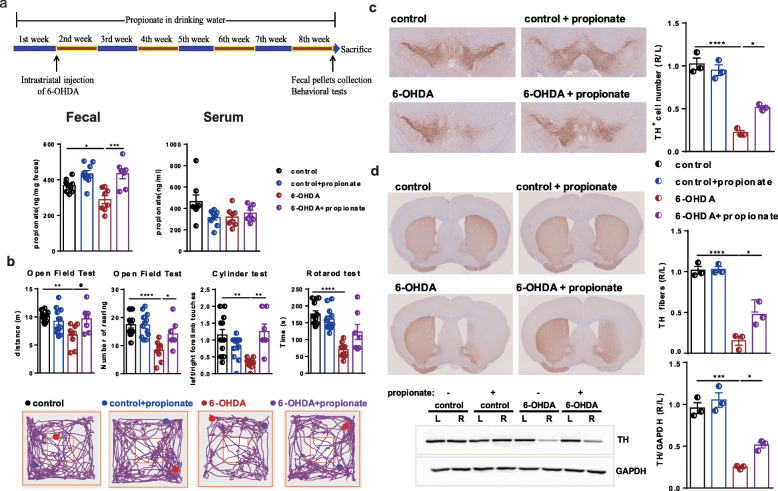
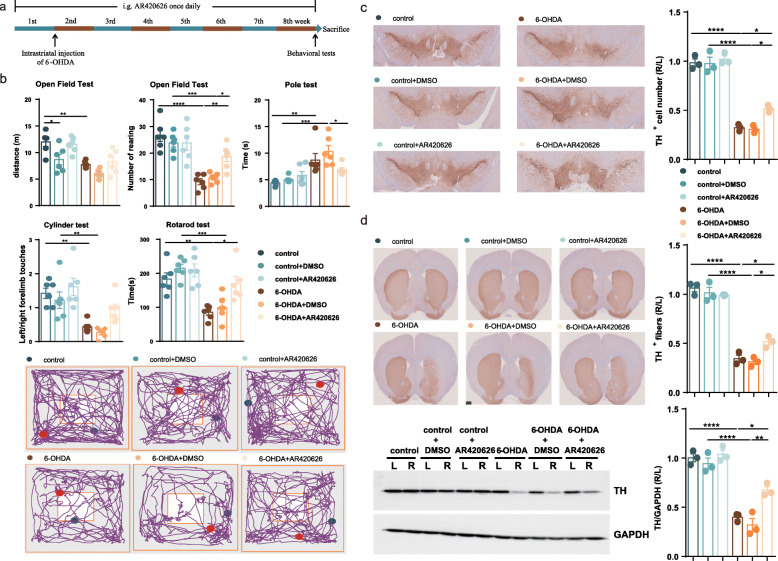
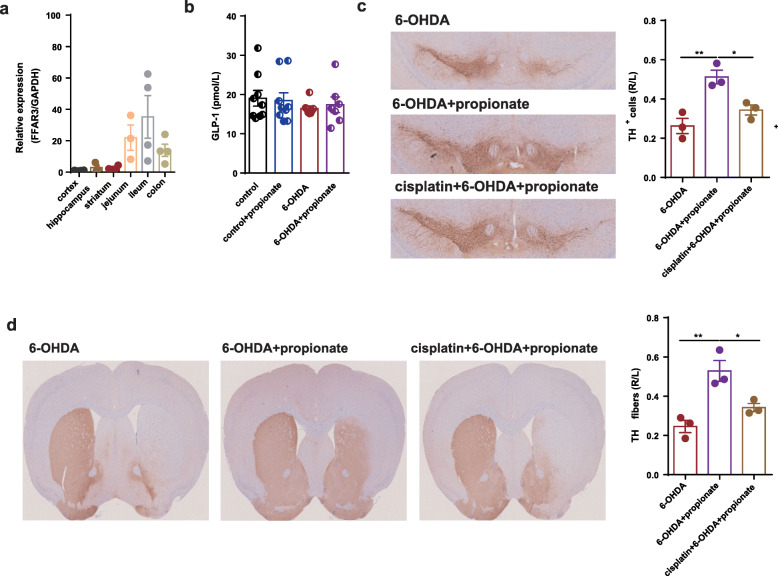
Results: The intraperitoneal injection of OCN can effectively ameliorate the motor deficits and dopaminergic neuronal loss in a 6-hydroxydopamine-induced PD mouse model. The further antibiotics treatment and fecal microbiota transplantation experiments confirmed that the gut microbiota was required for OCN-induced protection in PD mice. OCN elevated Bacteroidetes and depleted Firmicutes phyla in the gut microbiota of PD mice with elevated potential of microbial propionate production and was confirmed by fecal propionate levels. Two months of orally administered propionate successfully rescued motor deficits and dopaminergic neuronal loss in PD mice. Furthermore, AR420626, the agonist of FFAR3, which is the receptor of propionate, mimicked the neuroprotective effects of propionate and the ablation of enteric neurons blocked the prevention of dopaminergic neuronal loss by propionate in PD mice.

Conclusions: Together, our results demonstrate that OCN ameliorates motor deficits and dopaminergic neuronal loss in PD mice, modulating gut microbiome and increasing propionate level might be an underlying mechanism responsible for the neuroprotective effects of OCN on PD, and the FFAR3, expressed in enteric nervous system, might be the main action site of propionate. Video abstract.

Keywords: Gut microbiota; Osteocalcin; Parkinson’s disease; Propionate.


Conflict of interest statement

The authors declare no conflict of interest.

Figures

Fig. 1
Fig. 1
OCN administration prevented motor impairments and dopaminergic neuronal loss in 6-OHDA-induced PD mice. a The experimental design of OCN intervention in 6-OHDA-induced PD mice (6-OHDA was injected into the right striatum of the mice). b (Upper panel) Bar plots of performance in the behavioral tests, including the open field test, cylinder test and rotarod test. n = 6-12 per group. (Lower panel) Representative traces in the open field test. Blue point: starting position; red point: ending position. c (Left panel) Representative immunostaining showing TH-positive neurons in the SN. (Right panel) The average number of TH-positive neurons in the ST. n = 3 per group, 3 sections per mouse. d (Left panel) Representative immunostaining (upper) and western blotting (lower) showing TH-positive fibers and TH protein levels in the striatum. (Right panel) The quantitation of TH-positive fibers (upper) and TH protein levels (lower) in the striatum. Immunostaining: n = 3 per group, 3 sections per mouse; western blotting: n = 3 per group. LOCN = 4 μg/kg OCN, HOCN = 40 μg/kg OCN. The data represent the mean ± SEM, p < 0.05 was set as the threshold for significance by one-way ANOVA followed by post hoc comparisons using Tukey’s test for multiple groups’ comparisons, *p < 0.05, **p < 0.01, ***p < 0.001, ****p < 0.0001
Fig. 2
Fig. 2
Antibiotic pretreatment (Abx) blocked the OCN-induced improvements of motor impairments and dopaminergic neuronal loss in 6-OHDA-induced PD mice. a The experimental design for antibiotic treatment and 4 μg/kg OCN administration in 6-OHDA-induced PD mice. b (Upper panel) Bar plots of performance in the behavioral tests including the open field test, cylinder test, and rotarod test. n = 11-14 per group. (Lower panel) Representative traces in the open field test. Blue point: starting position; red point: ending position. c (Left panel) Representative immunostaining showing TH-positive neurons in the SN. (Right panel) The average number of TH-positive neurons in the ST. n = 3 per group, 3 sections per mouse. d (Left panel) Representative immunostaining (upper) and western blotting (lower) showing TH-positive fibers and TH protein levels in the striatum. (Right panel) The quantitation of TH-positive fibers (upper) and TH protein levels (lower) in the striatum. Immunostaining: n = 3 per group, 3 sections per mouse; western blotting: n = 3 per group. The data represent the mean ± SEM, p < 0.05 was set as the threshold for significance by one-way ANOVA followed by post hoc comparisons using Tukey’s test for multiple groups’ comparisons, *p < 0.05, **p < 0.01, *** p < 0.001, ****p < 0.0001
Fig. 3
Fig. 3
PD-derived microbiota induced PD-like motor impairments in gut microbiota-depleted mice. a The experimental design for fecal microbiota transplantation. b Bar plots of performance in the behavioral tests including pole test, rotarod test, and open field test. n = 10 per group. c Representative traces in the open field test. Blue point: starting position; red point: ending position. The data represent the mean ± SEM, p < 0.05 was set as the threshold for significance by one-way ANOVA followed by post hoc comparisons using Tukey’s test for multiple groups’ comparisons, *p < 0.05, **p < 0.01, ***p < 0.001, ****p < 0.0001
Fig. 4
Fig. 4
OCN administration modulated gut microbiota dysbiosis in 6-OHDA-induced PD mice. a Principal coordinate analysis (PCoA) plot based on unweighted UniFrac distance. b Heatmap of the gut microbiota taxa showed different RAs in different groups. Color key represents the RAs. c Venn diagram of differential taxa comparisons between control versus 6-OHDA and 6-OHDA+OCN versus 6-OHDA group. d Bar plots of the RAs of p_Bacteroidetes and p_Firmicutes at the phylum level and of overlapping taxa at the family levels indicated in c. The dosage of OCN was 4 μg/kg. n = 7–12 per group, data represent the mean ± SEM, p < 0.05 was set as the threshold for significance by one-way ANOVA followed by post hoc comparisons using Tukey’s test for multiple groups’ comparisons, *p < 0.05, **p < 0.01, ***p < 0.001, ****p < 0.0001
Fig. 5
Fig. 5
OCN administration increased fecal propionate levels in 6-OHDA-induced PD mice. a (Left panel) Metabolic pathway for acetate, propionate, and butyrate synthesis and corresponding KOs and genes are displayed. (Right panel) Bar plots of the RAs of K01847, K00634, K00929, and K00074, n = 7–12 per group. b Bar plots of comparing the fecal levels of acetate, propionate, and butyrate among groups. Data represent the mean ± SEM, *p < 0.05, **p < 0.01, ***p < 0.001, ****p < 0.0001. c Heatmap shows correlations analysis between the fecal level of SCFAs and the RAs of f_S24-7, f_Rikenellaceae, f_Lachnospiraceae, and f_unclassified Clostridiales. Color key represents the correlation coefficients, *p < 0.05, +p < 0.01. OCN-enriched taxa were marked in red color; depleted taxa were marked in blue. d Plots of correlation analysis between the fecal level of propionate and motor function. X-axis represented the values of open field test, cylinder test, and rotarod test; Y-axis represented the fecal propionate levels. K00656: pflD, formate C-acetyltransferase; K13788: pta, phosphate acetyltransferase; K00925: ackA, acetate kinase; K00626: Thl, acetyl-CoA C-acetyltransferase; K00074: Hbd, 3-hydroxybutyryl-CoA dehydrogenase; K00634: ptb, phosphate butyryltransferase; K00929: buk, butyrate kinase; K01034: but, acetate CoA-transferase alpha subunit; K01899: Sucla1, succinyl-CoA synthetase alpha subunit; K01847: Mut, methylmalonyl-CoA mutase; K11264: mmcD, methylmalonyl-CoA decarboxylase; K13923: pduL, phosphate propanoyltransferase; K00932: tdcD, propionate kinase; K01905: acdA, acetate-CoA ligase (ADP-forming) subunit alpha. The dosage of OCN was 4 μg/kg
Fig. 6
Fig. 6
Oral administration of propionate prevented motor impairments and dopaminergic neuronal loss in 6-OHDA-induced PD mice. a (Upper panel) The experimental design for propionate intervention in PD mice. (Lower panel) Quantitative measurement by GC/MS showing the fecal and serum levels of propionate. n = 7–12 per group. b (Upper panel) Bar plots of performance in the behavioral tests, including the open field test, cylinder test, and rotarod test. n = 7–12 per group. (Lower panel) Representative traces in the open field test. Blue point: starting position; red point: ending position. c (Left panel) Representative immunostaining showing TH-positive neurons in the SN. (Right panel) The average number of TH-positive neurons in the ST. n = 3 per group, 3 sections per mouse. d (Left panel) Representative immunostaining (upper) and western blotting (lower) showing TH-positive fibers and TH protein levels in the striatum. (Right panel) The quantification of TH-positive fibers (upper) and TH protein levels (lower) in the striatum. Immunostaining: n = 3 per group, 3 sections per mouse; western blotting: n = 3 per group. The data represent the mean ± SEM, p < 0.05 was set as the threshold for significance by one-way ANOVA followed by post hoc comparisons using Tukey’s test for multiple groups’ comparisons, *p < 0.05, **p < 0.01, ***p < 0.001, ****p < 0.0001
Fig. 7
Fig. 7
Intragastric administration of FFAR3 agonist prevented motor impairments and dopaminergic neuronal loss in 6-OHDA-induced PD mice. a The experimental design for FFAR3 agonist intervention in PD mice. b (Upper panel) Bar plots of performance in the behavioral tests, including the open field test, pole test, cylinder test, and rotarod test. n = 6 per group. (Lower panel) Representative traces in the open field test. Blue point: starting position; red point: ending position. c (Left panel) Representative immunostaining showing TH-positive neurons in the SN. (Right panel) The average number of TH-positive neurons in the ST. n = 3 per group, 3 sections per mouse. d (Left panel) Representative immunostaining (upper) and western blotting (lower) showing TH-positive fibers and TH protein levels in the striatum. (Right panel) The quantification of TH-positive fibers (upper) and TH protein levels (lower) in the striatum. Immunostaining: n = 3 per group, 3 sections per mouse; western blotting: n = 3 per group. The data represent the mean ± SEM, p < 0.05 was set as the threshold for significance by one-way ANOVA followed by post hoc comparisons using Tukey’s test for multiple groups’ comparisons, *p < 0.05, **p < 0.01, ***p < 0.001, ****p < 0.0001
Fig. 8
Fig. 8
Enteric nervous system mediated the neuroprotective effects of propionate in 6-OHDA-induced PD mice. a The relative expression of FFAR3 in cortex, hippocampus, striatum, jejunum, ileum, and colon. n = 4. b Bar plot of the serum level of Glp-1 among different groups. n = 7–12. c (Left panel) Representative immunostaining showing TH-positive neurons in the SN. (Right panel) The average number of TH-positive neurons in the ST. n = 3 per group, 3 sections per mouse. d (Left panel) Representative immunostaining showing TH-positive fibers in the striatum. (Right panel) The quantification of TH-positive fibers in the striatum. Immunostaining: n = 3 per group, 3 sections per mouse. The data represent the mean ± SEM, p < 0.05 was set as the threshold for significance by one-way ANOVA followed by post hoc comparisons using Tukey’s test for multiple groups’ comparisons, *p < 0.05, **p < 0.01, ***p < 0.001, ****p < 0.0001

References

    1. Postuma RB, Berg D, Stern M, Poewe W, Olanow CW, Oertel W, et al. MDS clinical diagnostic criteria for Parkinson's disease. Mov Disord. 2015;30(12):1591–1601. doi: 10.1002/mds.26424. - DOI - PubMed
    1. Obeso JA, Stamelou M, Goetz CG, Poewe W, Lang AE, Weintraub D, et al. Past, present, and future of Parkinson’s disease: a special essay on the 200th Anniversary of the Shaking Palsy. Mov Disord. 2017;32(9):1264–1310. doi: 10.1002/mds.27115. - DOI - PMC - PubMed
    1. Maetzler W, Berg D. Parkinson disease in 2017: Changing views after 200 years of Parkinson disease. Nat Rev Neurol. 2018;14(2):70–72. doi: 10.1038/nrneurol.2017.183. - DOI - PubMed
    1. Calabresi P, Castrioto A, Di Filippo M, Picconi B. New experimental and clinical links between the hippocampus and the dopaminergic system in Parkinson’s disease. Lancet Neurol. 2013;12(8):811–821. doi: 10.1016/S1474-4422(13)70118-2. - DOI - PubMed
    1. Zhou T, Zu G, Zhang X, Wang X, Li S, Gong X, et al. Neuroprotective effects of ginsenoside Rg1 through the Wnt/beta-catenin signaling pathway in both in vivo and in vitro models of Parkinson’s disease. Neuropharmacology. 2016;101:480–489. doi: 10.1016/j.neuropharm.2015.10.024. - DOI - PubMed

Publication types

MeSH terms