. 2021:62:100013.
doi: 10.1194/jlr.RA120000737. Epub 2020 Dec 17.

Deletion of lysophosphatidylcholine acyltransferase 3 in myeloid cells worsens hepatic steatosis after a high-fat diet

Affiliations

Deletion of lysophosphatidylcholine acyltransferase 3 in myeloid cells worsens hepatic steatosis after a high-fat diet

Thibaut Bourgeois et al. J Lipid Res. 2021.

Abstract

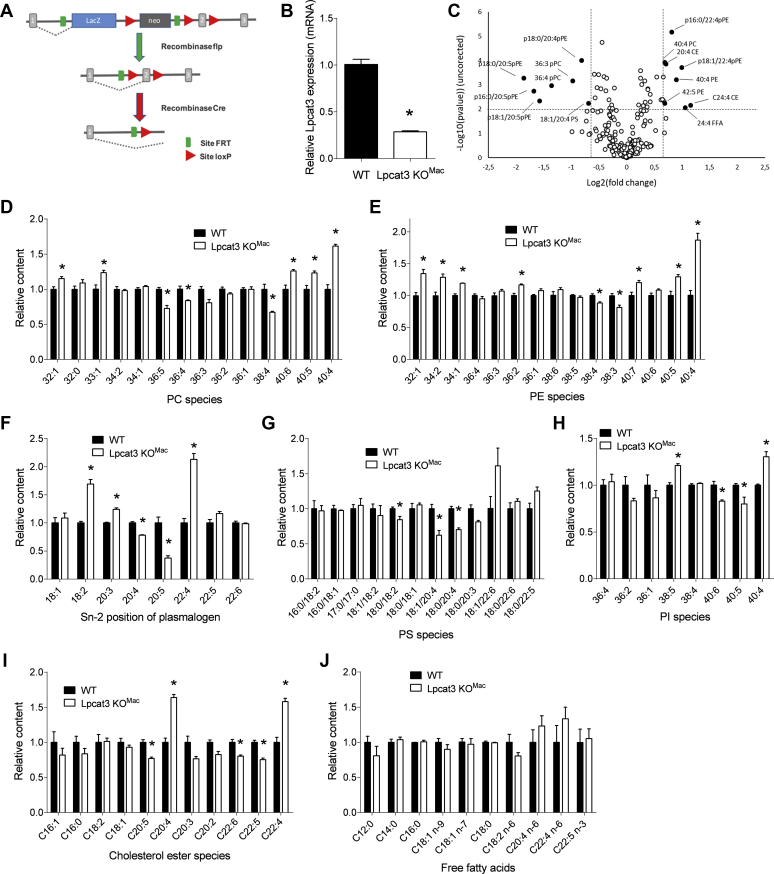
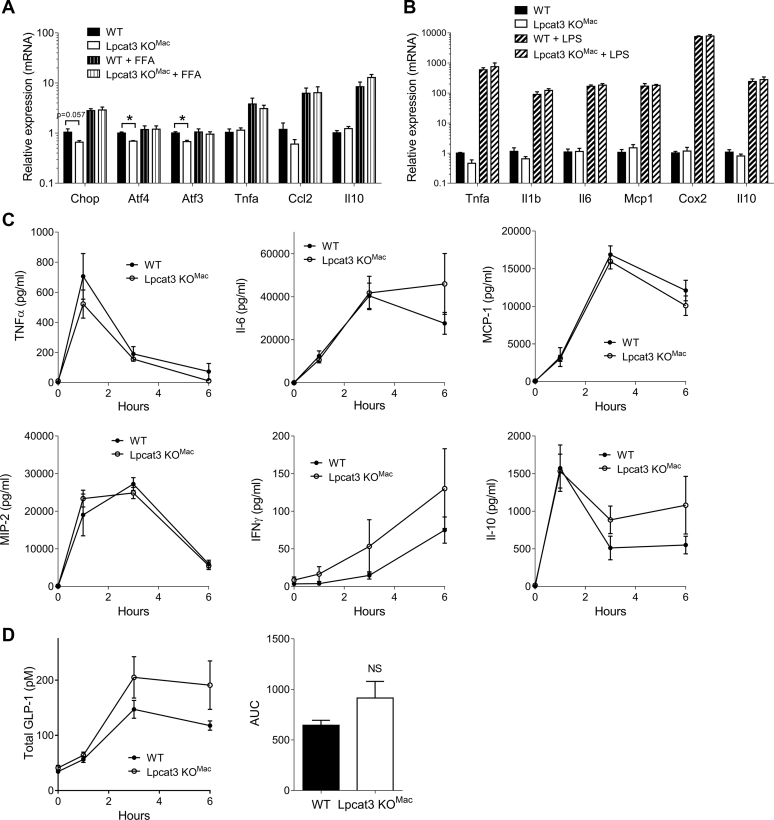
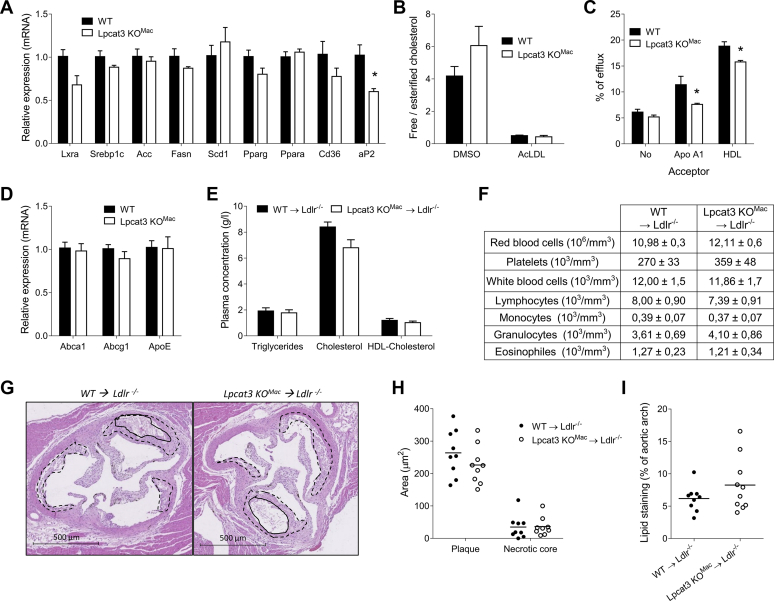
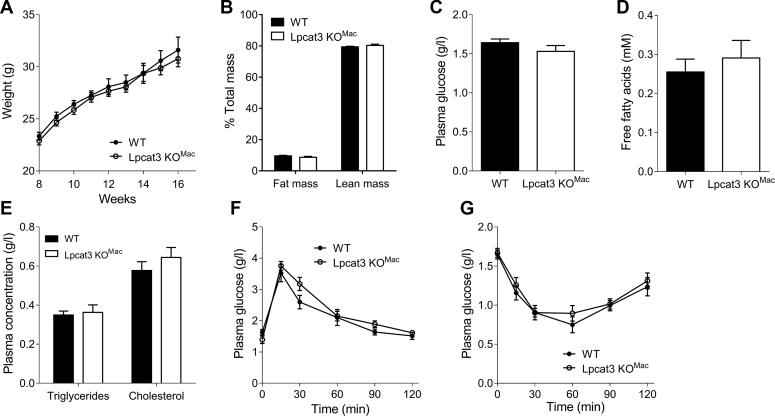
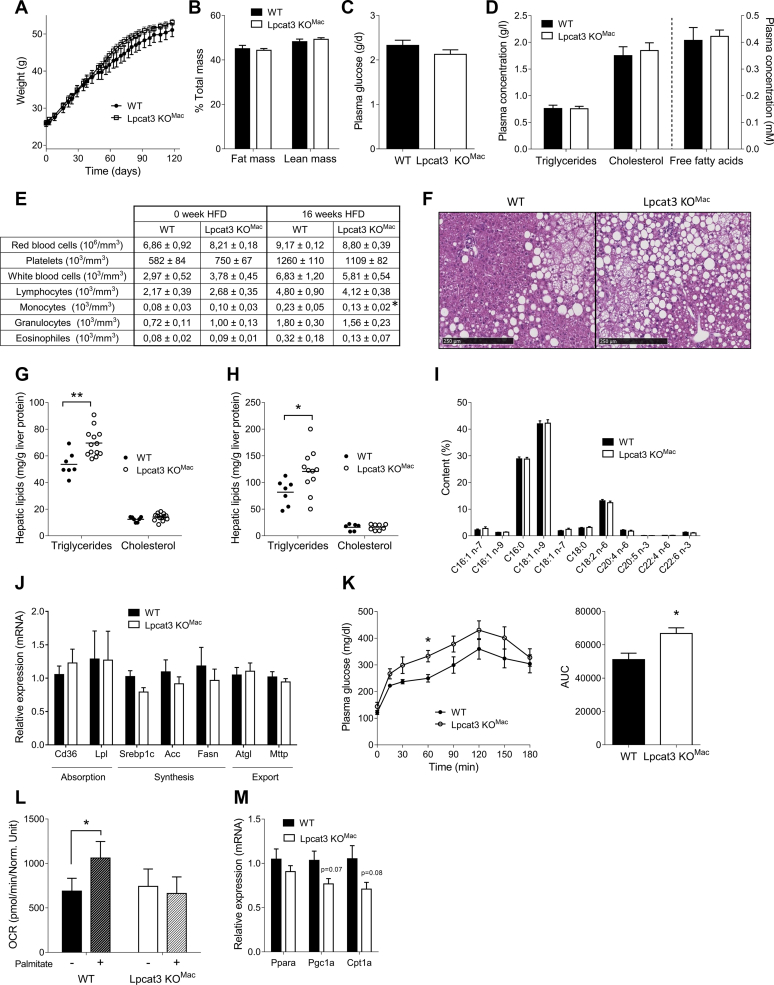
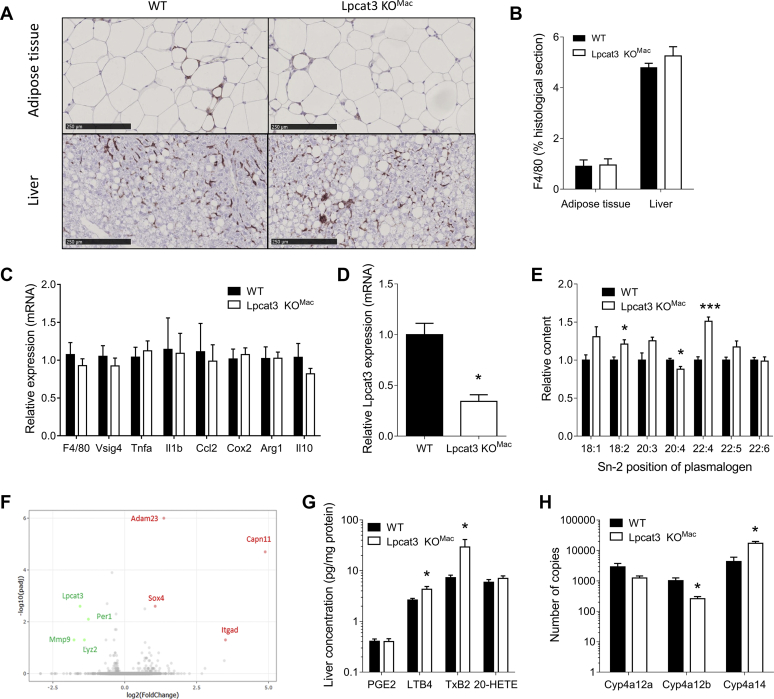
Recent studies have highlighted an important role for lysophosphatidylcholine acyltransferase 3 (LPCAT3) in controlling the PUFA composition of cell membranes in the liver and intestine. In these organs, LPCAT3 critically supports cell-membrane-associated processes such as lipid absorption or lipoprotein secretion. However, the role of LPCAT3 in macrophages remains controversial. Here, we investigated LPCAT3's role in macrophages both in vitro and in vivo in mice with atherosclerosis and obesity. To accomplish this, we used the LysMCre strategy to develop a mouse model with conditional Lpcat3 deficiency in myeloid cells (Lpcat3KOMac). We observed that partial Lpcat3 deficiency (approximately 75% reduction) in macrophages alters the PUFA composition of all phospholipid (PL) subclasses, including phosphatidylinositols and phosphatidylserines. A reduced incorporation of C20 PUFAs (mainly arachidonic acid [AA]) into PLs was associated with a redistribution of these FAs toward other cellular lipids such as cholesteryl esters. Lpcat3 deficiency had no obvious impact on macrophage inflammatory response or endoplasmic reticulum (ER) stress; however, Lpcat3KOMac macrophages exhibited a reduction in cholesterol efflux in vitro. In vivo, myeloid Lpcat3 deficiency did not affect atherosclerosis development in LDL receptor deficient mouse (Ldlr-/-) mice. Lpcat3KOMac mice on a high-fat diet displayed a mild increase in hepatic steatosis associated with alterations in several liver metabolic pathways and in liver eicosanoid composition. We conclude that alterations in AA metabolism along with myeloid Lpcat3 deficiency may secondarily affect AA homeostasis in the whole liver, leading to metabolic disorders and triglyceride accumulation.

Keywords: arachidonic acid; atherosclerosis; inflammation; insulin resistance; lipid metabolism; lysophosphatidylcholine acyltransferase 3 (LPCAT3); macrophages; obesity; phospholipid; steatosis.


Conflict of interest statement

Conflict of interest The authors declare that they have no conflicts of interest with the contents of this article.

Figures

Fig. 1
Fig. 1
Generation of Lpcat3KOMac mice and lipidomic characterization of Lpcat3-deficient macrophages. A: Lpcat3 targeting vector. A gene-trap LacZ cassette is located downstream of exon 2 of the Lpcat3 gene. B: Relative Lpcat3 mRNA levels in macrophages derived from WT and Lpcat3KOMac mice (four independent mice in each group). Data are expressed as mean ± SEM (∗P < 0.05 vs. WT Mann-Whitney test). C: Changes of lipidomic profile of Lpcat3KOMac versus WT macrophages (four independent mice in each group, P value at 0.01 and ±0.6 log-fold changes as cut off). D–J: Fatty acid composition of phosphatidylcholines (D), phosphatidylethanolamines (E), plasmalogens (F), phosphatidylserines (G), phosphatidylinositols (H), cholesterol esters (I), and free fatty acids (J) of WT and Lpcat3KOMac macrophages (n = 4 in each group). Data are expressed as mean + SEM (∗P < 0.05 vs. WT Mann-Whitney test).
Fig. 2
Fig. 2
ER stress and inflammatory response in Lpcat3KOMac mice. A: Relative mRNA levels of ER stress markers or inflammatory genes in macrophages from WT and Lpcat3KOMac mice and treated or not with 200 μM free fatty acids (oleate and palmitate) (n = 4 independent mice in each group). B: Relative expression of pro- or anti-inflammatory genes in macrophages from WT and Lpcat3KOMac mice treated or not with 100 ng/ml LPS (n = 4 independent mice in each group) Data are expressed as mean + SEM. (∗P < 0.05 vs. WT Mann-Whitney test by treatment condition). C, D: Plasma concentration of cytokines (C) and total GLP-1 (D) in WT and Lpcat3KOMac mice treated with 1 mg/kg LPS (n = 6 and 5, respectively). Data are expressed mean ± SEM (∗P < 0.05 vs. WT Mann-Whitney test for AUC).
Fig. 3
Fig. 3
Partial Lpcat3 deficiency restricted to myeloid cells does not induce atherosclerosis. A: Relative mRNA levels of genes involved in lipid metabolism (n = 4 vs. 4). B: Ratio of free to esterified cholesterol in WT and Lpcat3KOMac mouse-derived macrophages treated or not with acetylated LDL (n = 4 vs. 4 independent mice in each group). C: Cholesterol efflux with lipid-free ApoA-I or HDL was assessed in [3H] cholesterol-acetylated LDL loaded macrophages, n = 3 independent experiments. D: Relative mRNA levels of Abca1, Abcg1 and ApoE (n = 9 in each group) in WT and Lpcat3KOMac mouse-derived macrophages. E: Plasma lipid parameters from recipient Ldlr/ mice transplanted with WT and Lpcat3KOMac BMDM cells at 14 weeks of Western-type diet (n = 9 in each group). F: Blood cell counts from recipient Ldlr/ mice transplanted with WT and Lpcat3KOMac bone marrow cells (n = 9 in each group). G, H: HE staining of aortic valves from Ldlr/ recipient mice fed with a Western-type diet for 14 weeks. G: Dotted line, atheroma plaque; continuous line, necrotic core area. H: Analysis of plaque and necrotic core size. I: % of Oil Red O stained area in aortic arches of Ldlr/ recipient mice fed a 12 week WTD. Values are expressed mean + SEM (∗P < 0.05, ∗∗P < 0.01 vs. WT Mann-Whitney test).
Fig. 4
Fig. 4
Lpcat3KOMac mice grow normally under a chow diet. A: Weight gain of mature WT and Lpcat3KOMac mice fed a chow diet (n = 7 vs. 13, respectively). B: Fat mass and lean mass of WT and Lpcat3KOMac mice after 8 weeks of chow diet (n = 7 vs. 13, respectively). C–E: Plasma glucose (C), free fatty acids (D) and triglycerides, and cholesterol (E) were assessed in 6 h fasting WT and Lpcat3KOMac mice (n = 6 in each group). F, G: Oral glucose tolerance test (F) and insulin tolerance test (G) of 6 h fasting WT and Lpcat3KOMac mice after 8 weeks of chow diet (n = 6 in each group). Data are expressed mean ± SEM (∗P < 0.05 vs. WT Mann-Whitney test or Mann-Whitney test for AUC).
Fig. 5
Fig. 5
Lpcat3KOMac mice suffer from hepatic steatosis when fed a high-fat diet. A: Weight gain of mature WT and Lpcat3KOMac mice fed a high-fat diet (n = 7 and 13, respectively). B: Fat mass and lean mass of WT and Lpcat3KOMac mice after 16 weeks of high-fat diet (n = 7 and 13, respectively). Plasma glucose (C), free fatty acids and triglycerides, and cholesterol (D) were assessed in 6 h fasting WT and Lpcat3KOMac mice at the end of the diet (n = 7 and 13, respectively). E: Blood cell counts at the beginning and the end of HFD (n = 7 and 13, respectively). F: HE staining of liver of WT and Lpcat3KOMac mice after 16 weeks of high-fat diet. G, H: Measurements of lipid content in the liver of males (G, n = 7 vs. 13) and females (H, n = 7 vs. 11). I: Total fatty acid content in the liver of WT and Lpcat3KOMac mice (n = 7 vs. 13). J: Relative mRNA levels of genes involved in liver lipid metabolism pathways (n = 7 vs. 13). K: Pyruvate tolerance test of overnight fasting WT and Lpcat3KOMac mice and area under cover of this PTT. L: Oxygen consumption rate of primary hepatocytes of WT and Lpcat3KOMac mice, treated or not with palmitate. M: Liver relative mRNA levels of genes involved in fatty acid oxidation at the end of the HFD (n = 7 vs. 13). Data are expressed mean ± SEM (∗P < 0.05 vs. WT Mann-Whitney test).
Fig. 6
Fig. 6
Mechanisms involved in hepatic steatosis progression in Lpcat3KOMac mice when fed a high-fat diet for 16 weeks. A, B: F4/80 staining in histological sections of adipose tissue and liver of Ctrl and Lpcat3 KOMac (n = 7 vs. 13, respectively). C: Liver mRNA levels of inflammatory genes of wild-type and Lpcat3KOMac mice (n = 7 vs. 13, respectively). D: Relative Lpcat3 mRNA levels of in isolated Kupffer cells (n = 3 in each group). E: Relative content of fatty acid at the sn-2 position of pPE from isolated Kupffer cells after HFD. Data are expressed as a % of total pPE and are normalized as 1 in the WT group (n = 3 in each group). F: Volcano plot of differentially expressed genes in Kupffer cells at the end of the diet (n = 3 in each group). G: Eicosanoid content in the liver of WT and Lpcat3KOMac mice (n = 7 vs. 13, respectively). H: Relative mRNA levels of genes involved in Cytochrome P450 pathway in the whole liver (n = 4 in each group). Data are expressed as mean + SEM (∗P < 0.05 vs. WT Mann-Whitney test).

References

    1. Hishikawa D., Hashidate T., Shimizu T., Shindou H. Diversity and function of membrane glycerophospholipids generated by the remodeling pathway in mammalian cells. J. Lipid Res. 2014;55:799–807. - PMC - PubMed
    1. Shindou H., Hishikawa D., Harayama T., Eto M., Shimizu T. Generation of membrane diversity by lysophospholipid acyltransferases. J. Biochem. 2013;154:21–28. - PubMed
    1. Harayama T., Eto M., Shindou H., Kita Y., Otsubo E., Hishikawa D., Ishii S., Sakimura K., Mishina M., Shimizu T. Lysophospholipid acyltransferases mediate phosphatidylcholine diversification to achieve the physical properties required in vivo. Cell Metab. 2014;20:295–305. - PubMed
    1. Ishibashi M., Varin A., Filomenko R., Lopez T., Athias A., Gambert P., Blache D., Thomas C., Gautier T., Lagrost L., Masson D. Liver X receptor regulates arachidonic acid distribution and eicosanoid release in human macrophages. Arterioscler. Thromb. Vasc. Biol. 2013;33:1171–1179. - PubMed
    1. Rong X., Wang B., Dunham M.M., Hedde P.N., Wong J.S., Gratton E., Young S.G., Ford A.F., Tontonoz P. Lpcat3-dependent production of arachidonoyl phospholipids is a key determinant of triglyceride secretion. Elife. 2015;25:4. - PMC - PubMed

Publication types