. 2021 Jan 14:11:587622.
doi: 10.3389/fneur.2020.587622. eCollection 2020.

Glucose Metabolism Characteristics of Extra-Hypothalamic Cortex in Patients With Hypothalamic Hamartomas (HH) Undergoing Epilepsy Evaluation: A Retrospective Study of 16 Cases

Affiliations

Glucose Metabolism Characteristics of Extra-Hypothalamic Cortex in Patients With Hypothalamic Hamartomas (HH) Undergoing Epilepsy Evaluation: A Retrospective Study of 16 Cases

Yan-Feng Yang et al. Front Neurol. .

Abstract

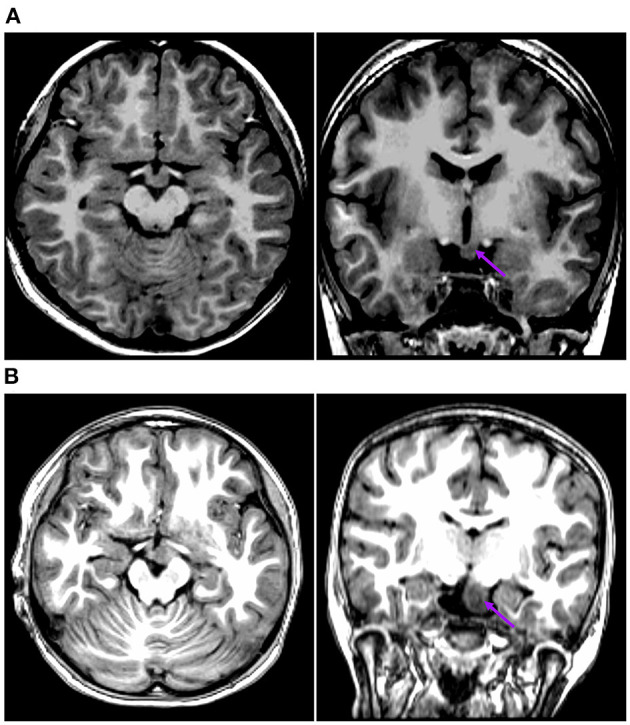
Purpose: There are few studies on the glucose metabolic characteristics of the extra-hypothalamic cortex in the hypothalamic hamartomas (HH). A comprehensive understanding of pathogenic progression of the disease is required from the perspective of cortical metabolism; therefore, we aimed to characterize metabolic characteristics of extra-hypothalamic in HH patients. Methods: We investigated the metabolic characteristics of 16 HH patients, all of whom underwent epilepsy evaluation at Xuan Wu Hospital between 2017 and 2019. The lateralization and cortical distribution pattern of hypometabolism was assessed and related to HH mass neuroanatomy on magnetic resonance imaging (MRI) as well as scalp-electroencephalogram (scalp-EEG) abnormalities. Furthermore, asymmetry measurements of region of interest (ROI) in the temporal cortex (hippocampal formation, amygdala, and lateral temporal neocortex) were quantitatively assessed based on the normalized average positron emission tomography (PET) voxel values. The surgery prognosis was assessed using the International League Against Epilepsy (ILAE) classification system. Results: The lateralization of hypometabolism in global visual ratings was consistent with the HH mass lateralization seen on MRI. Cortical hypometabolism showed three patterns depending whether the HH mass involved mammillary bodies, middle hypothalamus nucleus, or both. The three patterns were hypometabolism of the mesial temporal cortex with symptom of mesial temporal epilepsy (3/16, pattern I), lateral temporal, and extratemporal (frontal or parietal) cortex with symptom of neocortex temporal or frontal epilepsy (5/16, pattern II), and mesial and lateral temporal cortex and extratemporal (frontal or parietal) cortex with varied symptoms (8/16, pattern III), respectively. A significant difference in PET voxel values was found between bilateral hippocampal formation (P = 0.001) and lateral temporal neocortex in the third group (P = 0.005). We suggest that the hypometabolic characteristics of the extra-hypothalamic cortex in HH patients have three patterns. The final cortical hypometabolic pattern depends on the neuroanatomic location of the HH mass and was consistent with the main involved cortex of the interictal and ictal discharges. The third hypometabolic pattern with the most extensive cortical hypometabolism has a poorer prognosis.

Keywords: PET; epilepsy; extra-hypothalamic cortex; glucose metabolism; hypothalamic hamartomas.


Conflict of interest statement

The authors declare that the research was conducted in the absence of any commercial or financial relationships that could be construed as a potential conflict of interest.

Figures

Figure 1
Figure 1
This is the MRI-PET of Pt. 10 (A) and Pt. 7 (B) in the first cortical hypometabolic pattern group. T1-MPRAGE (left) and PET images (right) were co-registered and normalized in MNI reference. (A) Both the horizontal (A1) and the coronal (A2) plane of PET showed that the hypometabolic cortex is located in the left mesial temporal cortex. Quantification analysis of Pt. 10 showed the PET voxel value of the right hippocampus formation of 1.970, and for the left hippocampus formation of 1.771, with an asymmetric value of 11.3%. (B) Both the horizontal (B1) and the coronal (B2) of PET showed that the hypometabolic cortex is located in the left mesial temporal cortex. Quantification analysis of Pt. 7 showed the PET voxel value of the right hippocampus formation of 1.962, and for the left hippocampus formation of 1.759, with an asymmetric value of 11.5%.
Figure 2
Figure 2
This is the raw T1-MPRAGE images of Pt. 10 (A) and Pt. 7 (B) in the first cortical hypometabolic pattern group. The T1-MPRAGE images (arrows) of (A) and (B) showed an interruption on the continuity of the hypersignal of the mammillary bodies, and the structure in contact with the HH mass was unclear. The HH mass were entirely below the floor of the third ventricle, which hardly connected to the middle nuclei of the hypothalamus.
Figure 3
Figure 3
This is the MRI-PET of Pt. 1 (A) and Pt. 13 (B) in the second cortical hypometabolic group. T1-MPRAGE (left) and PET images (right) were co-registered and normalized in MNI reference. (A) The cortical hypometabolic region is located in right lateral temporal cortex (A1) and right frontal cortex (A2). (B) The cortical hypometabolic region is located in the left lateral temporal cortex (B1) and left parietal cortex (B2).
Figure 4
Figure 4
This is the raw T1-MPRAGE images of Pt. 1 (A) and Pt. 13 (B) in the second cortical hypometabolic pattern group. The T1-MPRAGE images (arrows) of (A) and (B) showed the mammillary bodies were surrounded by a ring of hypersignal with no interruption and the structure of the mammillary bodies unchanged. The HH mass were entirely above the floor of the third ventricle, tightly connected to the middle nuclei of the hypothalamus.
Figure 5
Figure 5
This is the MRI-PET of Pt. 16 (A), Pt. 9 (B), and Pt. 5 (C) in the third cortical hypometabolic pattern group. T1-MPRAGE (left) and PET images (right) were co-registered and normalized in MNI reference. (A) The cortical hypometabolic region is located in the right mesial temporal cortex (A1), right frontal cortex (A2), and right parietal cortex (A3). (B) The cortical hypometabolic region is located in the left mesial temporal cortex (B1), left lateral temporal cortex (B2), and left parietal cortex (B3). (C) The cortical hypometabolic region is located in the right mesial temporal cortex (C1), right lateral temporal cortex (C2), right frontal cortex (C3), and right parietal cortex (C4).
Figure 6
Figure 6
This is the raw T1-MPRAGE images of Pt. 9 (A), Pt. 16 (B), and Pt. 5 (C) in the third cortical hypometabolic pattern group. The T1-MPRAGE images (arrows) of (A–C) showed HH masses extended both above and below the third ventricle. The upper portion of the HH mass was located in the third ventricle, which closely connected with the middle nucleus of the hypothalamus. The lower portion was located below the third ventricle, tightly connected with the mammillary bodies.
Figure 7
Figure 7
This is the quantitative analysis of asymmetry measurements of [18F] FDG PET in ROI of the temporal cortex. No statistical asymmetry measurements were found between the hippocampal formation, the amygdala, and the lateral temporal neocortex, in the first (A) and second groups (B). (C) In the pattern III hypometabolic pattern group, the mean normalized PET voxel values were significantly higher in the contralateral hippocampus formations than that in the ipsilateral hippocampus formations (median [IQR]: 1.992 [1.882–2.105] vs. 1.788 [1.702–1.824], P < 0.05); and the mean normalized PET voxel values were significantly higher in the contralateral lateral temporal neocortex than that in the ipsilateral lateral temporal neocortex (median [IQR]: 4.003 [3.783–4.334] vs. 3.672 [3.262–3.732], P < 0.05). No significant differences were found between bilateral amygdala.

Similar articles

Cited by

References

    1. Berkovic SF, Andermann F, Melanson D, Ethier RE, Feindel W, Gloor P. Hypothalamic hamartomas and ictal laughter: evolution of a characteristic epileptic syndrome and diagnostic value of magnetic resonance imaging. Ann Neurol. (1988) 23:429–39. 10.1002/ana.410230502 - DOI - PubMed
    1. Kerrigan JF, Ng YT, Chung S, Rekate HL. The hypothalamic hamartoma: a model of subcortical epileptogenesis and encephalopathy. Semin Pediatr Neurol. (2005) 12:119–31. 10.1016/j.spen.2005.04.002 - DOI - PubMed
    1. Prigatano GP. Cognitive and behavioral dysfunction in children with hypothalamic hamartoma and epilepsy. Semin Pediatr Neurol. (2007) 14:65–72. 10.1016/j.spen.2007.03.004 - DOI - PubMed
    1. Striano S, Striano P, Coppola A, Romanelli P. The syndrome gelastic seizures-hypothalamic hamartoma: severe, potentially reversible encephalopathy. Epilepsia. (2009) 50 (Suppl. 5):62–5. 10.1111/j.1528-1167.2009.02125.x - DOI - PubMed
    1. Sonoda M, Masuda H, Shirozu H, Ito Y, Akazawa K, Asano E. Predictors of cognitive function in patients with hypothalamic hamartoma following stereotactic radiofrequency thermocoagulation Surgery. (2017) 58:1556–65. 10.1111/epi.13838 - DOI - PubMed

LinkOut - more resources