. 2021 Jan 15:11:610036.
doi: 10.3389/fmicb.2020.610036. eCollection 2020.

AtxA-Controlled Small RNAs of Bacillus anthracis Virulence Plasmid pXO1 Regulate Gene Expression in trans

Affiliations

AtxA-Controlled Small RNAs of Bacillus anthracis Virulence Plasmid pXO1 Regulate Gene Expression in trans

Ileana D Corsi et al. Front Microbiol. .

Abstract

Small regulatory RNAs (sRNAs) are short transcripts that base-pair to mRNA targets or interact with regulatory proteins. sRNA function has been studied extensively in Gram-negative bacteria; comparatively less is known about sRNAs in Firmicutes. Here we investigate two sRNAs encoded by virulence plasmid pXO1 of Bacillus anthracis, the causative agent of anthrax. The sRNAs, named "XrrA and XrrB" (for pXO1-encoded regulatory RNA) are abundant and highly stable primary transcripts, whose expression is dependent upon AtxA, the master virulence regulator of B. anthracis. sRNA levels are highest during culture conditions that promote AtxA expression and activity, and sRNA levels are unaltered in Hfq RNA chaperone null-mutants. Comparison of the transcriptome of a virulent Ames-derived strain to the transcriptome of isogenic sRNA-null mutants revealed multiple 4.0- to >100-fold differences in gene expression. Most regulatory effects were associated with XrrA, although regulation of some transcripts suggests functional overlap between the XrrA and XrrB. Many sRNA-regulated targets were chromosome genes associated with branched-chain amino acid metabolism, proteolysis, and transmembrane transport. Finally, in a mouse model for systemic anthrax, the lungs and livers of animals infected with xrrA-null mutants had a small reduction in bacterial burden, suggesting a role for XrrA in B. anthracis pathogenesis.

Keywords: Bacillus; RNA-seq; anthracis; anthrax; gene expression; plasmid; sRNA; transcription.


Conflict of interest statement

The authors declare that the research was conducted in the absence of any commercial or financial relationships that could be construed as a potential conflict of interest.

Figures

FIGURE 1
FIGURE 1
Sequences and PCVR-mediated regulation of sRNA loci on pXO1. (A) Read map of the virulence plasmid pXO1, focused on the 44.8 kb pathogenicity island, shows effect of individual PRD-containing virulence regulators (PCVRs) on RNA abundance. RNA-seq data from Raynor et al. (2018) was used to generate read map of gene expression for the Ames parent strain, the ΔatxAΔacpAΔacpB strain expressing empty vector (EV), and the individual PCVR complementations in the ΔatxAΔacpAΔacpB background. Genes showing apparent regulation by the PCVRs are labeled and direction of transcription is indicated with arrows. XrrA (sense) and XrrB (antisense) are indicated in bold. The boundaries of the pXO1 pathogenicity island, defined by inverted IS1627 elements, are indicated above the read map. (B) Sequences and transcriptional direction of the sRNA loci suggested by RNA-seq were confirmed by precise mapping of the 5′ and 3′ ends using RACE. Transcriptional start sites are indicated as +1. The 3′ termini of the transcripts are indicated (+182 for XrrA, +224 for XrrB), and the entire sRNA sequence is shown in bold. Predicted Rho-independent terminator sequences, according to mfold webserver, are underlined. The -10 and -35 nucleotides are shown upstream of the transcriptional start. RACE analysis was repeated 2–3 times per end per sRNA to confirm precise mapping.
FIGURE 2
FIGURE 2
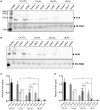
Characterization of XrrA and XrrB 5′ ends. To discern the type of 5′phosphate modification on XrrA and XrrB 5′ ends, total RNA from the parent strain ANR-1 grown in CA-CO2 was treated with RNA 5′ Polyphosphatase enzyme (5′PP), and/or Terminator exonuclease enzyme (TEX) in the combinations shown. 5′PP removes the gamma and beta phosphates from primary transcripts with a 5′ triphosphate, leaving a 5′ monophosphate. TEX preferentially degrades transcripts with a 5′ monophosphate. Total RNA was treated, as indicated, followed by northern blotting to probe for (A) XrrA and (B) XrrB signal. As a positive control for TEX-mediated degradation, levels of 23S and 16S rRNAs were also assessed. The northern blots shown are representative images of three biological replicates. (C) XrrA and (D) XrrB levels from the three biological replicates were normalized to the TEX-resistant 5S rRNA load control signal and averaged per treatment. The standard deviation in sRNA signal per treatment is shown. Analysis of variance (ANOVA) followed by Tukey’s multiple comparison test was used to determine significance. indicates < 0.05; ∗∗ indicates < 0.01; **** indicates < 0.0001.
FIGURE 3
FIGURE 3
AtxA-mediated control of XrrA and XrrB, and influence of growth conditions that affect AtxA expression and activity on sRNA expression. Total RNA from the Ames parent strain, the ΔatxA mutant, and the ΔacpA mutant was extracted from cultures grown in the indicated conditions until early stationary phase (OD600 = 1.0–1.5). Cultures were grown in CA or LB medium and exposed to 5% atmospheric CO2 or air during growth. Expression of (A) XrrA and (B) XrrB was assessed using northern blotting, and the 5S rRNA signal was used as a load control. A representative northern blot from three biological replicates is shown. (C) XrrA and (D) XrrB levels from the three biological replicates were normalized by 5S rRNA and averaged. The standard deviation in sRNA signal per sample is shown. Analysis of variance (ANOVA) followed by Tukey’s multiple comparison test was used to determine significance. indicates < 0.05; ∗∗ indicates < 0.01; ∗∗∗ indicates < 0.001; **** indicates < 0.0001. Asterisks directly above bars indicate significance of comparison between that bar and the “Parent CA-CO2” condition. Additional comparisons between conditions are shown linked by brackets, with respective significance indicated by asterisks above the brackets.
FIGURE 4
FIGURE 4
Half-life determination experiments using rifampicin treatment of growing cells. The ANR-1 parent strain, the Δhfq1 mutant, the Δhfq2 mutant, the Δhfq3 mutant, and the Δhfq1Δhfq2Δhfq3 mutant were grown in CA-CO2 until late exponential phase (OD600 = 0.6–0.8), followed by addition of 200 μg/ml of rifampicin to stop transcription initiation. Culture samples were taken immediately before rifampicin addition (indicated by time point 0) and 2, 4, 8, 16, 32, and 45 min post-addition of rifampicin. RNA was extracted from culture samples and subjected to northern blotting to assess (A) XrrA and (B) XrrB decay over time and calculate half-lives. (C) The half-life of the rpsO transcript, encoding the 30S ribosomal protein S15, in the parent strain was also calculated as an experimental control. RNA decay was calculated as the fraction of RNA signal normalized to 5S rRNA at time point 0. A linear regression was fit to averaged data from three biological replicates to calculate the slope of the decay, which was then used to calculate the half-lives. Analysis of variance (ANOVA) followed by Tukey’s multiple comparison analysis was used to determine significance in half-life differences between strains. Representative northern blots from the three biological replicates are shown.
FIGURE 5
FIGURE 5
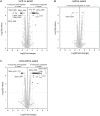
Transcriptomic analysis of sRNA-null mutants compared to the parent strain. The Ames-derived UTA37 parent strain, UTA38 (ΔxrrB), UTA39 (ΔxrrA), and UTA41 (ΔxrrAΔxrrB) were grown in CA-CO2 to early stationary phase (OD600 = 1.0–1.5) and RNA was extracted for RNA-seq analysis. Volcano plots show the effect of (A) ΔxrrA deletion, (B) ΔxrrB deletion, and (C) ΔxrrAΔxrrB deletion on RNA abundance, compared to the parent strain. Transcripts that showed significantly different expression levels are highlighted in black. Transcripts that did not show a significant difference in expression are shown in gray. The p-value cutoff was 0.01, which corresponds to a –log10(p-value) of 2, and the log2(fold-change) cutoff was ≥2.0, which represents a fold-change of ≥4.0. Significance and fold-change thresholds are indicated by dashed lines. Transcripts of interest are labeled.
FIGURE 6
FIGURE 6
Comparison of sRNA regulons uncovered by RNA-seq analysis. (A) Scatterplot graph showing the log2(fold-change) differences in transcript expression compared to the parent strain in the ΔxrrA and ΔxrrAΔxrrB mutants. Log2(fold-change) values from the ΔxrrA and ΔxrrAΔxrrB mutants are plotted on the x- and y-axis, respectively. Transcripts with a significant log2(fold-change) of ≥2.0 in at least one mutant strain are shown as circles. A linear regression model was fit to the data, and the R2 is shown. (B) Volcano plot showing a direct comparison of transcripts differentially regulated between the ΔxrrA and ΔxrrAΔxrrB mutants. Transcripts that were significantly differentially expressed between the deletion strains are highlighted in black. Transcripts that were not differentially regulated are shown in gray. The p-value cutoff was 0.01, which corresponds to a –log10(p-value) of 2, and the log2(fold-change) cutoff was ≥2.0, representing a fold-change of ≥ 4.0. Significance and fold-change thresholds are indicated by dashed lines.
FIGURE 7
FIGURE 7
Gene ontology analysis of genes of which expression was affected in the ΔxrrA and ΔxrrAΔxrrB strains. Genes that were differentially regulated in the (A) ΔxrrA and (B) ΔxrrAΔxrrB mutants with a fold-change of ≥4.0 compared to the parent strain were categorized based on biological processes. Pie charts show the total number of differentially regulated genes and the percentage of those genes that belong to a gene ontology category based on biological processes. Hypothetical proteins represent genes with unknown functions or no putative functions based on gene sequence analysis. The colored sections of the pie charts represent biological process categories associated with more than 2% of the strain regulons. Categories associated with 2% or less of the regulons are shown in gray and labeled as “other.”
FIGURE 8
FIGURE 8
Effect of sRNA deletions on virulence of B. anthracis in a murine model for systemic anthrax. Seven-week-old female A/J mice were infected intravenously via the tail-vein with ∼105 CFU of the ANR-1 parent strain (n = 15), the ΔxrrA mutant (n = 10), or the ΔxrrAΔxrrB mutant (n = 9). Mice were monitored for a period of 11 days. Moribund mice were sacrificed, time of death recorded, and liver, lung, kidney, and spleen were collected for CFU determinations to measure organ infection burden. (A) Survival analysis using the Kaplan–Meier estimate was used to determine significance between survival of ANR-1-infected and sRNA-null-infected mice. One ΔxrrA-infected mouse, and one ΔxrrAΔxrrB-infected mouse survived the 11-day period. All other mice succumbed to the infection. CFU/g of tissue of (B) liver, (C) lung, (D) kidney, and (E) spleen per infecting strain was calculated. The limit of detection is shown as a dashed line at 101 CFU. The surviving ΔxrrA-infected and ΔxrrAΔxrrB-infected mice showed no detectable CFU in the collected organs and are shown below the limit of detection at 100. Analysis of variance (ANOVA) followed by Tukey’s multiple comparisons analysis was used to determine significance between the CFU/g of tissue of each organ for ANR-1-infected, ΔxrrA-infected, and ΔxrrAΔxrrB-infected mice. indicates < 0.05; ∗∗ indicates < 0.01.

Similar articles

Cited by

References

    1. Afgan E., Baker D., Batut B., van den Beek M., Bouvier D., Cech M. (2018). The Galaxy platform for accessible, reproducible and collaborative biomedical analyses: 2018 update. Nucleic Acids Res. 46 W537–W544. 10.1093/nar/gky379 - DOI - PMC - PubMed
    1. Andrews S. (2010). FastQC A Quality Control tool for High Throughput Sequence Data. URL: http://www.bioinformatics.babraham.ac.uk/projects/fastqc/
    1. Argaman L., Hershberg R., Vogel J., Bejerano G., Wagner E. G., Margalit H., et al. (2001). Novel small RNA-encoding genes in the intergenic regions of Escherichia coli. Curr. Biol. 11 941–950. 10.1016/s0960-9822(01)00270-6 - DOI - PubMed
    1. Arthur D. C., Edwards R. A., Tsutakawa S., Tainer J. A., Frost L. S., Glover J. N. (2011). Mapping interactions between the RNA chaperone FinO and its RNA targets. Nucleic Acids Res. 39 4450–4463. 10.1093/nar/gkr025 - DOI - PMC - PubMed
    1. Bailey T. L., Boden M., Buske F. A., Frith M., Grant C. E., Clementi L., et al. (2009). MEME SUITE: tools for motif discovery and searching. Nucleic Acids Res. 37 W202–W208. 10.1093/nar/gkp335 - DOI - PMC - PubMed