. 2021 Jan 14:11:576743.
doi: 10.3389/fimmu.2020.576743. eCollection 2020.

Blockade of LAG-3 in PD-L1-Deficient Mice Enhances Clearance of Blood Stage Malaria Independent of Humoral Responses

Affiliations

Blockade of LAG-3 in PD-L1-Deficient Mice Enhances Clearance of Blood Stage Malaria Independent of Humoral Responses

Raquel Furtado et al. Front Immunol. .

Abstract

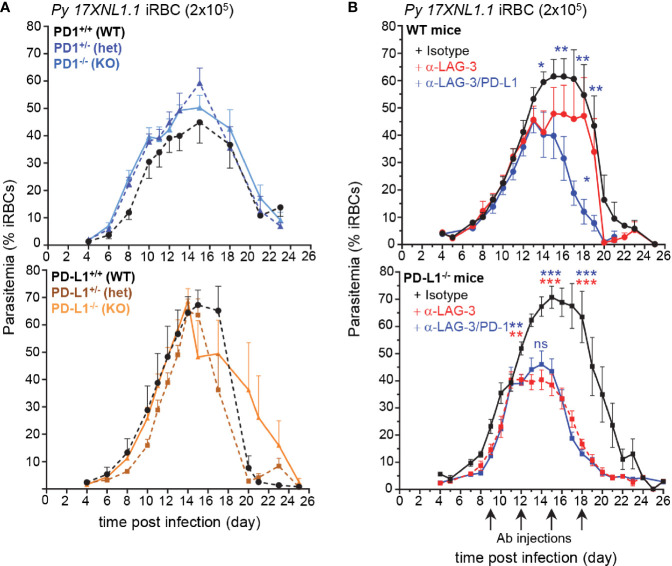
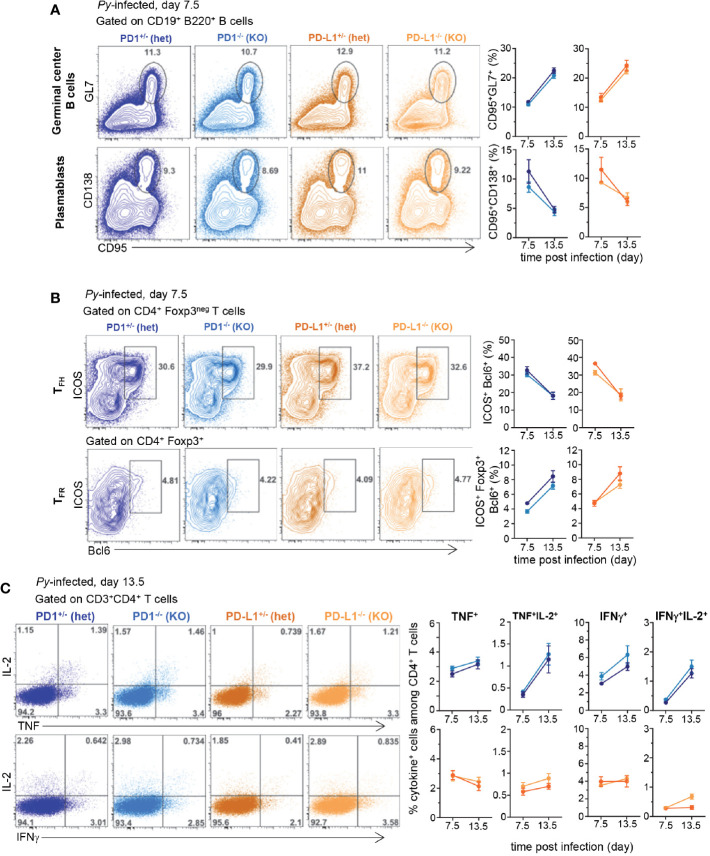
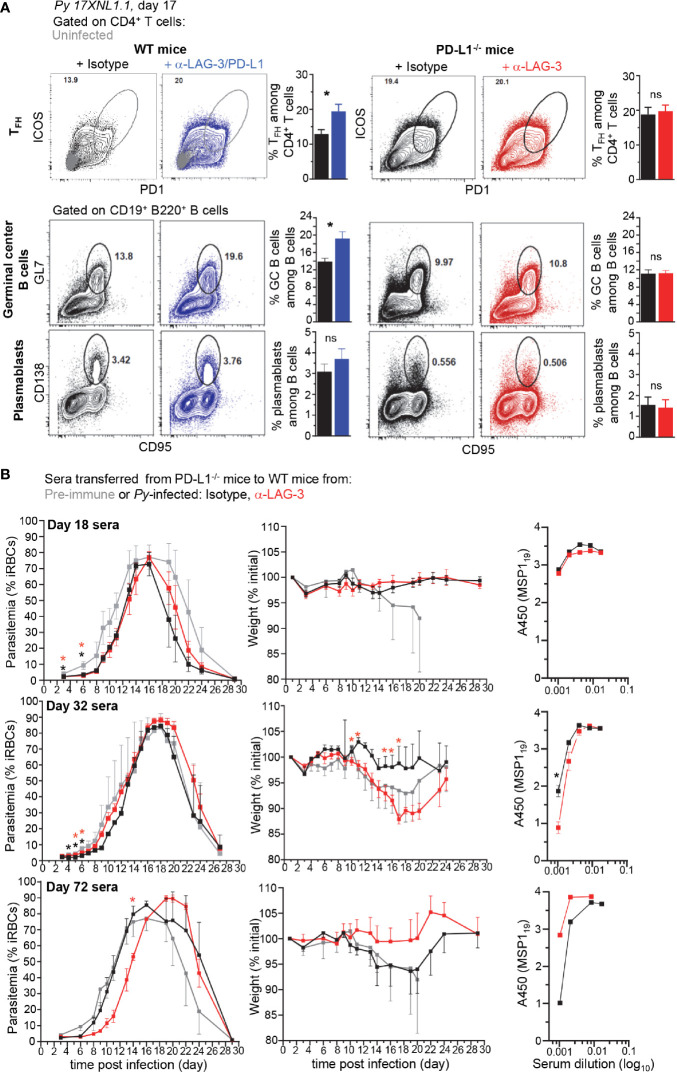
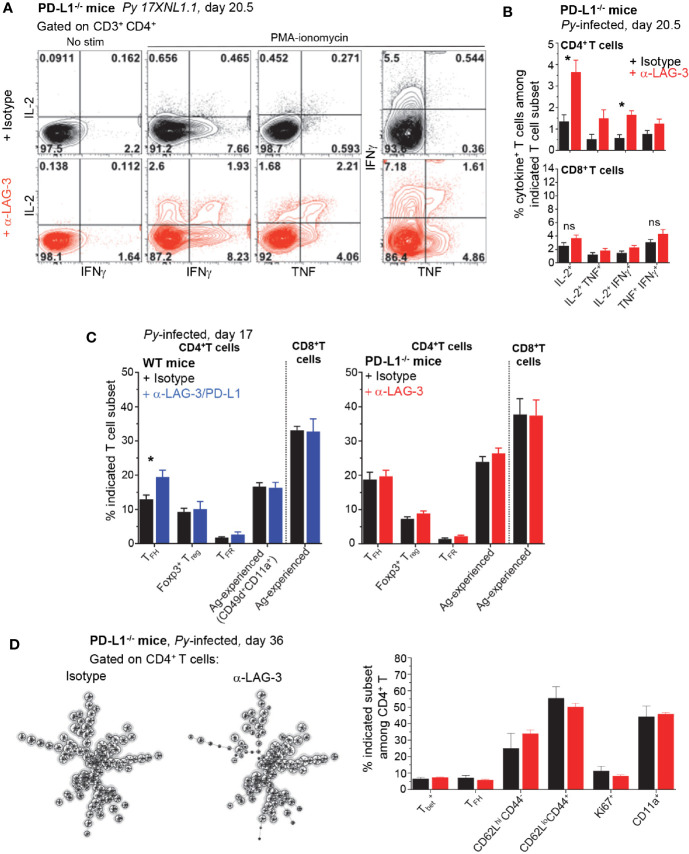
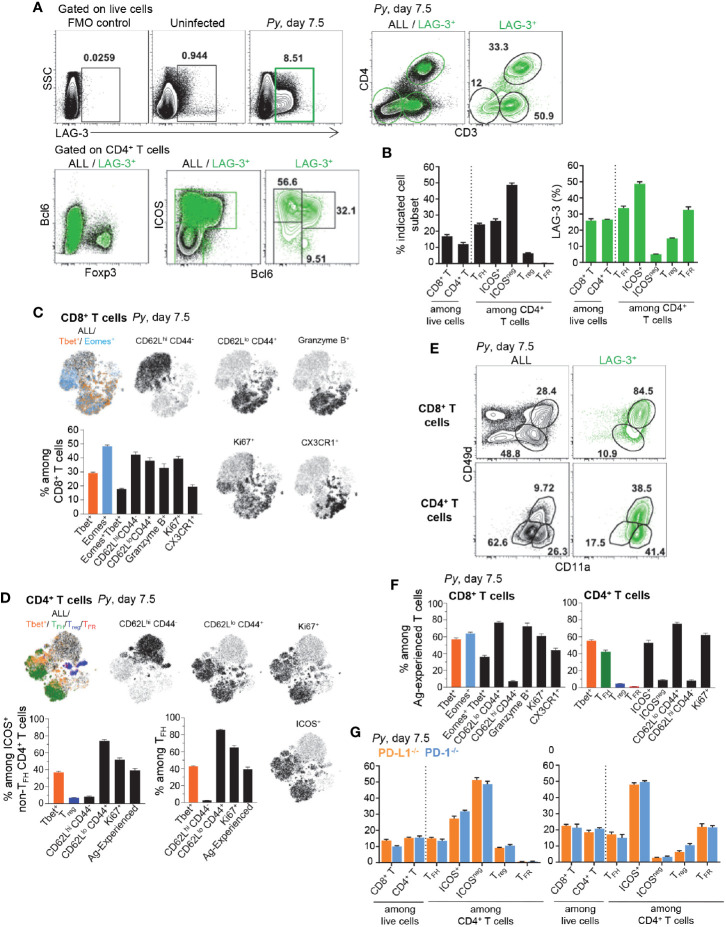
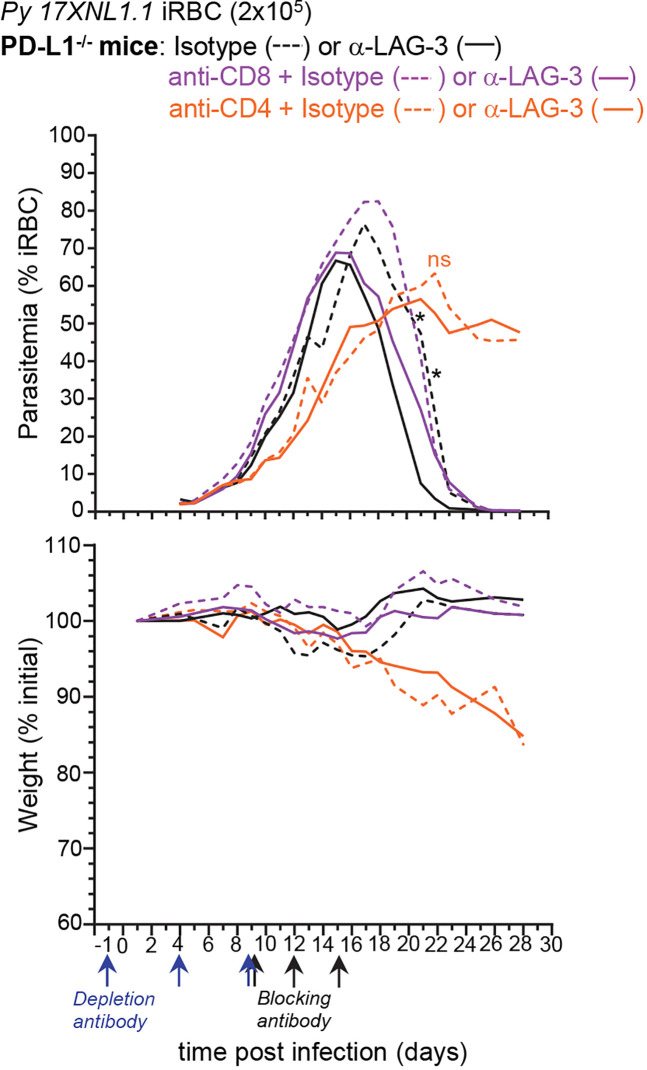
T cells expressing high levels of inhibitory receptors such as PD-1 and LAG-3 are a hallmark of chronic infections and cancer. Checkpoint blockade therapies targeting these receptors have been largely validated as promising strategies to restore exhausted T cell functions and clearance of chronic infections and tumors. The inability to develop long-term natural immunity in malaria-infected patients has been proposed to be at least partially accounted for by sustained expression of high levels of inhibitory receptors on T and B lymphocytes. While blockade or lack of PD-1/PD-L1 and/or LAG-3 was reported to promote better clearance of Plasmodium parasites in various mouse models, how exactly blockade of these pathways contributes to enhanced protection is not known. Herein, using the mouse model of non-lethal P. yoelii (Py) infection, we reveal that the kinetics of blood parasitemia as well as CD4+ T follicular helper (TFH) and germinal center (GC) B cell responses are indistinguishable between PD-1-/-, PD-L1-/- and WT mice. Yet, we also report that monoclonal antibody (mAb) blockade of LAG-3 in PD-L1-/- mice promotes accelerated control of blood parasite growth and clearance, consistent with prior therapeutic blockade experiments. However, neither CD4+ TFH and GC B cell responses, nor parasite-specific Ab serum titers and capacity to transfer protection differed. We also found that i) the majority of LAG-3+ cells are T cells, ii) selective depletion of CD4+ but not CD8+ T cells prevents anti-LAG-3-mediated protection, and iii) production of effector cytokines by CD4+ T cells is increased in anti-LAG-3-treated versus control mice. Thus, taken together, these results are consistent with a model in which blockade and/or deficiency of PD-L1 and LAG-3 on parasite-specific CD4+ T cells unleashes their ability to effectively clear blood parasites, independently from humoral responses.

Keywords: LAG-3+ CD4+ and CD8+ T cells; PD-1/PD-L1/LAG-3; PD-L1 and PD-1 knockout mice; Plasmodium yoelii; checkpoint therapeutic blockade; humoral immunity; inhibitory receptors; malaria.


Conflict of interest statement

The authors declare that the research was conducted in the absence of any commercial or financial relationships that could be construed as a potential conflict of interest.

Figures

Figure 1
Figure 1
Lymphocyte Activation Gene 3 (LAG-3) and PD-L1 blockade enhances blood parasite clearance, yet PD-1-/- and PD-L1-/- mice clear parasite like WT mice. (A) Littermates of indicated genotypes were inoculated with 2x10⁵ Py 17XNL1.1 iRBC i.v. Blood parasitemia was measured starting 4 days post infection and every other day until day 24–26 using YOYO-1 staining of RBC and FACS. PD1+/+ (n=5), PD1+/- (n=5), PD1-/- (n=5), PD-L1+/+ (n=3), PD-L1+/- (n=5), PD-L1-/- (n=4) (B) WT or PD-L1-/- mice were inoculated with 2x10⁵ Py iRBC i.v., and 9, 12, 15, and 18 days post infection, indicated mice received 200 µg of either anti-LAG-3 (WT n=13, PD-L1-/- n=12), anti-LAG-3/PD-L1(WT n= 12), anti-LAG-3/PD-1 (PD-L1-/- n=10) or polyclonal rat IgG Ab (isotype, WT n=12, PD-L1-/- n=12) i.v. Results show the kinetics of blood parasitemia over time determined by YOYO-1 staining of RBC collected at indicated time points. Graphs average the pool of two to three independent experiments (n=10–13) shown with SEM. P-values are indicated when applicable (*p < 0.05, **p < 0.01, ***p < 0.001) for each treatment compared to isotype (asterisk color indicate respective treatment group) or to anti-LAG-3 treatment per time point (middle blue asterisk or “ns” on graphs for anti-LAG-3/PD-L1 compared to anti-LAG3) by student’s t-test.
Figure 2
Figure 2
B and CD4+ T cell responses are comparable in Plasmodium yoelii-infected PD1-/-, PD-L1-/-, and heterozygous counterparts littermates. Littermates of indicated genotypes were inoculated with 2x10⁵ Py 17XNL1.1 (iRBC) i.v. (A) Spleens from Py-infected mice were harvested 7.5 and 13.5 days post infection and stained for CD19, B220, GL7, CD138, CD95 to monitor B cell responses and (B) spleen cells were stained for CD4, CD3, Foxp3, Bcl6, ICOS to monitor CD4+ TFH and TFR cellular responses by flow cytometry. (C) Spleen cells from either uninfected, day 7.5 or 13.5 Py-infected (2x10⁵ iRBC, i.v.) PD-1-/- (KO), PD-1+/- (hets), PD-L1-/- (KO), PD-L1+/- (hets) mice were incubated with PMA/ionomycin for 4 h and then stained for cell-surface CD3, CD4 and CD8 and intracellular cytokines IL-2, IFNγ, and TNF. Frequencies of cytokine-producing cells among indicated T cell subset are shown. In all experiments, representative FACS dot plots of two independent replicate experiments are presented (n=3–12). Graphs show average results from experiments with SEM. Student t-test was conducted between groups and p-values are indicated when applicable.
Figure 3
Figure 3
Lymphocyte Activation Gene 3 (LAG-3)/PD-L1 therapeutic blockade enhances TFH and germinal center (GC) responses while LAG-3 blockade in PD-L1-/- mice does not. (A) Wild-type (WT) B6 or PD-L1-/- mice were inoculated with 2x10⁵ Py 17XNL1.1 iRBC i.v. and 9, 12, 15, and 18 days post infection, indicated mice either received 200 µg of either anti-LAG-3/PD-L1, anti-LAG-3 or isotype Ab i.v. Spleens were harvested 17 days post infection and stained for CD4, CD3, ICOS, PD-1 to monitor CD4+ TFH cell response (ICOS+PD-1hi corresponds to ICOS+Bcl6hi cells) (top panel) and for CD19, B220, GL7, CD138, CD95 to monitor B cell responses (lower panels). Representative FACS dot plots of one to two independent replicate experiments are presented (n=4–10), with an overlay of representative uninfected mouse in the WT top panel. Graphs average each experiment shown with SEM. Student t-test was conducted between groups and p-values are indicated when applicable (*p < 0.05). (B) 150 µl of sera harvested from mice 18, 32, or 72 days post Py-infection was transferred to naïve WT mice (3-5 mice/group) that were subsequently infected with 2x10⁵ Py 17XNL1.1 iRBC i.v. Blood parasitemia and weight was monitored over 28 days. Titers of Py MSP119-specific IgG antibodies in indicated sera was measured by ELISA and reported as background subtracted A450 values. p-values are indicated when possible compared to pre-immune treatment or to isotype treatment by student t-test. Asterisk color indicate respective treatment group (*p < 0.05).
Figure 4
Figure 4
Lymphocyte Activation Gene 3 (LAG-3) blockade in PD-L1-/- mice partially restores CD4+ T cell dysfunction. Spleen cells from day 20.5 Py-infected PD-L1-/- or WT mice, treated with either anti-LAG-3/PD-L1, anti-LAG-3 or isotype Ab i.v. (as indicated, on days 9, 12, 15) were stained for cell-surface CD3, CD4 and CD8, Foxp3, Bcl6, ICOS and intracellular cytokines IL-2, IFNγ, and TNF after incubation with PMA/ionomycin for 4 h (T cell mix). (A) Representative FACS dot plots of two independent experiments are shown with the frequencies of cytokine-producing cells among CD4+ T cells (n=3–5). (B) Graphs of the average frequencies of cytokine-producing cells among CD4+ T cells (shown in (A)) and CD8+ T cells with SEM. P-values are indicated when applicable. (C) Distribution of known splenic T cell subsets as indicated on day 17 post infection, TFH data are from the same experiment shown in Figure 7. Graphs average one to two independent experiments (n=4-5) shown with SEM. (D) Spleen cells from day 36 PD-L1-/- Py-infected mice treated with either anti-LAG-3 or isotype Ab i.v. (on days 9, 12, 15) were stained for lineage markers (CD8, CD4, CD3, Bcl6, Tbet) and functional markers (CD62L, CD44, CD11a) with a 24 color panel depicted in S3A Fig. FlowSOM analysis (left) on pooled CD4+ T cells (n=5) and summary bar graphs from each treatment group are shown (right). Distribution of known splenic T cell subsets as indicated on day 36 post infection. Student t-test was conducted between groups and p-values are indicated when applicable (*p < 0.05).
Figure 5
Figure 5
Lymphocyte Activation Gene 3 (LAG-3) is expressed on activated CD4+ and CD8+ T cells during Py infection. Spleen cells from day 7.5 Py-infected mice were stained for lineage markers (CD8, CD4, CD3, Foxp3, Bcl6) and activation/inhibitory markers (LAG-3, CD11a, CD49d), or with a 26 color panel in S3A Figure (C, D, F). (A, B) FACS dot plots of the phenotype and (B) proportion of LAG-3-expressing cells among the indicated T cell subsets in WT mice. (C, D) t-SNE overlay representation of indicated CD8+ (C) and CD4+ (D) T cell subsets from a pool of five infected WT mice with bar graphs summarizing the proportions of indicated subsets with SEM. (E) Proportion of Ag-experienced (CD11a+CD49d+) CD8+ and CD4+ T cells on all or LAG-3+ cells. (F) Proportions of indicated subsets among Ag-experienced CD8+ and CD4+ T cells from the pool of five infected WT mice with SEM. (G) proportion of LAG-3-expressing cells among the indicated T cell subsets in PD-L1-/- or PD-1-/- mice. Overall, representative FACS dot plots of two independent replicate experiments are presented for one of three to five mice. Graphs show average results from experiments with SEM. P-values are indicated when applicable.
Figure 6
Figure 6
Lymphocyte Activation Gene 3 (LAG-3)-mediated enhancement of anti-parasite immunity is not dependent on CD8+ T cells. PD-L1-/- mice were injected i.p. with PBS or 150µg of either anti-CD4 or anti-CD8β depleting mAbs as depicted and inoculated with 2x10⁵ Py 17XNL1.1 iRBC i.v. Mice also received either 300 µg anti-LAG-3 or isotype Ab i.v. on day 9, 12, and 15 post Py infection. Results show blood parasitemia measured by YOYO-1 staining of RBC, and change in initial weight (lower panel) over time starting on day 4 post Py infection. Anti-CD8β + isotype (n=3), anti-CD4 + isotype (n=7), Anti-CD8β + anti-LAG3 (n=5), anti-CD4 + anti-LAG3 (n=8), isotype (n=4), anti-LAG3 (n=5). Graphs are representative of two independent experiments (n=3–4) shown with SEM. Student t-test was conducted between each treatment compared to isotype (asterisk color indicate respective group), p-values are indicated when applicable (*p < 0.05).

References

    1. Page DB, Postow MA, Callahan MK, Allison JP, Wolchok JD. Immune modulation in cancer with antibodies. Annu Rev Med (2014) 65:185–202. 10.1146/annurev-med-092012-112807 - DOI - PubMed
    1. Keir ME, Butte MJ, Freeman GJ, Sharpe AH. PD-1 and its ligands in tolerance and immunity. Annu Rev Immunol (2008) 26:677–704. 10.1146/annurev.immunol.26.021607.090331 - DOI - PMC - PubMed
    1. Sierro S, Romero P, Speiser DE. The CD4-like molecule LAG-3, biology and therapeutic applications. Expert Opin Ther Targets (2011) 15:91–101. 10.1517/14712598.2011.540563 - DOI - PubMed
    1. Wang J, Sanmamed MF, Datar I, Su TT, Ji L, Sun J, et al. Fibrinogen-like Protein 1 Is a Major Immune Inhibitory Ligand of LAG-3. Cell (2019) 176:334–347 e12. 10.1016/j.cell.2018.11.010 - DOI - PMC - PubMed
    1. Wherry EJ, Ha SJ, Kaech SM, Haining WN, Sarkar S, Kalia V, et al. Molecular signature of CD8+ T cell exhaustion during chronic viral infection. Immunity (2007) 27:670–84. 10.1016/j.immuni.2007.09.006 - DOI - PubMed

Publication types

MeSH terms

LinkOut - more resources