

Immunosenescence Study of T Cells: A Systematic Review
- PMID: 33519813
- PMCID: PMC7843425
- DOI: 10.3389/fimmu.2020.604591
Immunosenescence Study of T Cells: A Systematic Review
Abstract
Background: Aging is accompanied by alterations in immune response which leads to increased susceptibility to infectious diseases, cancer, autoimmunity, and inflammatory disorders. This decline in immune function is termed as immunosenescence; however, the mechanisms are not fully elucidated. Experimental approaches of adaptive immunity, particularly for T cells, have been the main focus of immunosenescence research. This systematic review evaluates and discusses T cell markers implicated in immunosenescence.
Objective: To determine the best flow cytometry markers of circulating T cells associated with immunosenescence.
Methods: We systematically queried PubMed, MEDLINE, EBSCO, and BVS databases for original articles focused on two age groups of healthy humans: 18-44 (young adults) and >60 (older adults) years. In accordance with the Cochrane methodology, we synthesized data through qualitative descriptions and quantitative random effects meta-analysis due to extensive heterogeneity.
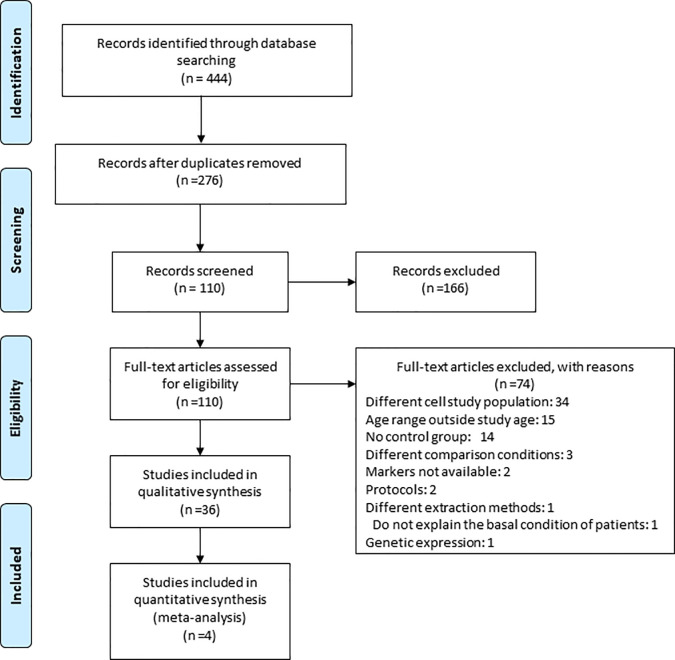
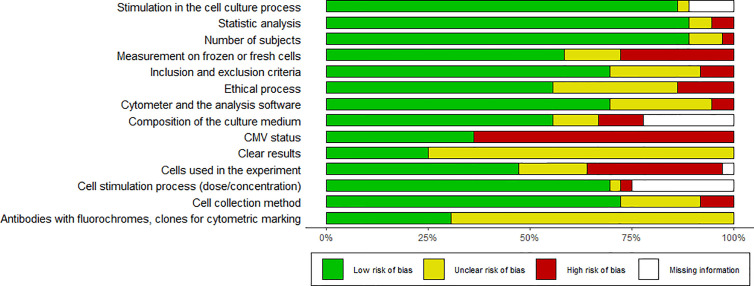
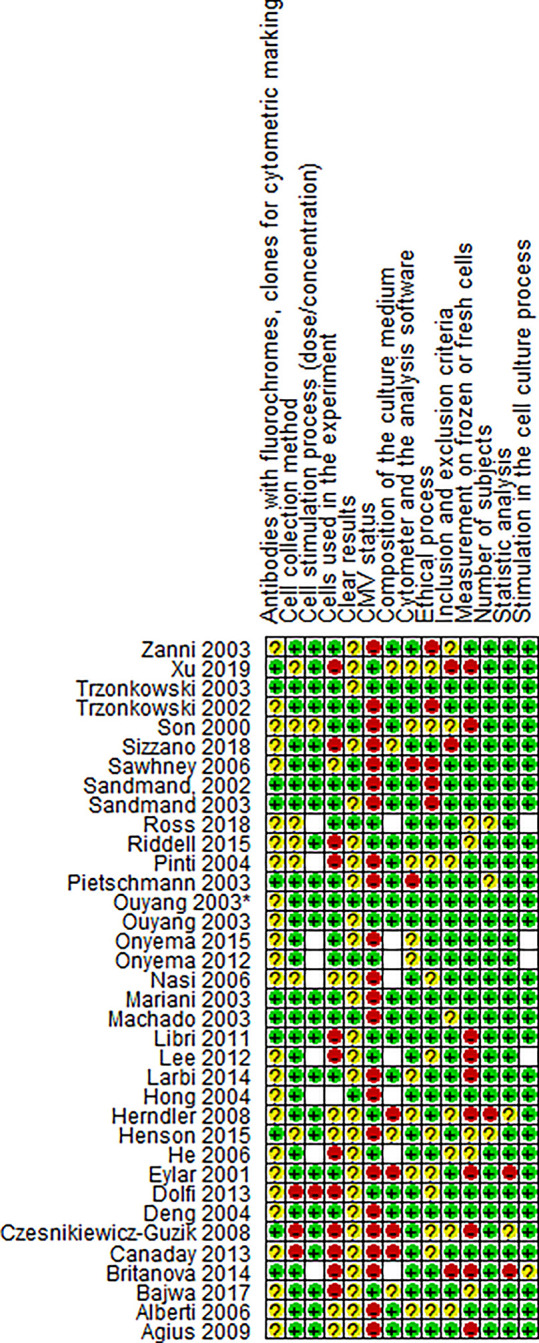
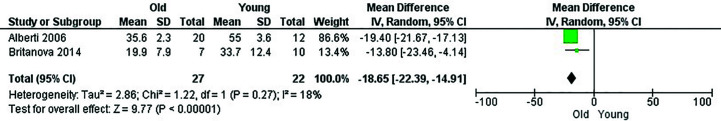
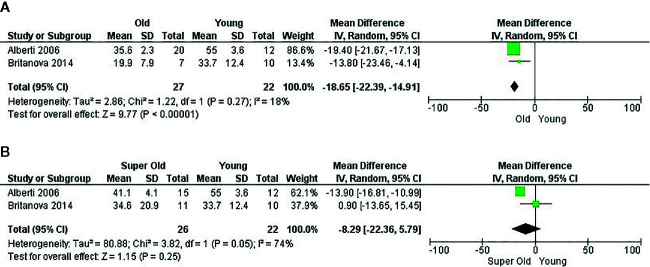
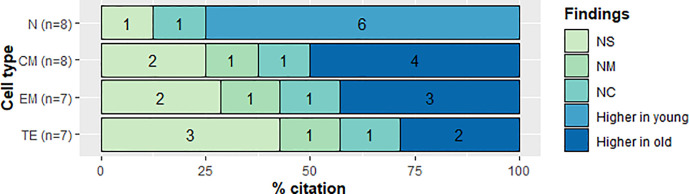
Results: A total of 36 studies conducted in the last 20 years were included for the qualitative analysis and four out of these studies were used to perform the meta-analysis. A significant decrease in naïve T cell subset was observed in older adults compared to young adults. Primary markers used to identify senescent cells were loss of CD28 and increased expression of CD57 and KLRG1 in terminally-differentiated memory T cell subset in older adults. Moreover, we observed an increase in proinflammatory cytokines and decrease in telomere length in old adult T cells. It was not possible to perform quantitative synthesis on cell markers, cytokines, and telomere length because of the significant variations between the groups, which is attributed to differences in protocols and unreported measurements, thus generating a high risk of bias.
Conclusions: Heterogeneity among studies in terms of data report, measurement techniques and high risk of bias were major impediments for performing a robust statistical analysis that could aid the identification of eligible flow cytometry markers of immunosenescence phenotype in T cells.
Keywords: T cells; cytokines; flow cytometry; immunosenescence; immunosenescence markers.
Copyright © 2021 Rodriguez, Lalinde Ruiz, Llano León, Martínez Enríquez, Montilla Velásquez, Ortiz Aguirre, Rodríguez Bohórquez, Velandia Vargas, Hernández and Parra López.
Conflict of interest statement
The authors declare that the research was conducted in the absence of any commercial or financial relationships that could be construed as a potential conflict of interest.
Figures
References
Publication types
MeSH terms
Substances
LinkOut - more resources
Full Text Sources
Other Literature Sources