. 2020 Dec 3:11:592540.
doi: 10.3389/fpls.2020.592540. eCollection 2020.

Endogenous Auxin Content Contributes to Larger Size of Apple Fruit

Affiliations

Endogenous Auxin Content Contributes to Larger Size of Apple Fruit

Haidong Bu et al. Front Plant Sci. .

Abstract

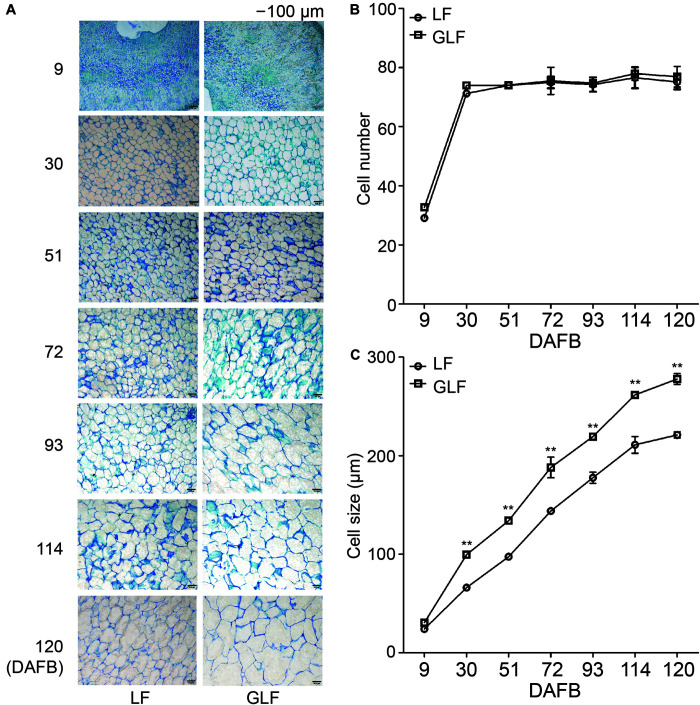
Fruit size is an important economic trait that is controlled by multiple genes. However, the regulatory mechanism for fruit size remains poorly understood. A bud sport variety of "Longfeng" (LF) apple (Malus domestica) was identified and named "Grand Longfeng" (GLF). The fruit size of GLF is larger than that of LF, and both varieties are diploid. We found that the cell size in GLF fruit was larger than that of LF. Then, we compared the fruit transcriptomes of the two varieties using RNA-Seq technology. A total of 1166 differentially expressed genes (DEGs) were detected between GLF and LF fruits. The KEGG analysis revealed that the phytohormone pathway was the most enriched, in which most of the DEGs were related to auxin signaling. Moreover, the endogenous auxin levels of GLF fruit were higher than those of LF. The expressions of auxin synthetic genes, including MdTAR1 and MdYUCCA6, were higher in GLF fruit than LF. Collectively, our findings suggest that auxin plays an important role in fruit size development.

Keywords: MdTAR1; MdYUCCA6; apple; auxin; cell size; fruit size.


Conflict of interest statement

The authors declare that the research was conducted in the absence of any commercial or financial relationships that could be construed as a potential conflict of interest.

Figures

FIGURE 1
FIGURE 1
Comparison of LF and GLF fruit growth. LF and GLF fruits were harvested every 21 d from 9 to 120 DAFB (days after full bloom; A). Fruit transverse diameter (B), longitudinal diameter (C), and weight (D) were measured and compared. **Significant differences (p < 0.01, Student’s t-test). Error bars indicate the standard deviation (SD) of 10 fruits. Bar, 10 mm.
FIGURE 2
FIGURE 2
Cell numbers and sizes of LF and GLF fruits. (A) Cells of LF and GLF fruits from 9 to 120 DAFB (days after full bloom). Bar, 100 μm. (B) Cell numbers of LF and GLF fruits were determined as the ratio between the fruit cortex and single cell size. (C) Cell sizes of LF and GLF fruit cortexes were determined as the average diameter of six cells during fruit development. **Significant differences (p < 0.01, Student’s t-test). Error bars indicate the standard deviation (SD) of three biological replicates.
FIGURE 3
FIGURE 3
Expression of DEGs in LF and GLF fruits. qRT-PCR was used to measure the expression of DEGs related to auxin signaling in LF and GLF fruits at 51, 72, and 93 DAFB (days after full bloom). **Significant differences (p < 0.01, Student’s t-test). Error bars indicate the standard deviation (SD) of three biological replicates.
FIGURE 4
FIGURE 4
Relative expression of MdTAR1 and MdYUCCA6 in LF and GLF fruits. GLF and LF fruit cortexes were collected from 9 to 120 DAFB (days after full bloom). qRT-PCR was used to measure the relative expression of MdTAR1 (A) and MdYUCCA6 (B). **Significant differences (p < 0.01, Student’s t-test). Error bars indicate the standard deviation (SD) of three biological replicates.
FIGURE 5
FIGURE 5
Auxin contents of LF and GLF fruits. The IAA content was measured using fruit cortex of LF and GLF. **Significant differences (p < 0.01, Student’s t-test). Error bars indicate the standard deviation (SD) of three biological replicates.
FIGURE 6
FIGURE 6
The influence of auxin and TIBA on fruit and cell sizes. On-tree LF and GLF fruits were treated with NAA and TIBA at 30 DAFB (days after full bloom), respectively, and harvested at 120 DAFB (A). Fruit transverse diameter, longitudinal diameter, and weight were measured on harvest fruit. Bar, 10 mm (B). Cell sizes were calculated as the average of six typical cell lengths, which were measured by a scale tool under a microscope at 120 DAFB. Bar, 100 μm (C). **Significant differences (p < 0.01, Student’s t-test). Error bars indicate the standard deviation (SD) of three biological replicates.

References

    1. Anders S., Huber W. (2010). Differential expression analysis for sequence count data. Genome Biol. 11:R106. 10.1186/gb-2010-11-10-r106 - DOI - PMC - PubMed
    1. Bottcher C., Burbidge C. A., Boss P. K., Davies C. (2013). Interactions between ethylene and auxin are crucial to the control of grape (Vitis vinifera L.) berry ripening. BMC Plant Biol. 13 222–222. 10.1186/1471-2229-13-222 - DOI - PMC - PubMed
    1. Cheniclet C., Rong W. Y., Causse M., Frangne N., Bolling L., Carde J., et al. (2005). Cell Expansion and Endoreduplication Show a Large Genetic Variability in Pericarp and Contribute Strongly to Tomato Fruit Growth. Plant Physiol. 139 1984–1994. 10.1104/pp.105.068767 - DOI - PMC - PubMed
    1. Cruz-Castillo J., Woolley D., Lawes G. (2002). Kiwifruit size and CPPU response are influenced by the time of anthesis. Sci. Horticult. 95 23–30. 10.1016/S0304-4238(01)00384-3 - DOI
    1. Daccord N., Celton J.-M., Linsmith G., Becker C., Choisne N., Schijlen E., et al. (2017). High-quality de novo assembly of the apple genome and methylome dynamics of early fruit development. Nat. Genet. 49:1099. 10.1038/ng.3886 - DOI - PubMed

LinkOut - more resources