. 2021 Jan 14:11:599462.
doi: 10.3389/fpls.2020.599462. eCollection 2020.

Characterization of QTL and Environmental Interactions Controlling Flowering Time in Andean Common Bean (Phaseolus vulgaris L.)

Affiliations

Characterization of QTL and Environmental Interactions Controlling Flowering Time in Andean Common Bean (Phaseolus vulgaris L.)

Ana M González et al. Front Plant Sci. .

Abstract

Genetic variation for response of flowering time to photoperiod plays an important role in adaptation to environments with different photoperiods, and as consequence is an important contributor to plant productivity and yield. To elucidate the genetic control of flowering time [days to flowering (DTF); growing degree days (GDD)] in common bean, a facultative short-day plant, a quantitative trait loci (QTL) analysis was performed in a recombinant inbred mapping population derived from a cultivated accession and a photoperiod sensitive landrace, grown in different long-day (LD) and short-day (SD) environments by using a multiple-environment QTL model approach. A total of 37 QTL across 17 chromosome regions and 36 QTL-by-QTL interactions were identified for six traits associated with time to flowering and response to photoperiod. The DTF QTL accounted for 28 and 11% on average of the phenotypic variation in the population across LD and SD environments, respectively. Of these, a genomic region on chromosome 4 harboring the major DTF QTL was associated with both flowering time in LD and photoperiod response traits, controlling more than 60% of phenotypic variance, whereas a major QTL on chromosome 9 explained up to 32% of flowering time phenotypic variation in SD. Different epistatic interactions were found in LD and SD environments, and the presence of significant QTL × environment (QE) and epistasis × environment interactions implies that flowering time control may rely on different genes and genetic pathways under inductive and non-inductive conditions. Here, we report the identification of a novel major locus controlling photoperiod sensitivity on chromosome 4, which might interact with other loci for controlling common bean flowering time and photoperiod response. Our results have also demonstrated the importance of these interactions for flowering time control in common bean, and point to the likely complexity of flowering time pathways. This knowledge will help to identify and develop opportunities for adaptation and breeding of this legume crop.

Keywords: QTL; common bean; environment interaction; epistasis; flowering time; photoperiod.


Conflict of interest statement

The authors declare that the research was conducted in the absence of any commercial or financial relationships that could be construed as a potential conflict of interest.

Figures
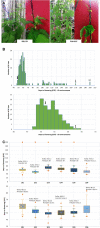
FIGURE 1
FIGURE 1
Effect of short- and long-day length (SD and LD) on flowering time in common bean. (A) Images illustrating plants of cultivar Bolita and landrace PHA1037 grown under LD conditions at 6 weeks after planting. (B) Distribution of days to flowering (DTF) and number of individuals of the RI population under all LD and SD trials; where black and white arrows correspond to Bolita and PHA1037 parents, respectively. (C) Comparison of days to flowering (DTF) of RI population in the LD and SD different trials across 6 years. Y- and abscissa axes represent DTF and LD or SD trials, respectively. Means and standard errors for Bolita and PHA1037 accessions for each trial are shown, NF = non-flowering (Supplementary Table 2). Specific characteristics of the twelve trials are shown in Table 1.
FIGURE 2
FIGURE 2
Correlation heat map of time to flowering expressed as growing degree days (GDD) between LD and SD environments.
FIGURE 3
FIGURE 3
Effect on photoperiod response in common bean. (A) Comparison of the Relative Response to Photoperiod (RPP) for the RI population across the six trial years. Y-axis represents RRP and X-axis different years. RRP was measured as a relative change in rate of flowering under LD and SD environments, where values of 0 indicate a day-neutral response and values of 1 indicate maximum response to photoperiod. (B) Distribution of RRP and percentage of individuals of the RI population across the trial years (2011 and 2013 years are not included due to the low variation observed). Three groups of responses: day-neutral group (RRP = 0–0.2), intermediate group (RRP = 0.3–0.7), sensitivity group (RRP ≥ 0.7). (C) Distribution of the photoperiod response on a scale of 1–8 (CLASS) and percentage of individuals of the RI population for the type II and type IV growth habits across 2009 to 2016 trail years. Grouping response classes 1 and 2 were classified as day-neutral, 3 and 4 as intermediate, and 5–8 as sensitive. (D) Variation of internode length (IL) and number of pods per plant (PP) for type II and type IV RI lines across LD and SD environments. Bolita and PHA1037 parents show an indeterminate type II and IV growth habit, respectively.
FIGURE 4
FIGURE 4
Regression of observed photoperiod response classes (CLASS, scale 1–8) and flowering time expressed as growing degree days (GDD) under LD.
FIGURE 5
FIGURE 5
Genetic linkage map showing main QTL and epistatic QTL explaining >10% of the phenotypic variation at least in one environment. Names of markers are shown on the left. QTL are depicted as vertical bars to the right of the chromosomes.
FIGURE 6
FIGURE 6
PCA biplot for the relatedness of variables and environments and showing PC values for QTL analysis in LD and SD environments. PC1 and PC2 values for each line are plotted as points and PC1 and PC2 loadings of each variable are indicated by lines. The percent of total variation explained by each PC is labeled on the axes. PC1: first principal component, PC2: second principal component.

References

    1. Bhakta M. S., Gezan S. A., Clavijo Michelangeli J. A., Carvalho M., Zhang L., Jones J. W., et al. (2017). A predictive model for time-to-flowering in the common bean based on QTL and environmental variables. G3 Genes Genom. Genet. 7 3901–3912. 10.1534/g3.117.300229 - DOI - PMC - PubMed
    1. Blair M. W., Iriarte G., Beebe S. (2006). QTL analysis of yield traits in an advanced backcross population derived from a cultivated andean × wild common bean (Phaseolus vulgaris L.) cross. Theor. Appl. Genet. 112 1149–1163. 10.1007/s00122-006-0217-2 - DOI - PubMed
    1. Buckler E. S., Holland J. B., Bradbury P. J., Acharya C. B., Brown P. J., Browne C., et al. (2009). The genetic architecture of maize flowering time. Science 325 714–718. 10.1126/science.1174276 - DOI - PubMed
    1. Cao D., Li Y., Lu S., Wang J., Nan H., Li X., et al. (2015). GmCOL1a and GmCOL1b function as flowering repressors in soybean under long-day conditions. Plant Cell Physiol. 56 2409–2422. 10.1093/pcp/pcv152 - DOI - PubMed
    1. Cao D., Takeshima R., Zhao C., Liu B., Jun A., Kong F. (2017). Molecular mechanisms of flowering under long days and stem growth habit in soybean. J. Exp. Bot. 68 1873–1884. 10.1093/jxb/erw394 - DOI - PubMed