. 2021 Jan 14:11:610605.
doi: 10.3389/fgene.2020.610605. eCollection 2020.

Integrative Analyses of mRNA Expression Profile Reveal SOCS2 and CISH Play Important Roles in GHR Mutation-Induced Excessive Abdominal Fat Deposition in the Sex-Linked Dwarf Chicken

Affiliations

Integrative Analyses of mRNA Expression Profile Reveal SOCS2 and CISH Play Important Roles in GHR Mutation-Induced Excessive Abdominal Fat Deposition in the Sex-Linked Dwarf Chicken

Genghua Chen et al. Front Genet. .

Abstract

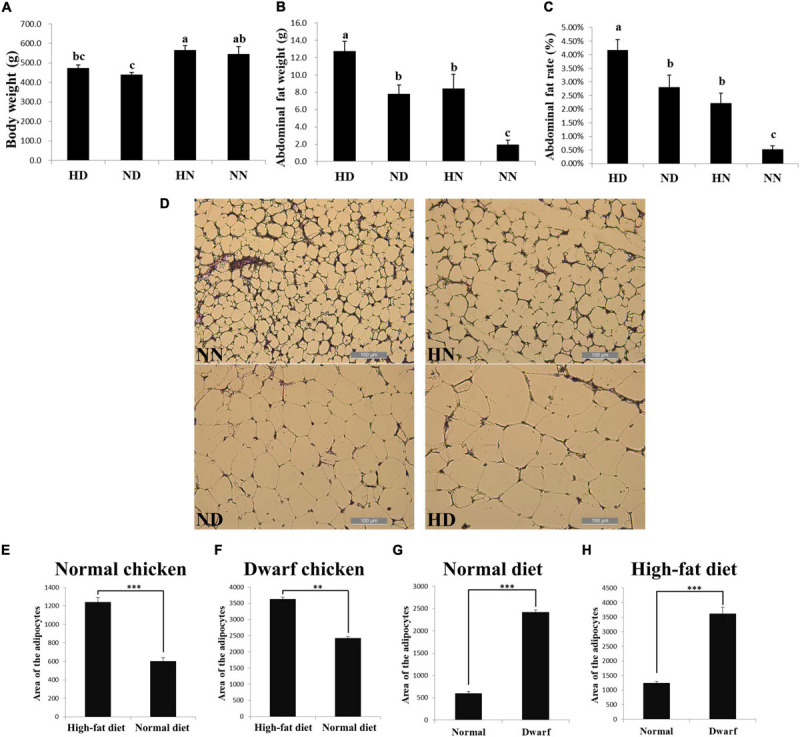
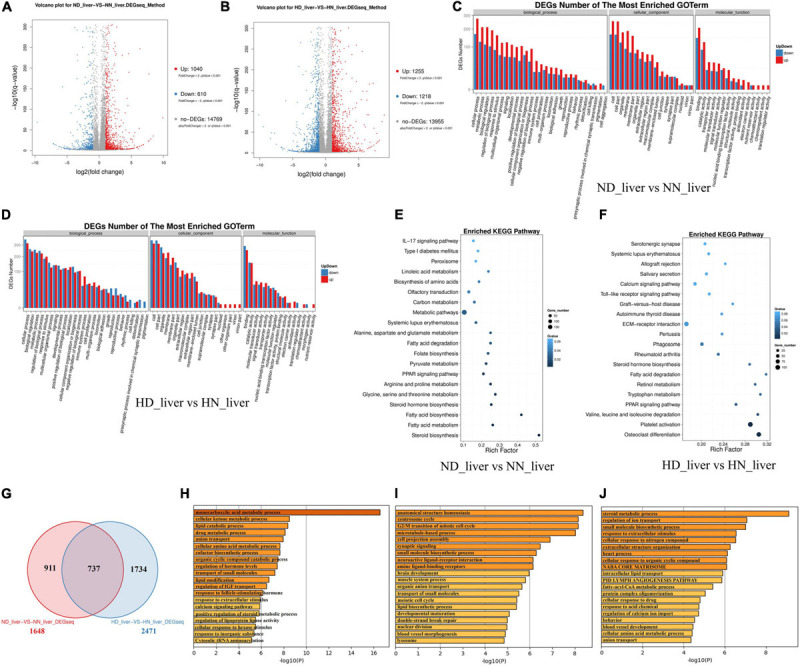
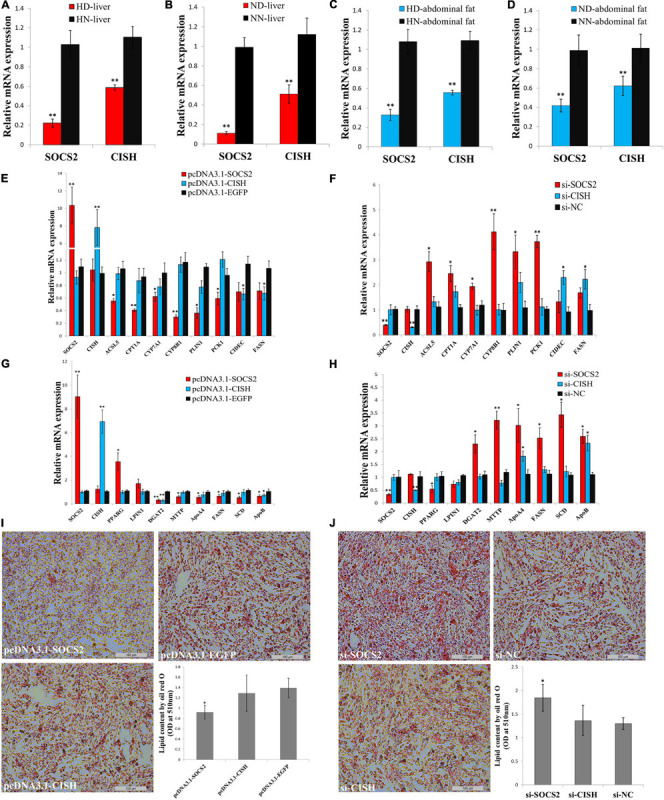
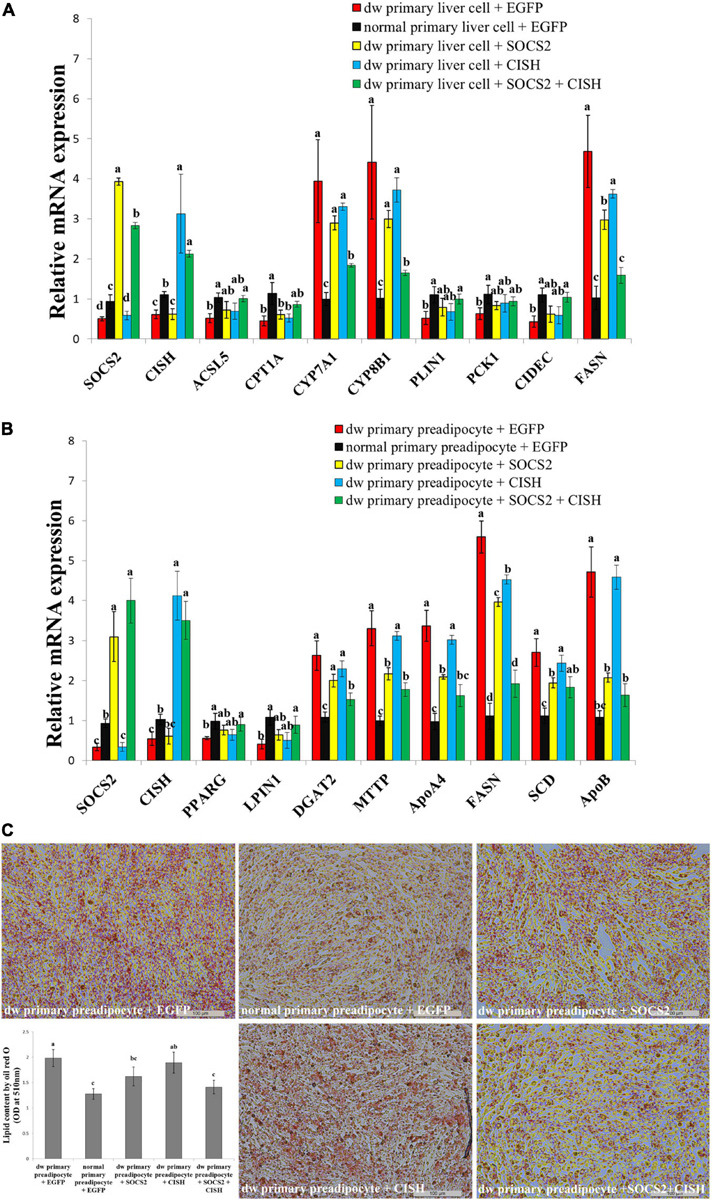
Sex-linked dwarf (SLD) chicken, which is caused by a recessive mutation of the growth hormone receptor (GHR), has been widely used in the Chinese broiler industry. However, it has been found that the SLD chicken has more abdominal fat deposition than normal chicken. Excessive fat deposition not only reduced the carcass quality of the broilers but also reduced the immunity of broilers to diseases. To find out the key genes and the precise regulatory pathways that were involved in the GHR mutation-induced excessive fat deposition, we used high-fat diet (HFD) and normal diet to feed the SLD chicken and normal chicken and analyzed the differentially expressed genes (DEGs) among the four groups. Results showed that the SLD chicken had more abdominal fat deposition and larger adipocytes size than normal chicken and HFD can promote abdominal fat deposition and induce adipocyte hypertrophy. RNA sequencing results of the livers and abdominal fats from the above chickens revealed that many DEGs between the SLD and normal chickens were enriched in fat metabolic pathways, such as peroxisome proliferator-activated receptor (PPAR) signaling, extracellular matrix (ECM)-receptor pathway, and fatty acid metabolism. Importantly, by constructing and analyzing the GHR-downstream regulatory network, we found that suppressor of cytokine signaling 2 (SOCS2) and cytokine-inducible SH2-containing protein (CISH) may involve in the GHR mutation-induced abdominal fat deposition in chicken. The ectopic expression of SOCS2 and CISH in liver-related cell line leghorn strain M chicken hepatoma (LMH) cell and immortalized chicken preadipocytes (ICP) revealed that these two genes can regulate fatty acid metabolism, adipocyte differentiation, and lipid droplet accumulation. Notably, overexpression of SOCS2 and CISH can rescue the hyperactive lipid metabolism and excessive lipid droplet accumulation of primary liver cell and preadipocytes that were isolated from the SLD chicken. This study found some genes and pathways involved in abdominal fat deposition of the SLD chicken and reveals that SOCS2 and CISH are two key genes involved in the GHR mutation-induced excessive fat deposition of the SLD chicken.

Keywords: CISH; SOCS2; abdominal fat deposition; differentially expressed gene; sex-linked dwarf chicken.


Conflict of interest statement

The authors declare that the research was conducted in the absence of any commercial or financial relationships that could be construed as a potential conflict of interest.

Figures

FIGURE 1
FIGURE 1
The sex-linked dwarf (SLD) chickens have more abdominal fat deposition and larger adipocytes size than normal chickens. (A) Body weight of the SLD chicken fed with high-fat diet (HD) and normal diet (ND) and normal chicken fed with high-fat diet (HN) and normal diet (NN). (B) Abdominal fat weight of the HD, ND, HN, and NN chickens. (C) Abdominal fat rate of the HD, ND, HN, and NN chickens. (D) Micrograph of abdominal fat cross-section from the NN, HN, ND, and HD chickens. Bar: 200 μm. (E) Adipocytes area of normal chicken fed with high-fat diet and normal diet. (F) Adipocytes area of the SLD chicken fed with high-fat diet and normal diet. (G) Adipocytes area from normal chicken and the SLD chicken fed with normal diet. (H) Adipocytes area from normal chicken and the SLD chicken fed with high-fat diet. The data are mean ± SEM with at least three samples (n ≥ 3/treatment group). The different lowercase letters above columns indicate significant differences among HD, HN, ND, and NN chickens (P < 0.05) by Duncan’s multiple range test. Independent sample t-test was used to analyze the statistical differences between two groups. ∗∗P < 0.01; ∗∗∗P < 0.001.
FIGURE 2
FIGURE 2
Differentially expressed genes (DEGs) analysis in the liver between the sex-linked dwarf (SLD) chicken and normal chicken. (A) Scatter plot of DEGs between normal diet fed SLD chicken (ND) and normal diet fed normal chicken (NN) in the liver. (B) Scatter plot of DEGs between high-fat diet fed SLD chicken (HD) and high-fat diet fed normal chicken (HN) in the liver. (C) Gene Ontology enrichment of DEGs between ND and NN chickens in the liver. (D) Gene Ontology enrichment of DEGs between HD and HN chickens in the liver. (E) Enriched Kyoto Encyclopedia of Genes and Genomes pathway of DEGs between ND and NN chickens in the liver. (F) Enriched Kyoto Encyclopedia of Genes and Genomes pathway of DEGs between HD and HN chickens in the liver. (G) Venn diagram analysis of DEGs in the liver between the SLD chicken and normal chicken under different diet conditions. (H) Metascape functional enrichment analysis of common DEGs between ND-vs-NN and HD-vs-HN chickens in the liver. (I) Metascape functional enrichment analysis of DEGs specific differentially expressed in ND_liver-VS-NN_liver (911 genes). (J) Metascape functional enrichment analysis of DEGs specific differentially expressed in HD_liver-VS-HN_liver (1,734 genes).
FIGURE 3
FIGURE 3
Differentially expressed genes analyses in the abdominal fat between the sex-linked dwarf (SLD) chicken and normal chicken. (A) Scatter plot of differentially expressed genes (DEGs) between normal diet fed SLD chicken (ND) and normal diet fed normal chicken (NN) in the abdominal fat. (B) Scatter plot of DEGs between high-fat diet fed SLD chicken (HD) and high-fat diet fed normal chicken (HN) in the abdominal fat. (C) Gene Ontology enrichment of DEGs between ND and NN chickens in the abdominal fat. (D) Gene Ontology enrichment of DEGs between HD and HN chickens in the abdominal fat. (E) Enriched Kyoto Encyclopedia of Genes and Genomes pathway of DEGs between ND and NN chickens in the abdominal fat. (F) Enriched Kyoto Encyclopedia of Genes and Genomes pathway of DEGs between HD and HN chickens in the abdominal fat. (G) Venn diagram analysis of DEGs in the abdominal fat between the SLD chicken and normal chicken under different diet conditions. (H) Metascape functional enrichment analysis of common DEGs between ND-vs-NN and HD-vs-HN chickens in the abdominal fat. (I) Metascape functional enrichment analysis of DEGs specific differentially expressed in ND_fat-VS-NN_fat (1,037 genes). (J) Metascape functional enrichment analysis of DEGs specific differentially expressed in HD_fat-VS-HN_fat (763 genes).
FIGURE 4
FIGURE 4
Integrative analyses reveal differentially expressed genes involved in high-fat diet (HFD)-induced fat deposition. (A) Specific and common differentially expressed genes (DEGs) between the sex-linked dwarf (SLD) chicken and normal chicken under the HFD and the normal diet (HD-vs-ND compared with HN-vs-NN) in the liver. (B) Metascape functional enrichment analysis of the common DEGs between HD-vs-ND and HN-vs-NN. (C) Metascape functional enrichment analysis of DEGs specific differentially expressed in the HD-vs-ND group. (D) Metascape functional enrichment analysis of DEGs specific differentially expressed in HN-vs-NN group. (E) Specific and common DEGs between the SLD chicken and normal chicken (HN-vs-NN compared with HD-vs-ND) in the abdominal fat. (F) Metascape functional enrichment analysis of the common DEGs between HN-vs-NN and HD-vs-ND. (G) Metascape functional enrichment analysis of DEGs specific differentially expressed in HN-vs-NN. (H) Metascape functional enrichment analysis of DEGs specific differentially expressed in HD-vs-ND. (I) Venn diagram analysis of DEGs among HD-vs-ND, ND-vs-NN, HN-vs-NN, and HD-vs-HN in the liver. (J) Venn diagram analysis of DEGs among HD-vs-ND, ND-vs-NN, HN-vs-NN, and HD-vs-HN in the abdominal fat. (K) The expression of six genes selected from the 66 common DEGs was determined by RNA-sequence. (L) The expression of six genes selected from the 48 common DEGs was determined by RNA-sequence. (M) The expression of six genes selected from the 66 common DEGs was determined by qPCR. (N) The expression of six genes selected from the 48 common DEGs was determined by qPCR. The data are mean ± SEM with three samples (n = 3/treatment group).
FIGURE 5
FIGURE 5
GHR-mediated signaling pathways analyses reveal key pathways and genes relative to GHR mutation-induced fat deposition. (A) Differentially expressed genes (DEGs) of the liver between normal diet fed sex-linked dwarf (SLD) chicken (ND) and normal diet fed normal chicken (NN) enriched in GHR-mediated signaling pathways. (B) DEGs of the liver between high-fat diet fed SLD chicken (HD) and high-fat diet fed normal chicken (HN) enriched in GHR-mediated signaling pathways. (C) DEGs of the abdominal fat between normal diet fed SLD chicken (ND) and normal diet fed normal chicken (NN) enriched in GHR-mediated signaling pathways. (D) DEGs of the abdominal fat between high-fat diet fed SLD chicken (HD) and high-fat diet fed normal chicken (HN) enriched in GHR-mediated signaling pathways. The red fonts or boxes indicate that the genes or biology functions were inhibited. The green fonts or boxes indicate that the genes or biology functions were promoted.
FIGURE 6
FIGURE 6
SOCS2 inhibits lipid metabolism and decreases lipid droplet accumulation. (A) The mRNA expression of SOCS2 and CISH in the liver of high-fat diet fed sex-linked dwarf chicken (HD) compared with high-fat diet fed normal chicken (HN). (B) The mRNA expression of SOCS2 and CISH in the liver of normal diet fed sex-linked dwarf chicken (ND) compared with normal diet fed normal chicken (NN). (C) The mRNA expression of SOCS2 and CISH in the abdominal fat of HD chicken compared with HN chicken. (D) The mRNA expression of SOCS2 and CISH in the abdominal fat of ND chicken compared with NN chicken. (E) The expression of lipid metabolism-related differentially expressed genes (DEGs) after transfection of SOCS2 or CISH in LMH cell. (F) The expression of lipid metabolism-related DEGs after transfection of si-SOCS2 or si-CISH in LMH cell. (G) The expression of fat deposition-related DEGs after transfection of SOCS2 or CISH in ICP cell. (H) The expression of fat deposition-related DEGs after transfection of si-SOCS2 or si-CISH in ICP cell. (I) Representative images of Oil Red O staining (red) after overexpression of SOCS2 or CISH in ICP cells; scale bar: 100 μm. (J) Representative images of Oil Red O staining (red) after inhibition of SOCS2 or CISH in ICP cells; scale bar: 100 μm. The data are mean ± SEM with four samples (n = 4/treatment group). Independent sample t-test was used to analyze the statistical differences between groups. P < 0.05; ∗∗P < 0.01.
FIGURE 7
FIGURE 7
The co-overexpression of SOCS2 and CISH rescues GHR mutation-induced lipid metabolism disorder and lipid droplet accumulation. (A) The relative mRNA expression of lipid metabolism genes after transfection of SOCS2 and CISH overexpression vector in primary liver cells isolated from the sex-linked dwarf chicken and normal chicken. (B) The relative mRNA expression of fat deposition genes after transfection of SOCS2 and CISH overexpression vector in primary preadipocytes isolated from the sex-linked dwarf chicken and normal chicken. (C) Representative images of Oil Red O staining (red) after the transfection of SOCS2 and CISH in primary preadipocyte isolated from the sex-linked dwarf chicken and normal chicken; scale bar: 100 μm. The results are shown as the mean ± SEM of three independent experiments. Different letters a–d above the bars indicate significant differences (P < 0.05) by Duncan’s multiple range test.

Similar articles

Cited by

References

    1. ALJohani A. M., Syed D. N., Ntambi J. M. (2017). Insights into stearoyl-coa desaturase-1 regulation of systemic metabolism. Trends Endocrinol. Metab. 28 831–842. 10.1016/j.tem.2017.10.003 - DOI - PMC - PubMed
    1. Berg M. A., Argente J., Chernausek S., Gracia R., Guevara-Aguirre J., Hopp M., et al. (1993). Diverse growth hormone receptor gene mutations in laron syndrome. Am. J. Hum. Genet. 52 998–1005. - PMC - PubMed
    1. Berryman D. E., List E. O., Kohn D. T., Coschigano K. T., Seeley R. J., Kopchick J. J. (2006). Effect of growth hormone on susceptibility to diet-induced obesity. Endocrinology 147 2801–2808. 10.1210/en.2006-0086 - DOI - PubMed
    1. Berryman D. E., List E. O., Palmer A. J., Chung M. Y., Wright-Piekarski J., Lubbers E., et al. (2009). Two-year body composition analyses of long-lived ghr null mice. J. Gerontol. Ser. A Biol. Sci. Med. Sci. 65A 31–40. 10.1093/gerona/glp175 - DOI - PMC - PubMed
    1. Bhatt-Wessel B., Jordan T. W., Miller J. H., Peng L. (2018). Role of dgat enzymes in triacylglycerol metabolism. Arch. Biochem. Biophys. 655 1–11. 10.1016/j.abb.2018.08.001 - DOI - PubMed