

Evidence for the evolution of thermal tolerance, but not desiccation tolerance, in response to hotter, drier city conditions in a cosmopolitan, terrestrial isopod
- PMID: 33519953
- PMCID: PMC7819561
- DOI: 10.1111/eva.13052
Evidence for the evolution of thermal tolerance, but not desiccation tolerance, in response to hotter, drier city conditions in a cosmopolitan, terrestrial isopod
Abstract
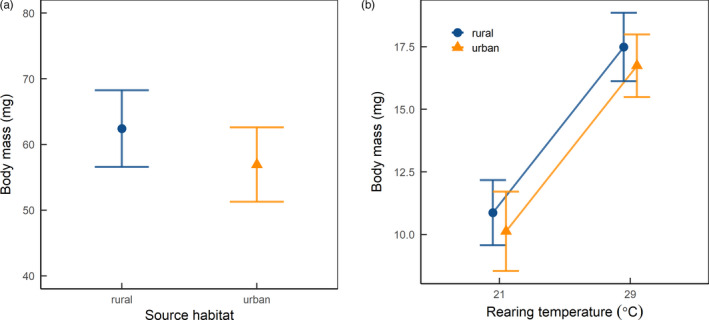
Cities are often hotter and drier compared with nearby undeveloped areas, but how organisms respond to these multifarious stressors associated with urban heat islands is largely unknown. Terrestrial isopods are especially susceptible to temperature and aridity stress as they have retained highly permeable gills from their aquatic ancestors. We performed a two temperature common garden experiment with urban and rural populations of the terrestrial isopod, Oniscus asellus, to uncover evidence for plastic and evolutionary responses to urban heat islands. We focused on physiological tolerance traits including tolerance of heat, cold, and desiccation. We also examined body size responses to urban heat islands, as size can modulate physiological tolerances. We found that different mechanisms underlie responses to urban heat islands. While evidence suggests urban isopods may have evolved higher heat tolerance, urban and rural isopods had statistically indistinguishable cold and desiccation tolerances. In both populations, plasticity to warmer rearing temperature diminished cold tolerance. Although field-collected urban and rural isopods were the same size, rearing temperature positively affected body size. Finally, larger size improved desiccation tolerance, which itself was influenced by rearing temperature. Our study demonstrates how multifarious changes associated with urban heat islands will not necessarily contribute to contemporary evolution in each of the corresponding physiological traits.
Keywords: adaptation; body size; global change; plasticity; urban evolution.
© 2020 The Authors. Evolutionary Applications published by John Wiley & Sons Ltd.
Conflict of interest statement
None declared.
Figures


Similar articles
-
Adaptation to Urban Heat Islands Enhances Thermal Performance Following Development under Chronic Thermal Stress but Not Benign Conditions in the Terrestrial Isopod Oniscus asellus.Physiol Biochem Zool. 2022 Jul-Aug;95(4):302-316. doi: 10.1086/720333. Physiol Biochem Zool. 2022. PMID: 35594563
-
Remarkable insensitivity of acorn ant morphology to temperature decouples the evolution of physiological tolerance from body size under urban heat islands.J Therm Biol. 2019 Oct;85:102426. doi: 10.1016/j.jtherbio.2019.102426. Epub 2019 Oct 3. J Therm Biol. 2019. PMID: 31657738
-
Evolution of thermal tolerance and its fitness consequences: parallel and non-parallel responses to urban heat islands across three cities.Proc Biol Sci. 2018 Jul 4;285(1882):20180036. doi: 10.1098/rspb.2018.0036. Proc Biol Sci. 2018. PMID: 30051828 Free PMC article.
-
Physiological adaptation to cities as a proxy to forecast global-scale responses to climate change.J Exp Biol. 2021 Feb 24;224(Pt Suppl 1):jeb229336. doi: 10.1242/jeb.229336. J Exp Biol. 2021. PMID: 33627462 Review.
-
Terrestrial isopods in urban environments: an overview.Zookeys. 2018 Dec 3;(801):97-126. doi: 10.3897/zookeys.801.29580. eCollection 2018. Zookeys. 2018. PMID: 30564033 Free PMC article. Review.
Cited by
-
Isolation of lignocellulosic biomass-degrading bacteria from Porcellio dilatatus gut-enriched cultures.Appl Microbiol Biotechnol. 2025 Feb 1;109(1):35. doi: 10.1007/s00253-025-13420-6. Appl Microbiol Biotechnol. 2025. PMID: 39893273 Free PMC article.
-
Parental exposure to heat waves improves offspring reproductive investment in Tetranychus urticae (Acari: Tetranychidae), but not in its predator, Phytoseiulus persimilis (Acari: Phytoseiidae).Ecol Evol. 2023 Nov 28;13(11):e10748. doi: 10.1002/ece3.10748. eCollection 2023 Nov. Ecol Evol. 2023. PMID: 38034335 Free PMC article.
-
Water-seeking behavior among terrestrial arthropods and mollusks in a cool mesic region: Spatial and temporal patterns.PLoS One. 2021 Nov 22;16(11):e0260070. doi: 10.1371/journal.pone.0260070. eCollection 2021. PLoS One. 2021. PMID: 34807930 Free PMC article.
-
Trans- and Within-Generational Developmental Plasticity May Benefit the Prey but Not Its Predator during Heat Waves.Biology (Basel). 2022 Jul 27;11(8):1123. doi: 10.3390/biology11081123. Biology (Basel). 2022. PMID: 36009751 Free PMC article.
-
Evolution of thermal performance curves: A meta-analysis of selection experiments.J Evol Biol. 2023 Jan;36(1):15-28. doi: 10.1111/jeb.14087. Epub 2022 Sep 21. J Evol Biol. 2023. PMID: 36129955 Free PMC article.
References
-
- Allee, W. C. (1926). Studies in animal aggregations: Causes and effects of bunching in land isopods. Journal of Experimental Zoology, 45(1), 255–277. 10.1002/jez.1400450108 - DOI
-
- Angilletta, M. J. J. (2009). Thermal adaptation: A theoretical and empirical synthesis. Oxford, UK: Oxford University Press.
Associated data
LinkOut - more resources
Full Text Sources
Other Literature Sources
