

Widespread genetic connectivity of feral pigeons across the Northeastern megacity
- PMID: 33519962
- PMCID: PMC7819573
- DOI: 10.1111/eva.12972
Widespread genetic connectivity of feral pigeons across the Northeastern megacity
Abstract
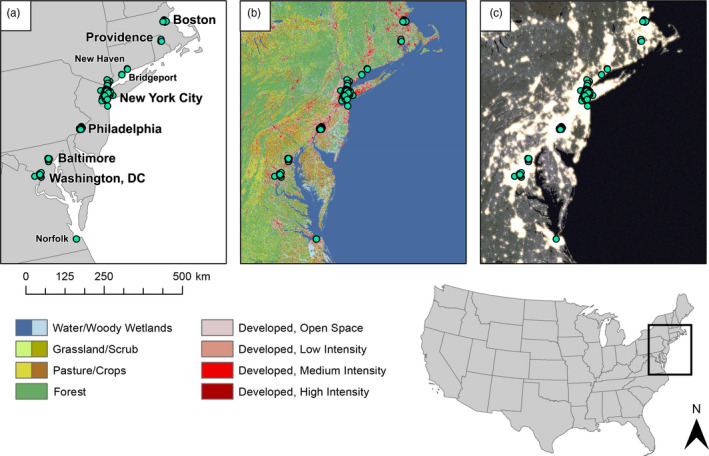
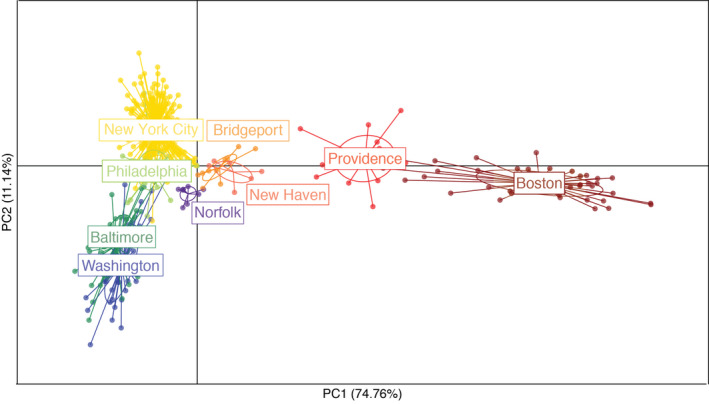
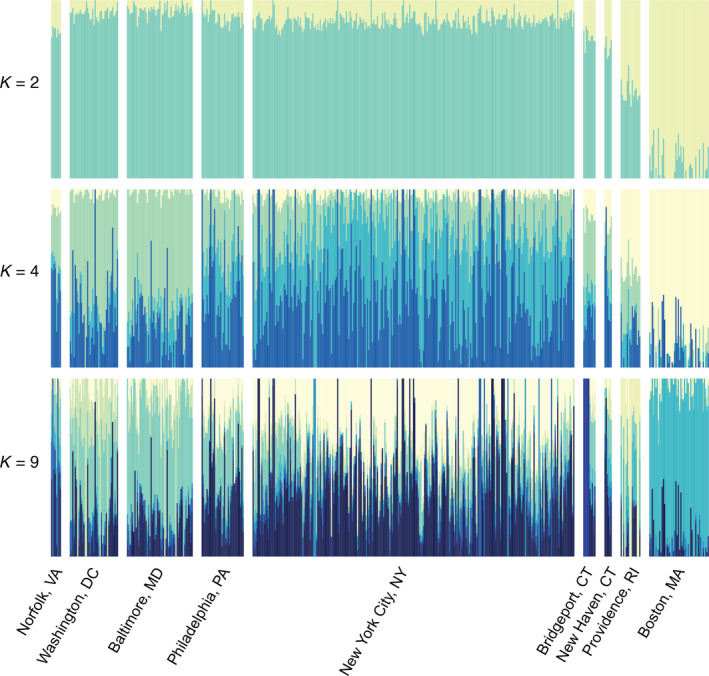
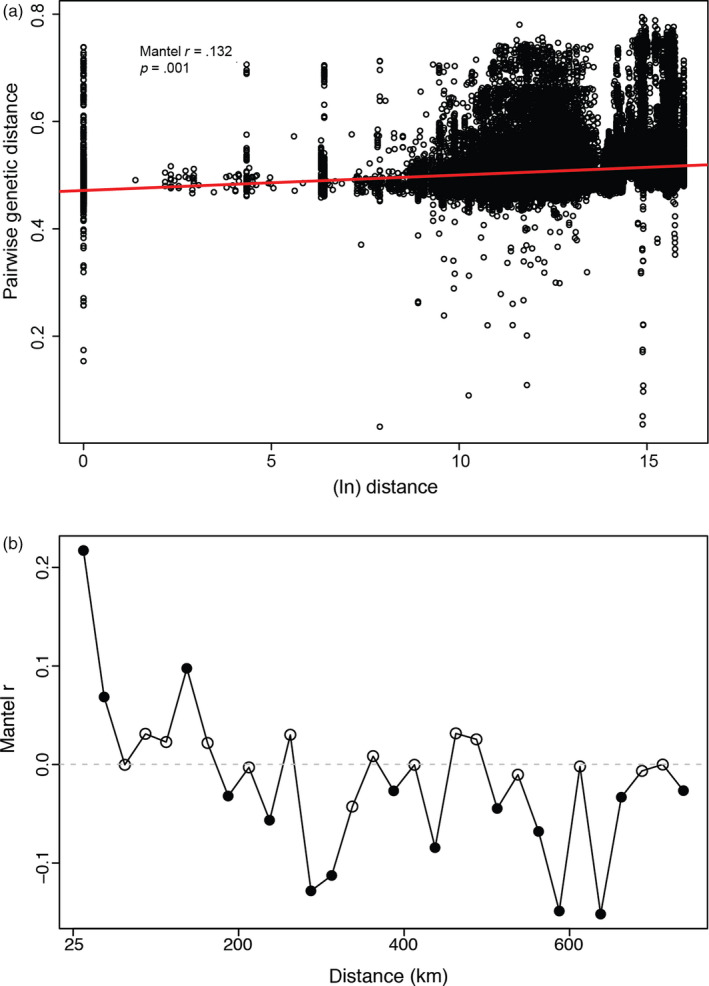
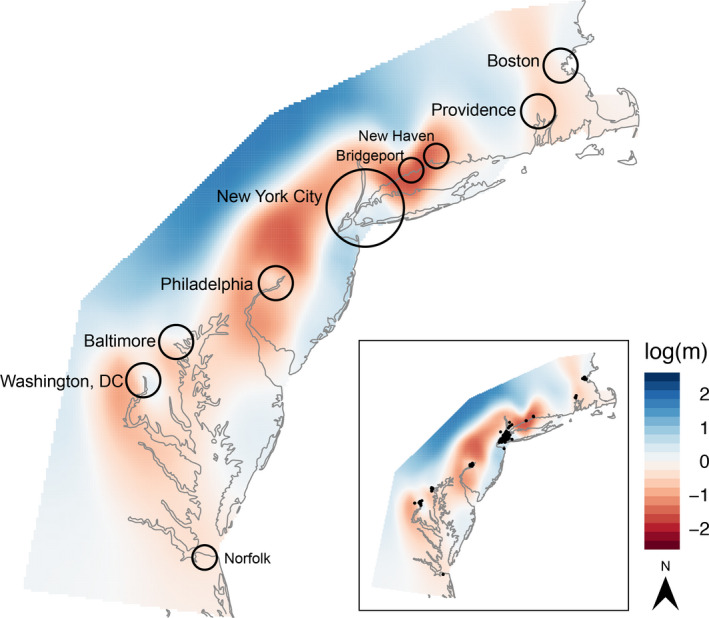
Urbanization may restrict, facilitate, or have no effect on gene flow, depending on the organism and extent of urbanization. In human commensals, with high dispersal ability, urbanization can facilitate gene flow by providing continuous suitable habitat across a wide range. Additionally, suburban or rural areas with lower human population density may act as a barrier to gene flow for these human commensals. Spatial population genetic approaches provide a means to understand genetic connectivity across geographically expansive areas that encompass multiple metropolitan areas. Here, we examined the spatial genetic patterns of feral pigeons (Columba livia) living in cities in the eastern United States. We focused our sampling on the Northeastern megacity, which is a region covering six large cities (Boston, Providence, New York City, Philadelphia, Baltimore, and Washington, DC). We performed ddRAD-Seqon 473 samples, recovered 35,200 SNPs, and then used multiple evolutionary clustering analyses to investigate population structuring. These analyses revealed that pigeons formed two genetic clusters-a northern cluster containing samples from Boston and Providence and a southern cluster containing all other samples. This substructuring is possibly due to reduced urbanization across coastal Connecticut that separates Boston and Providence from New York and mid-Atlantic cities. We found that pairs of pigeons within 25 km are highly related (Mantel r = 0.217, p = .001) and that beyond 50 km, pigeons are no more related than they would be at random. Our analysis detected higher-than-expected gene flow under an isolation by distance model within each city. We conclude that the extreme urbanization characteristic of the Northeastern megacity is likely facilitating gene flow in feral pigeons.
Keywords: Columba livia; Northeastern megacity; Rock Dove; pigeon; population genetics; urban evolution.
© 2020 The Authors. Evolutionary Applications published by John Wiley & Sons Ltd.
Figures
Similar articles
-
Artificial Light at Night (ALAN) Is the Main Driver of Nocturnal Feral Pigeon (Columba livia f. domestica) Foraging in Urban Areas.Animals (Basel). 2020 Mar 26;10(4):554. doi: 10.3390/ani10040554. Animals (Basel). 2020. PMID: 32224903 Free PMC article.
-
Chlamydial infections in feral pigeons in Europe: Review of data and focus on public health implications.Vet Microbiol. 2009 Mar 16;135(1-2):54-67. doi: 10.1016/j.vetmic.2008.09.045. Epub 2008 Sep 16. Vet Microbiol. 2009. PMID: 18977610 Review.
-
Screening of Healthy Feral Pigeons (Columba livia domestica) in the City of Zurich Reveals Continuous Circulation of Pigeon Paramyxovirus-1 and a Serious Threat of Transmission to Domestic Poultry.Microorganisms. 2022 Aug 17;10(8):1656. doi: 10.3390/microorganisms10081656. Microorganisms. 2022. PMID: 36014074 Free PMC article.
-
Effectiveness of Gel Repellents on Feral Pigeons.Animals (Basel). 2013 Dec 19;4(1):1-15. doi: 10.3390/ani4010001. Animals (Basel). 2013. PMID: 26479881 Free PMC article.
-
Non-linearities in bird responses across urbanization gradients: A meta-analysis.Glob Chang Biol. 2018 Mar;24(3):1046-1054. doi: 10.1111/gcb.13964. Epub 2017 Nov 23. Glob Chang Biol. 2018. PMID: 29080260
Cited by
-
Urban evolution comes into its own: Emerging themes and future directions of a burgeoning field.Evol Appl. 2020 Dec 7;14(1):3-11. doi: 10.1111/eva.13165. eCollection 2021 Jan. Evol Appl. 2020. PMID: 33519952 Free PMC article.
-
Small towns limit dispersal and reduce genetic diversity in populations of Texas horned lizards.Ecol Evol. 2024 Aug 6;14(8):e70112. doi: 10.1002/ece3.70112. eCollection 2024 Aug. Ecol Evol. 2024. PMID: 39108560 Free PMC article.
-
The Genetic Diversity and Structure of the European Turtle Dove Streptopelia turtur.Animals (Basel). 2021 Apr 29;11(5):1283. doi: 10.3390/ani11051283. Animals (Basel). 2021. PMID: 33947118 Free PMC article.
-
Moving past the challenges and misconceptions in urban adaptation research.Ecol Evol. 2022 Nov 21;12(11):e9552. doi: 10.1002/ece3.9552. eCollection 2022 Nov. Ecol Evol. 2022. PMID: 36425909 Free PMC article.
-
Population Genomics Analysis with RAD, Reprised: Stacks 2.Methods Mol Biol. 2022;2498:99-149. doi: 10.1007/978-1-0716-2313-8_7. Methods Mol Biol. 2022. PMID: 35727543
References
-
- Adams, A. L. , van Heezik, Y. , Dickinson, K. J. M. , & Robertson, B. C. (2014). Identifying eradication units in an invasive mammalian pest species. Biological Invasions, 16(7), 1481–1496. 10.1007/s10530-013-0586-9 - DOI
-
- Björklund, M. , Ruiz, I. , & Senar, J. C. (2010). Genetic differentiation in the urban habitat: The great tits (Parus major) of the parks of Barcelona city. Biological Journal of the Linnean Society, 99(1), 9–19. 10.1111/j.1095-8312.2009.01335.x - DOI
-
- Blanchong, J. A. , Sorin, A. B. , & Scribner, K. T. (2013). Genetic diversity and population structure in urban white‐tailed deer. Journal of Wildlife Management, 77(4), 855–862. 10.1002/jwmg.521 - DOI
LinkOut - more resources
Full Text Sources
