. 2021 Jan 15;12(1):19-46.
doi: 10.4239/wjd.v12.i1.19.

Metformin regulates inflammation and fibrosis in diabetic kidney disease through TNC/TLR4/NF-κB/miR-155-5p inflammatory loop

Affiliations

Metformin regulates inflammation and fibrosis in diabetic kidney disease through TNC/TLR4/NF-κB/miR-155-5p inflammatory loop

Yang Zhou et al. World J Diabetes. .

Abstract

Background: Type 2 diabetes mellitus (T2DM) is significantly increasing worldwide, and the incidence of its complications is also on the rise. One of the main complications of T2DM is diabetic kidney disease (DKD). The glomerular filtration rate (GFR) and urinary albumin creatinine ratio (UACR) increase in the early stage. As the disease progresses, UACR continue to rise and GFR begins to decline until end-stage renal disease appears. At the same time, DKD will also increase the incidence and mortality of cardiovascular and cerebrovascular diseases. At present, the pathogenesis of DKD is not very clear. Therefore, exploration of the pathogenesis of DKD to find a treatment approach, so as to delay the development of DKD, is essential to improve the prognosis of DKD.

Aim: To detect the expression of tenascin-C (TNC) in the serum of T2DM patients, observe the content of TNC in the glomerulus of DKD rats, and detect the expression of TNC on inflammatory and fibrotic factors in rat mesangial cells (RMCs) cultured under high glucose condition, in order to explore the specific molecular mechanism of TNC in DKD and bring a new direction for the treatment of DKD.

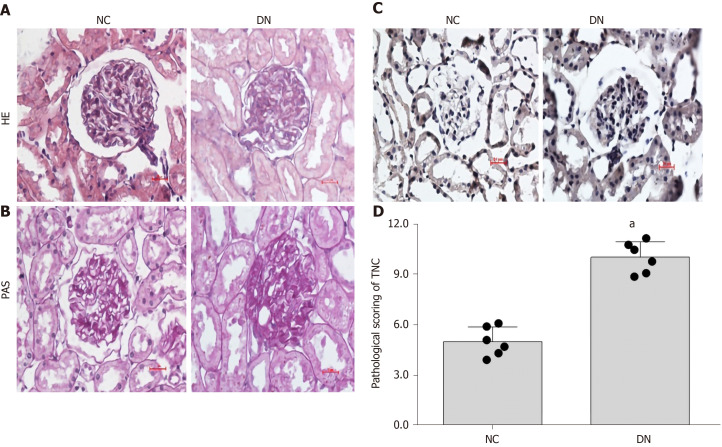
Methods: The expression level of TNC in the serum of diabetic patients was detected by enzyme-linked immunosorbent assay (ELISA), the protein expression level of TNC in the glomerular area of DKD rats was detected by immunohistochemistry, and the expression level of TNC in the rat serum was detected by ELISA. Rat glomerular mesangial cells were cultured. Following high glucose stimulation, the expression levels of related proteins and mRNA were detected by Western blot and polymerase chain reaction, respectively.

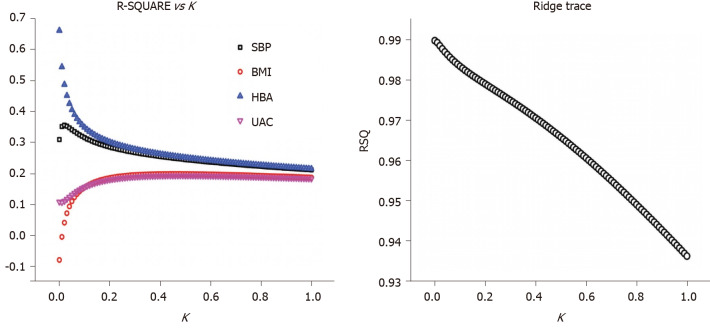
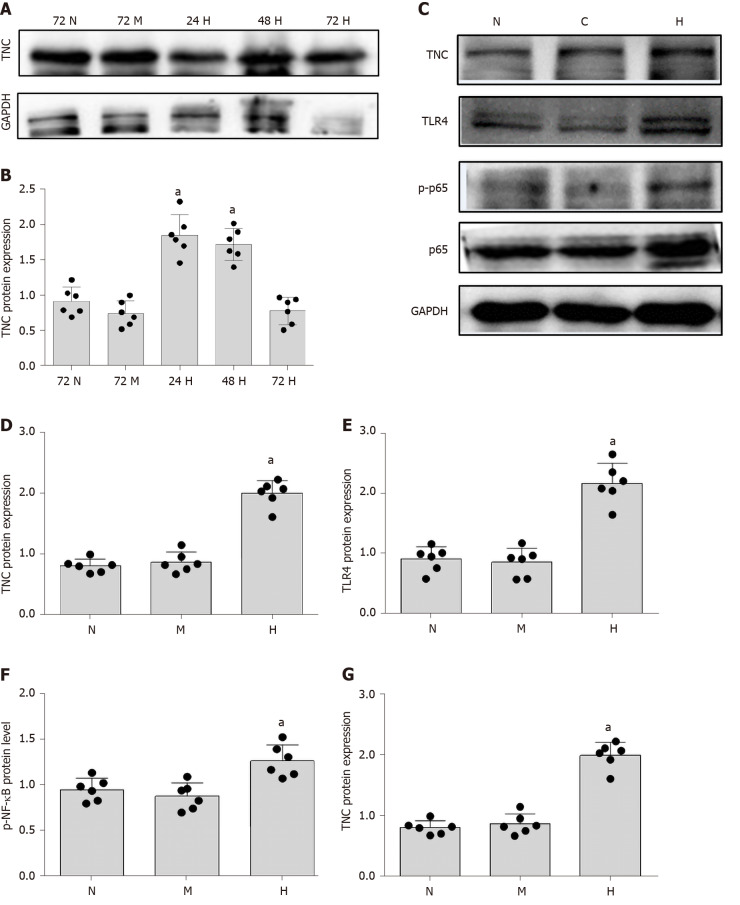
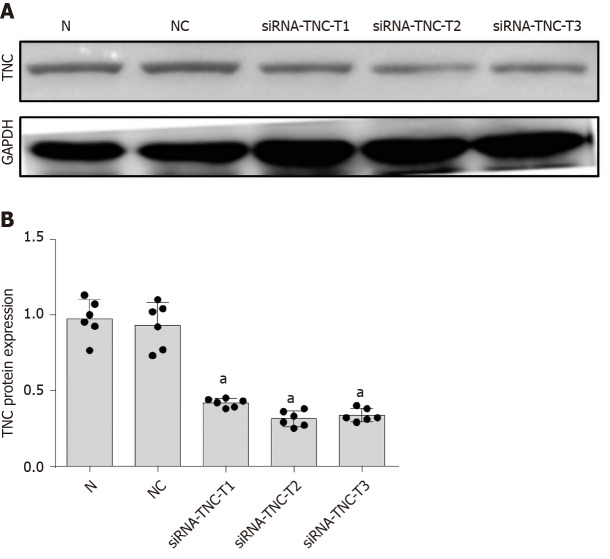
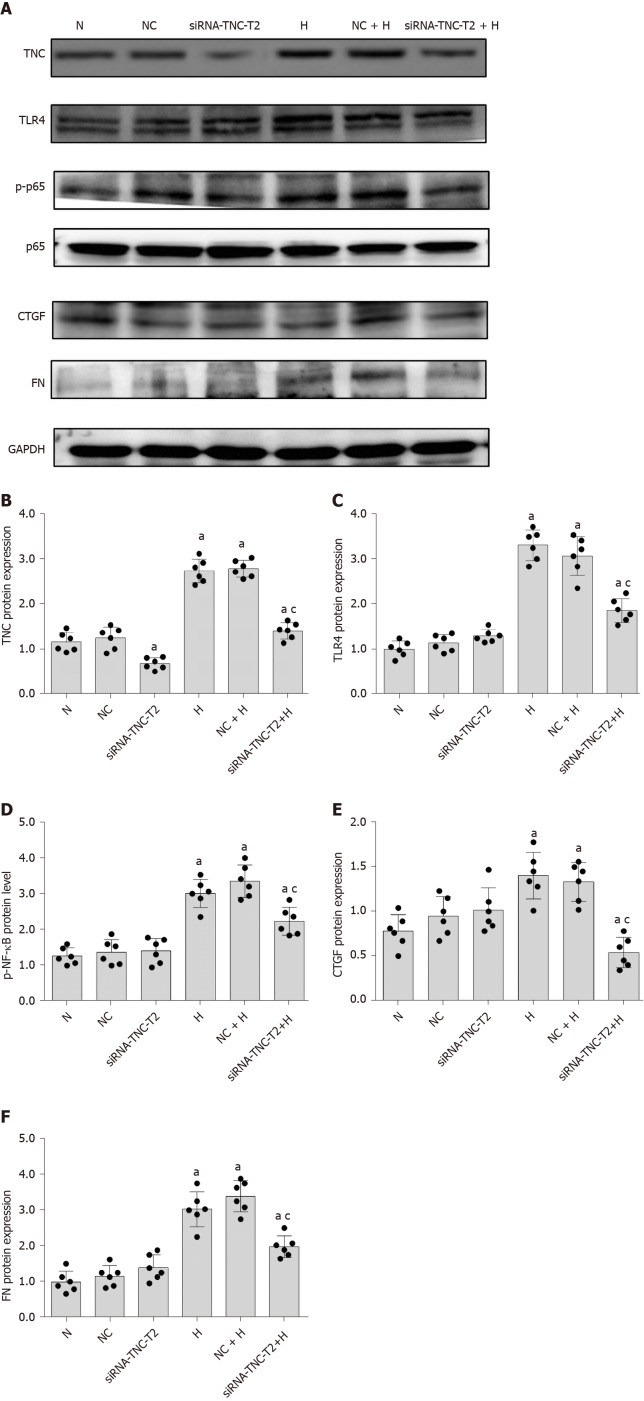
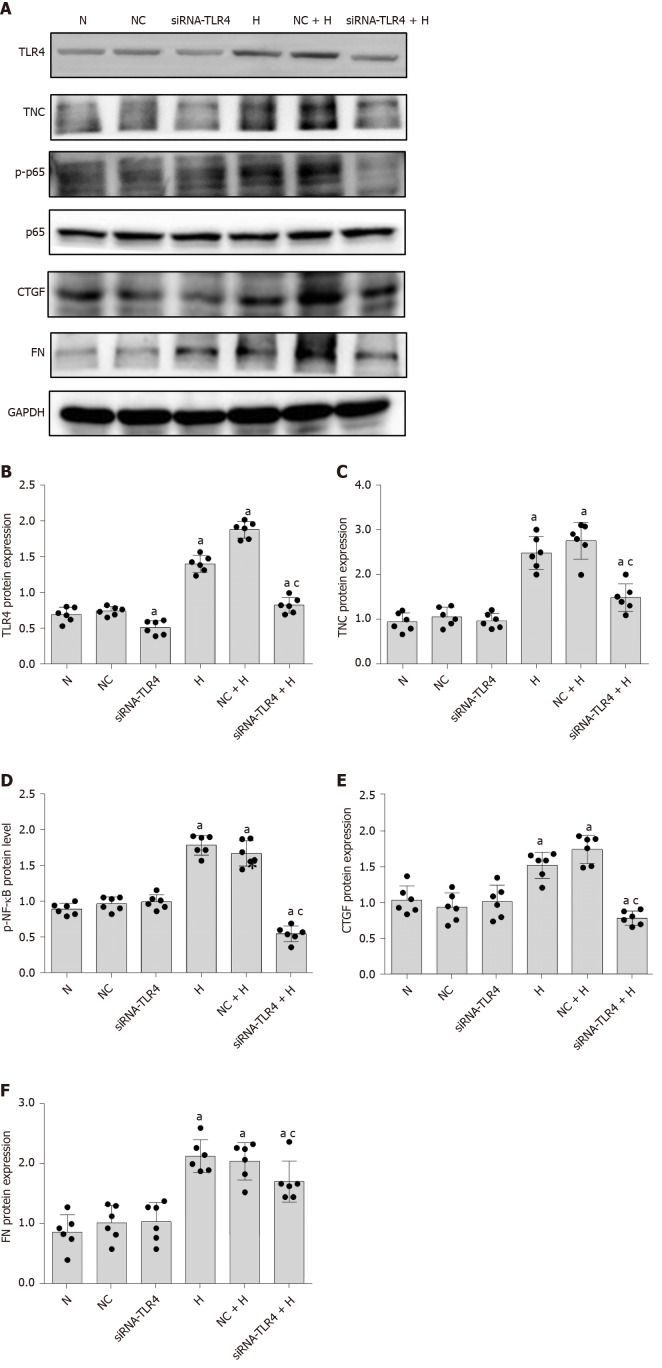
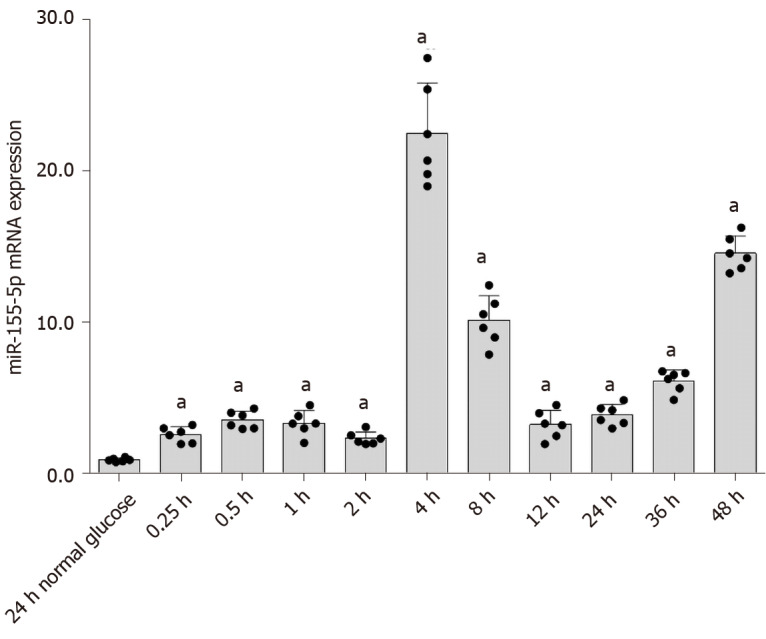
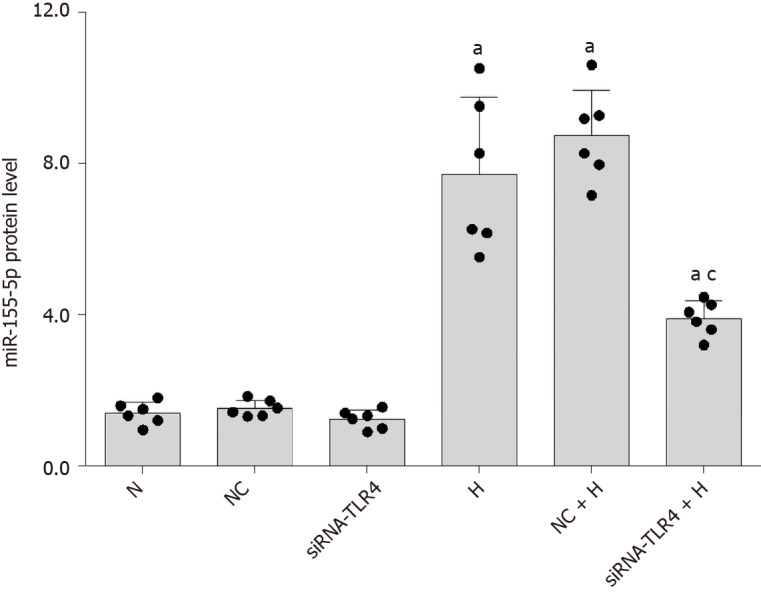
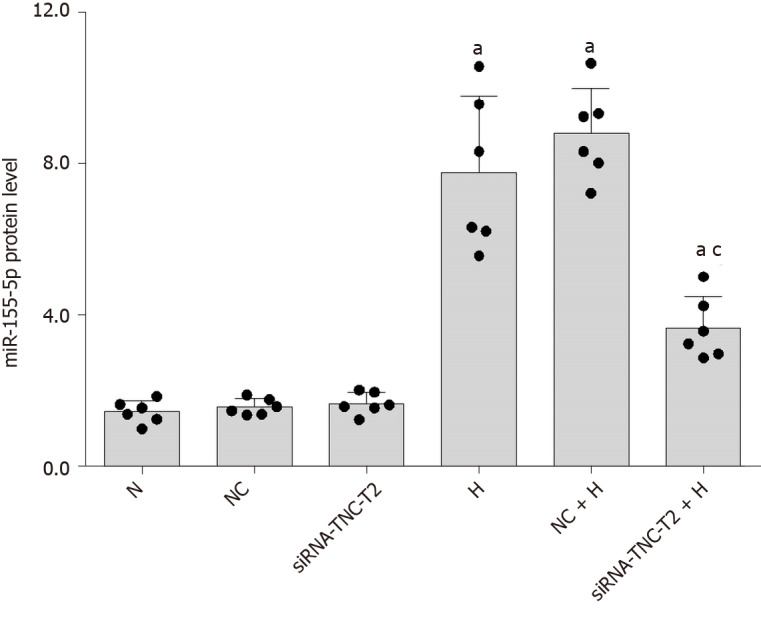
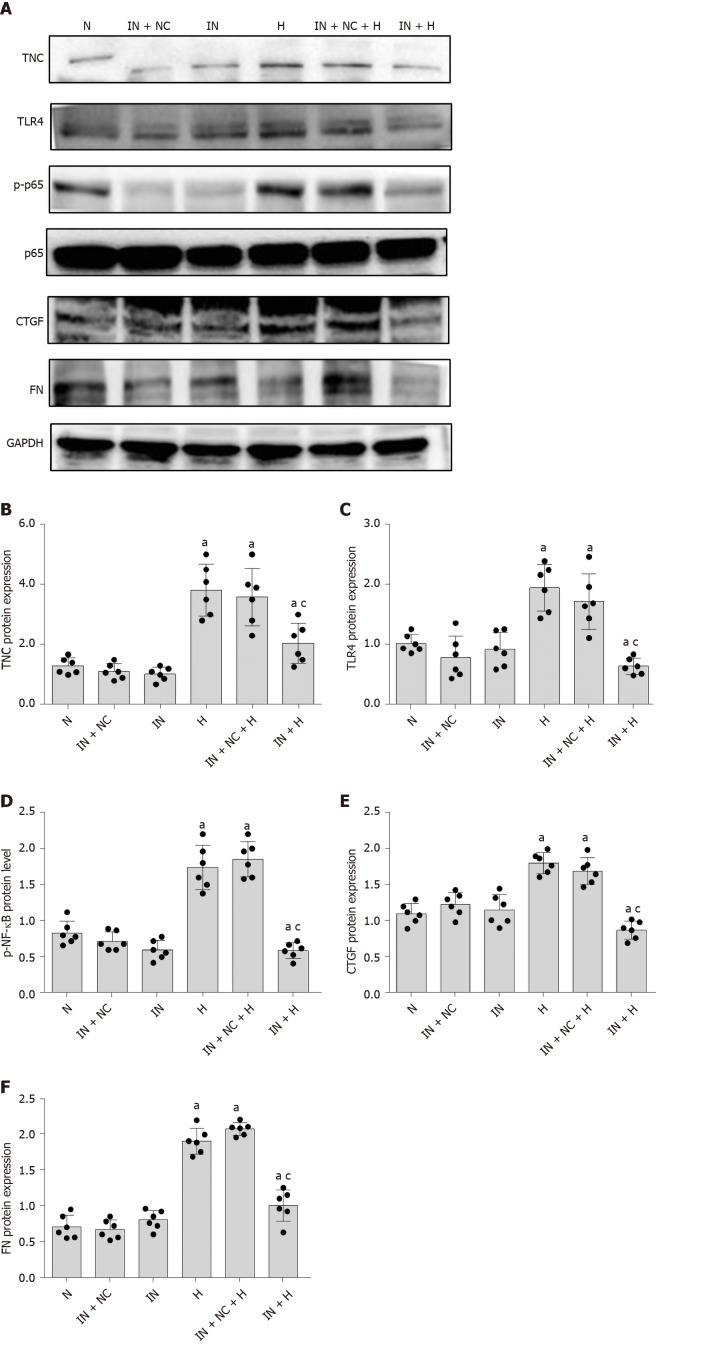
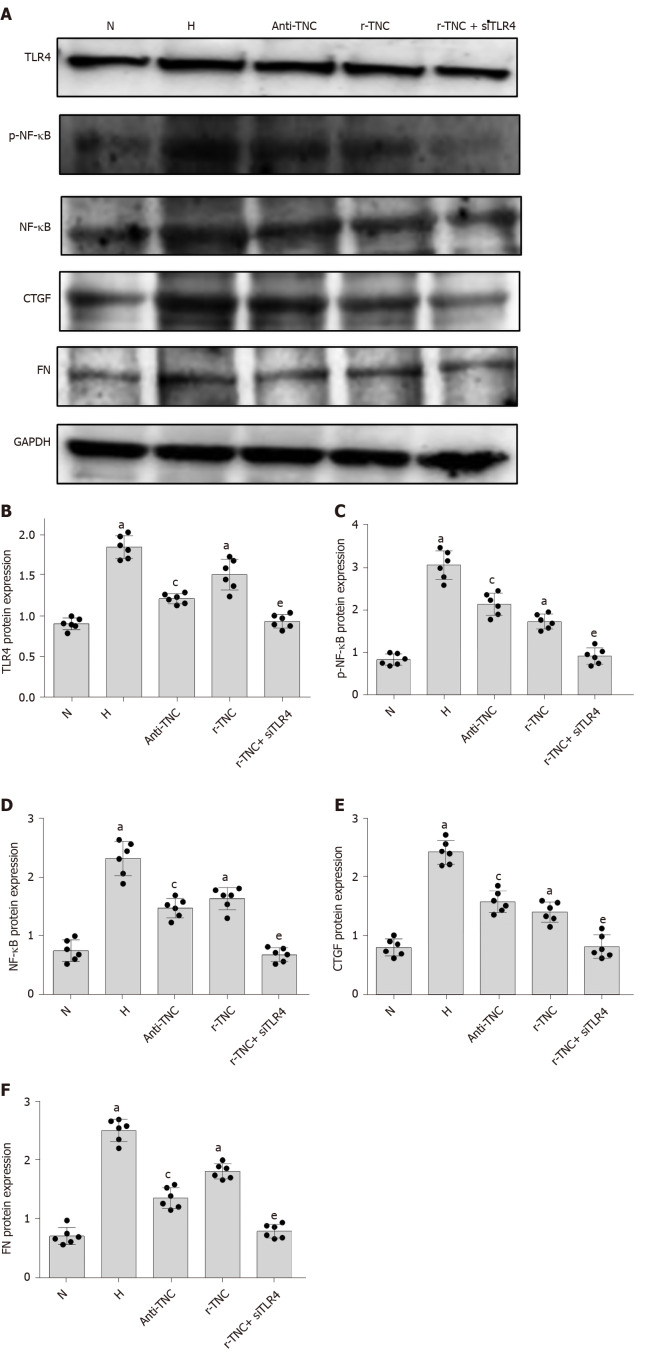
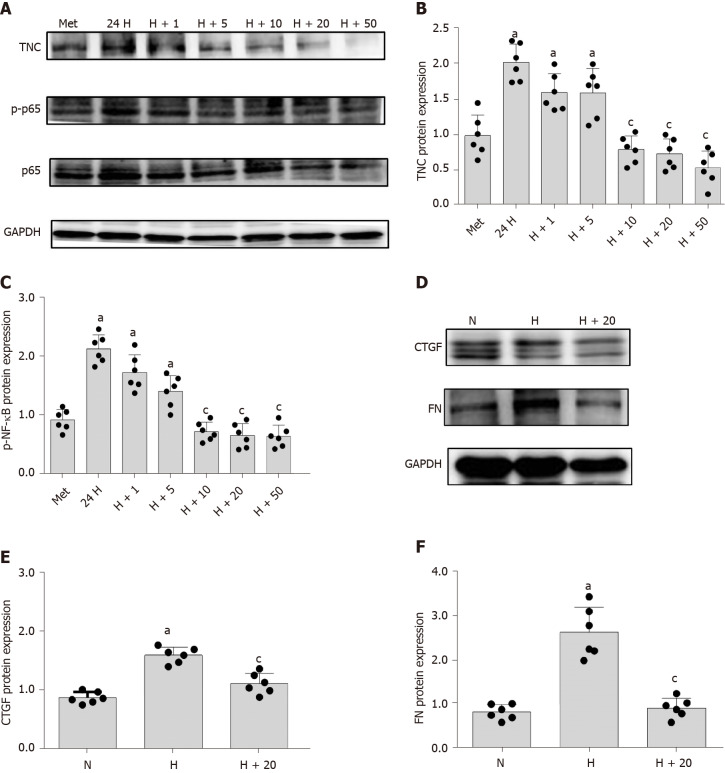
Results: ELISA results revealed an increase in the serum TNC level in patients with T2DM. Increasing UACR and hypertension significantly increased the expression of TNC (P < 0.05). TNC expression was positively correlated with glycosylated haemoglobin (HbA1c) level, body mass index, systolic blood pressure, and UACR (P < 0.05). Immunohistochemical staining showed that TNC expression in the glomeruli of rats with streptozotocin-induced diabetes was significantly increased compared with normal controls (P < 0.05). Compared with normal rats, serum level of TNC in diabetic rats was significantly increased (P < 0.05), which was positively correlated with urea nitrogen and urinary creatinine (P < 0.05). The levels of TNC, Toll-like receptor-4 (TLR4), phosphorylated nuclear factor-κB p65 protein (Ser536) (p-NF-κB p65), and miR-155-5p were increased in RMCs treated with high glucose (P < 0.05). The level of TNC protein peaked 24 h after high glucose stimulation (P < 0.05). After TNC knockdown, the levels of TLR4, p-NF-κB p65, miR-155-5p, connective tissue growth factor (CTGF), and fibronectin (FN) were decreased, revealing that TNC regulated miR-155-5p expression through the TLR4/NF-κB p65 pathway, thereby regulating inflammation (NF-κB p65) and fibrosis (CTGF and FN) in individuals with DKD. In addition, metformin treatment may relive the processes of inflammation and fibrosis in individuals with DKD by reducing the levels of the TNC, p-NF-κB p65, CTGF, and FN proteins.

Conclusion: TNC can promote the occurrence and development of DKD. Interfering with the TNC/TLR4/NF-κB p65/miR-155-5p pathway may become a new target for DKD treatment.

Keywords: Diabetic kidney disease; Metformin; Tenascin-C; Toll-like receptor 4; Type 2 diabetes mellitus; miR-155-5p.


Conflict of interest statement

Conflict-of-interest statement: The author(s) have no potential conflicts of interest with respect to the research, authorship, and/or publication of this article to declare.

Figures

Figure 1
Figure 1
Relationship between the determination coefficient (R2) and K value, as shown by the ridge regression analysis. RSQ: R-SQUARE; SBP: Systolic blood pressure; BMI: Body mass index; HBA: Glycosylated hemoglobin; UAC: Urinary albumin creatinine ratio.
Figure 2
Figure 2
Histological changes and tenascin-C expression in the kidneys of diabetic rats. A: Hematoxylin-eosin staining; B: Periodic acid-Schiff staining (400 ×); C: Immunohistochemical staining; D: Pathological scoring of tenascin-C (TNC). Scale bar: 20 μm. Representative immunohistochemical images and immunohistochemical scores for TNC in renal section are shown. aP < 0.05 compared with the NC control group. NC, n = 6, DN, n = 6. NC: Normal rat renal section; DN: Diabetic rat renal section; HE: Hematoxylin-eosin; PAS: Periodic acid-Schiff; TNC: Tenascin-C.
Figure 3
Figure 3
Changes in the levels of the tenascin-C and toll-like receptor-4 proteins and nuclear factor-κB p65 protein (Ser536) phosphorylation in cells stimulated with high glucose. A and B: Protein bands and protein expression of tenascin-C (TNC). Rat mesangial cells (RMCs) were cultured under normal (NG, 5.5 mmol/L glucose) and hypertonic (HM, 5.5 mmol/L glucose + 24.5 mmol/L mannitol) conditions for 72 h, or high-glucose (HG, 30 mmol/L glucose) conditions for 24, 48, and 72 h. aP < 0.05 compared with the 72 h control group; C-G: Protein bands and protein expression of TNC, Toll-like receptor-4, and phosphorylated nuclear factor-κB p65 protein (Ser536). RMCs were cultured under normal (NG, 5.5 mmol/L glucose), hypertonic (HM, 5.5 mmol/L glucose + 24.5 mmol/L mannitol), and high-glucose (HG, 30 mmol/L glucose) conditions for 24 h. aP < 0.05 compared with the N control group. Protein levels were detected using Western blot. The results are presented as the mean ± SD of six independent experiments after normalization to GAPDH levels. TNC: Tenascin-C; TLR4: Toll-like receptor-4; p-NF-κB p65: Phosphorylated nuclear factor-κB p65 protein (Ser536); N: Normal glucose; M: Hypertonic; H: High-glucose.
Figure 4
Figure 4
Screening siRNAs to silence the expression of tenascin-C protein. A: Protein bands; B: Protein expression of tenascin-C (TNC). Rat mesangial cells (RMCs) were transfected with siRNA-TNC-T1, siRNA-TNC-T2, siRNA-TNC-T3, and siRNA-NC. RMCs were cultured in normal glucose (NG, 5.5 mmol/L glucose) medium for 24 h. aP < 0.05 compared with untransfected RMCs cultured with normal glucose concentrations. The level of the tenascin-C protein was detected using Western blot. The results are presented as the mean ± SD of six independent experiments after normalization to GAPDH levels. TNC: Tenascin-C; NC: Negative control; N: Normal glucose.
Figure 5
Figure 5
Silencing of tenascin-C protein expression inhibits the expression of Toll-like receptor-4 and fibrosis factors (connective tissue growth factor and fibronectin), as well as the phosphorylation of p65. A: Protein bands; B-F: Protein expression of tenascin-C (TNC), Toll-like receptor-4 (TLR4), phosphorylated nuclear factor-κB p65 (Ser536) (p-NF-κB p65), connective tissue growth factor (CTGF), and fibronectin (FN). Rat mesangial cells (RMCs) were transfected with siRNA-TNC-T2 for 6 h, and the media were then replaced with normal-glucose (NG, 5.5 mmol/L glucose) or high-glucose (HG, 30 mmol/L glucose) medium for 24 h (N, 5.5 mmol/L glucose). RMCs were transfected with siRNA-TNC-T2 and siRNA-NC for 6 h, and the media were then replaced with normal-glucose (NG, 5.5 mmol/L glucose) or high-glucose (HG, 30 mmol/L glucose) medium for 24 h. aP < 0.05 compared with RMCs cultured with normal glucose concentrations; cP < 0.05 compared with RMCs cultured with high glucose concentrations. TNC, TLR4, p-NF-κB p65, NF-κB p65, CTGF, and FN levels were all detected using Western blot. The results are presented as the mean ± SD of six independent experiments after normalization to GAPDH levels. TNC: Tenascin-C; TLR4: Toll-like receptor-4; p-p65: Phosphorylated nuclear factor-κB p65 (Ser536); p65: Nuclear factor-κB p65; CTGF: Connective tissue growth factor; FN: Fibronectin; N: Normal control; NC: Negative control; H: High glucose.
Figure 6
Figure 6
Silencing Toll-like receptor-4 protein expression inhibits the expression of tenascin-C and fibrosis factors (connective tissue growth factor and fibronectin), as well as nuclear factor-κB p65 phosphorylation. A: Protein bands; B-F: Protein expression of tenascin-C (TNC), Toll-like receptor-4 (TLR4), phosphorylated nuclear factor-κB p65 (Ser536) (p-NF-κB p65), connective tissue growth factor (CTGF), and fibronectin (FN). Rat mesangial cells (RMCs) were transfected with siRNA-TLR4 for 6 h, and the media were then replaced with normal-glucose (NG, 5.5 mmol/L glucose) or high-glucose (HG, 30 mmol/L glucose) medium for 24 h (NG, 5.5 mmol/L glucose), (HG, 30 mmol/L glucose). RMCs were transfected with siRNA-TLR4 and siRNA-NC for 6 h, and the media were then replaced with normal-glucose (NG, 5.5 mmol/L glucose) or high-glucose (HG, 30 mmol/L glucose) medium for 24 h. aP < 0.05 compared with RMCs cultured with normal glucose concentrations; cP < 0.05 compared with RMCs cultured with high glucose concentrations. TNC, TLR4, p-NF-κB p65, NF-κB p65, CTGF, and FN levels were detected using Western blot. The results are presented as the mean ± SD of six independent experiments after normalization to GAPDH levels. TNC: Tenascin-C; TLR4: Toll-like receptor-4; p-p65: Phosphorylated nuclear factor-κB p65 (Ser536); p65: Nuclear factor-κB p65; CTGF: Connective tissue growth factor; FN: Fibronectin; N: Normal control; NC: Negative control; H: High glucose.
Figure 7
Figure 7
Expression of miR-155-5p induced by high glucose treatment for different durations. Rat mesangial cells (RMCs) cultured under normal-glucose (NG, 5.5 mmol/L glucose) and high-glucose (HG, 30 mmol/L glucose) conditions were treated with high glucose concentrations for 0.25, 0.5, 1, 2, 4, 8, 12, 24, 36, and 48 h. The expression of miR-155-5p increased beginning at 0.25 h and peaked after 4 h. aP < 0.05 compared with RMCs cultured with normal glucose concentrations. The expression of miR-155-5p was quantified using real-time polymerase chain reaction. The results were normalized to the expression of the U6 mRNA and are presented as the mean ± SD of six independent experiments.
Figure 8
Figure 8
Silencing of Toll-like receptor-4 expression inhibits miR-155-5p expression. Rat mesangial cells (RMCs) were transfected with siRNA-TLR4 to silence Toll-like receptor-4 (TLR4) expression and siRNA-NC for 6 h, and the media were then replaced with normal-glucose (NG, 5.5 mmol/L glucose) or high-glucose (HG, 30 mmol/L glucose) medium for 24 h. aP < 0.05 compared with RMCs cultured with normal glucose concentrations; cP < 0.05 compared with RMCs cultured with high glucose concentrations. The expression of miR-155-5p was quantified using real-time polymerase chain reaction. The results were normalized to the expression of the U6 mRNA and are presented as the mean ± SD of six independent experiments. TLR4: Toll-like receptor-4; N: Normal control; NC: Negative control; H: High-glucose.
Figure 9
Figure 9
Silencing of tenascin-C expression inhibits miR-155-5p expression. Rat mesangial cells (RMCs) were transfected with siRNA-TNC-T2 and siRNA-NC for 6 h, and the media were then replaced with normal-glucose (NG, 5.5 mmol/L glucose) or high-glucose (HG, 30 mmol/L glucose) medium for 24 h. aP < 0.05 compared with RMCs cultured with normal glucose concentrations; cP < 0.05 compared with RMCs cultured with high glucose concentrations. The expression of miR-155-5p was quantified using real-time polymerase chain reaction. The results were normalized to the expression of the U6 mRNA and are presented as the mean ± SD of six independent experiments. N: Normal control; NC: Negative control; H: High-glucose.
Figure 10
Figure 10
Inhibition of miR-155-5p expression. A: Protein bands; B-F: Protein expression of tenascin-C (TNC), Toll-like receptor-4 (TLR4), phosphorylated nuclear factor-κB p65 (Ser536) (p-NF-κB p65), connective tissue growth factor (CTGF), and fibronectin (FN). Rat mesangial cells (RMCs) were transfected with a miR-155-5p inhibitor to inhibit the expression of miR-155-5p (IN) or non-specific inhibitor (IN-NC) for 6 h and further cultured with normal glucose or high glucose concentrations for 24 h. The inhibition of miR-155-5p reduced the levels of TNC, TLR4, fibrosis factors (CTGF and FN), and p-NF-κB p65. RMCs were transfected with siRNA-IN to inhibit miR-155-5p and siRNA-NC for 6 h, and the media were then replaced with normal-glucose (NG, 5.5 mmol/L glucose) or high-glucose (HG, 30 mmol/L glucose) medium for 24 h. aP < 0.05 compared with RMCs cultured with normal glucose concentrations; cP < 0.05 compared with RMCs cultured with high glucose concentrations. TNC, TLR4, p-NF-κB p65, NF-κB p65, CTGF, and FN levels were all detected using Western blot. The results are presented as the mean ± SD of six independent experiments after normalization to GAPDH levels. TNC: Tenascin-C; TLR4: Toll-like receptor-4; p-NF-κB p65: Phosphorylated nuclear factor-κB p65 (Ser536); NF-κB p65: Nuclear factor-κB p65; CTGF: Connective tissue growth factor; FN; Fibronectin; N: Normal control; NC: Negative control; H: High-glucose.
Figure 11
Figure 11
Signaling pathway experiment. A: Protein bands; B-F: Protein expression of Toll-like receptor-4 (TLR4), phosphorylated nuclear factor-κB p65 (Ser536) (p-NF-κB p65), connective tissue growth factor (CTGF), and fibronectin (FN). Rat mesangial cells (RMCs) were treated with TNC inhibitory antibody or TNC recombinant protein with or without transfected with siRNA-TLR4. RMCs cultured with normal glucose concentrations (N, 5.5 mmol/L glucose) or high-glucose (H, 30 mmol/L glucose) medium for 24 h, RMCs were pretreated with 0.5 mg/mL TNC blocking peptide and cultured with high-glucose (Anti-TNC, 30 mmol/L glucose), RMCs were treated with 2.5 ug/mL recombinant TNC (r-TNC), RMCs were transfected with siRNA-TLR4 to silence TLR4 expression for 6 h, and the media were then replaced with normal-glucose (NG, 5.5 mmol/L glucose) and treated with 2.5 ug/mL r-TNC(r-TNC+siTLR4). All RMCs were treated for 24 h and collected for subsequent experiments. aP < 0.05 compared with RMCs cultured with normal glucose concentrations; cP < 0.05 compared with RMCs cultured with high glucose concentrations; eP < 0.05 compared with RMCs treated with r-TNC. TLR4, p-NF-κB p65, NF-κB p65, connective tissue growth factor, and fibronectin levels were all detected using Western blot. The results are presented as the mean ± SD of six independent experiments after normalization to GAPDH levels. TLR4: Toll-like receptor-4; p-NF-κB p65: Phosphorylated nuclear factor-κB p65 (Ser536); NF-κB p65: Nuclear factor-κB p65; CTGF: Connective tissue growth factor; FN: Fibronectin; N: Normal control; H: High-glucose.
Figure 12
Figure 12
Inhibitory effects of metformin on rat mesangial cells. A-C: Protein bands and protein expression of tenascin-C (TNC) and phosphorylated nuclear factor-κB p65 (Ser536) (p-NF-κB p65). The MET (5.5 mmol/L glucose + 10 μmol/L metformin), 24H (30 mmol/L glucose), H+1 (30 mmol/L glucose + 1 μmol/L metformin), H+5 (30 mmol/L glucose + 5 μmol/L metformin), H+10 (30 mmol/L glucose + 10 μmol/L metformin), H+20 (30 mmol/L glucose + 20 μmol/L metformin), and H+50 (30 mmol/L glucose + 50 μmol/L metformin) groups were cultured with the appropriate medium for 24 h. aP < 0.05 compared with rat mesangial cells (RMCs) cultured with normal glucose concentrations; cP < 0.05 compared with RMCs cultured with high glucose concentrations; D-F: Protein bands and protein expression of connective tissue growth factor (CTGF) and fibronectin (FN). RMCs were divided into normal-glucose (NG, 5.5 mmol/L glucose), high-glucose (HG, 30 mmol/L glucose), and H+20 (30 mmol/L glucose + 20 μmol/L metformin) groups and cultured with the appropriate medium for 24 h. aP < 0.05 compared with RMCs cultured with normal glucose concentrations; cP < 0.05 compared with RMCs cultured with high glucose concentrations. TNC, p-NF-κB p65, and NF-κB p65 levels were detected using Western blot. The results are presented as the mean ± SD of six independent experiments after normalization to GAPDH levels. TNC: Tenascin-C; p-NF-κB p65: Phosphorylated nuclear factor-κB p65 (Ser536); NF-κB p65: Nuclear factor-κB p65; CTGF: Connective tissue growth factor; FN: Fibronectin; N: Normal control; H: High-glucose.

Similar articles

Cited by

References

    1. National Kidney Foundation. KDOQI Clinical Practice Guideline for Diabetes and CKD: 2012 Update. Am J Kidney Dis. 2012;60:850–886. - PubMed
    1. Jia Y, Guan M, Zheng Z, Zhang Q, Tang C, Xu W, Xiao Z, Wang L, Xue Y. miRNAs in Urine Extracellular Vesicles as Predictors of Early-Stage Diabetic Nephropathy. J Diabetes Res. 2016;2016:7932765. - PMC - PubMed
    1. Bhattacharjee N, Barma S, Konwar N, Dewanjee S, Manna P. Mechanistic insight of diabetic nephropathy and its pharmacotherapeutic targets: An update. Eur J Pharmacol. 2016;791:8–24. - PubMed
    1. Alicic RZ, Rooney MT, Tuttle KR. Diabetic Kidney Disease: Challenges, Progress, and Possibilities. Clin J Am Soc Nephrol. 2017;12:2032–2045. - PMC - PubMed
    1. Chiquet-Ehrismann R, Tucker RP. Tenascins and the importance of adhesion modulation. Cold Spring Harb Perspect Biol. 2011;3 - PMC - PubMed