. 2021 Jan 13;10(1):25.
doi: 10.1167/tvst.10.1.25. eCollection 2021 Jan.

Visual Field Reconstruction Using fMRI-Based Techniques

Affiliations

Visual Field Reconstruction Using fMRI-Based Techniques

Joana Carvalho et al. Transl Vis Sci Technol. .

Abstract

Purpose: To evaluate the accuracy and reliability of functional magnetic resonance imaging (fMRI)-based techniques to assess the integrity of the visual field (VF).

Methods: We combined 3T fMRI and neurocomputational models, that is, conventional population receptive field (pRF) mapping and a new advanced pRF framework "microprobing" (MP), to reconstruct the VF representations of different cortical areas. To demonstrate their scope, both approaches were applied in healthy participants with simulated scotomas and participants with glaucoma. For the latter group we compared the VFs obtained with standard automated perimetry (SAP) and via fMRI.

Results: Using SS, we found that the fMRI-based techniques can detect absolute defects in VFs that are larger than 3°, in single participants, based on 12 minutes of fMRI scan time. Moreover, we found that the MP approach results in a less biased estimation of the preserved VF. In participants with glaucoma, we found that fMRI-based VF reconstruction detected VF defects with a correspondence to SAP that was decent, reflected by the positive correlation between fMRI-based sampling density and SAP-based contrast sensitivity loss (SAP) r2 = 0.44, P = 0.0002. This correlation was higher for MP compared to that for the conventional pRF analysis.

Conclusions: The fMRI-based reconstruction of the VF enables the evaluation of vision loss and provides useful details on the properties of the visual cortex.

Translational relevance: The fMRI-based VF reconstruction provides an objective alternative to detect VF defects. It may either complement SAP or could provide VF information in patients unable to perform SAP.

Keywords: computational modeling; fMRI; glaucoma; receptive field; visual field mapping.


Conflict of interest statement

Disclosure: J. Carvalho, None; A. Invernizzi, None; J. Martins, None; N.M. Jansonius, None; R.J. Renken, None; F.W. Cornelissen, None

Figures

Figure 1.
Figure 1.
Example of the stimuli used to obtain pRF parameter estimates. (A) LCR stimulus. (B) LCR SS stimulus, this particular example depicts the simulated scotoma SS1. The color of the fixation dot changed between red and green. (C) Scheme of the bar movements: four orientations in two opposing directions. (D, E) Visual stimuli models used during the pRF estimation: SF and FF model.
Figure 2.
Figure 2.
Pipeline of fMRI-based VF reconstruction using MP. First the probe map obtained with MP is converted into a heat map, a step done for every voxel within the cortical visual area of interest (e.g., V1). Next, these heat maps are averaged across all the voxels of that visual area, resulting in a mean VF coverage map. Finally, the reconstructed VF is obtained by dividing the individual normalized coverage map by the average normalized coverage map of all healthy participants, excluding the one in question (normative data).
Figure 3.
Figure 3.
Visual field reconstructions based on retinotopic mapping fMRI data acquired in the presence of simulated scotoma. (A) Representation of the different simulated scotomas. Dark regions correspond to low luminance contrast sensitivity. We used the following simulations: SS1: a central, square-shaped scotoma of 10° × 10°; SS2: a peripheral scotoma with an irregularly shaped central island of approximately 8° diameter, SS3: a nasal/arcuate scotoma; SS4: four scotomas of different shapes: the smallest scotoma had a dimension of 1° × 1° whereas the largest one measured 4° × 4°; SS5: three scotomas with different shapes: the smallest scotoma had a dimension of 1° × 1° whereas the largest one was approximately the size of one quarterfield; SS6: two scotomas: a large one occupying the upper half of the visual field (with macular sparing) and a small one measuring 1 × 2 deg. (B, C) Visual field reconstructions based on V1 data using micro-probing (B) and conventional pRF mapping (B). The correlation between the simulated and reconstructed visual fields is shown in the bottom right corner of each reconstruction. The dashed red line corresponds to the edges of the SS overlaid with the VF reconstruction.
Figure 4.
Figure 4.
Visual field reconstruction in the presence of simulated visual field defects at different levels of the visual cortical hierarchy. Visual field reconstruction based on conventional pRF mapping for V1, V2, and V3. The correlation coefficients (also presented in Table 2) between the reconstructed visual field and the simulated scotoma used are provided in the bottom right corner of the images.
Figure 5.
Figure 5.
Visual field backprojection using simulated visual field defects across the cortical hierarchy using MP. Visual field reconstruction based on MP for V1, V2, and V3. The correlation coefficients (also presented in Table 2) between the reconstructed visual field and simulated scotoma used are presented in the bottom right corner of the images.
Figure 6.
Figure 6.
Visual field reconstruction of simulated scotomas based on data aggregated across V1, V2, and V3. Visual field reconstruction based on MP and conventional pRF (both using FF model) obtained by averaging the V1, V2 and V3 visual field maps. The correlation coefficients (also presented in Table 2) between the reconstructed visual field and the simulated scotoma are presented in the bottom right corner of the images.
Figure 7.
Figure 7.
Visual field reconstruction when including the scotoma into the analysis model (SF). A: Simulated VFD. The two rows below show visual field reconstructions based on V1 data using either MP (A) or pRF mapping (B). The correlation between the simulated and reconstructed visual field are shown in the bottom right corner of each reconstruction.
Figure 8.
Figure 8.
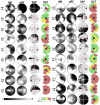
Reconstructed VF using MP and conventional pRF, SAP, and the OCT-derived ganglion cell complex (GCC) thickness for 19 glaucoma participants, for the most affected eye (based on MD—an overall measure that indicates how much a participant deviates from an age-matched normative data set). The red dashed circle denotes the field of view of the fMRI-based approaches (7°). The OCT image covers about 20°. White, green, yellow, and red colors of the OCT maps correspond to the thickest 5%, 90%, thinnest 5% and thinnest 1% of measurements. A shaded gray area corresponds to a disk area outside the central 90% of normal range.
Figure 9.
Figure 9.
Correlation of sampling density measured with fMRI-based techniques and contrast sensitivity loss obtained with SAP. (A and B) The correlation of the sampling density of participants with glaucoma obtained from individual quadrants with contrast sensitivity loss, for MP (A) and pRF (B) techniques, respectively. Each data point is from a separate quadrant of an individual participant with glaucoma. Each color represents the datapoint of each participant. The dashed red line represents the linear fit to the data and the shaded region represents the 95% confidence interval of the fitted parameters. Note that the correlations were obtained using the same visual field area for the fMRI-based visual sampling and the SAP-based contrast sensitivity (a 7° × 7° quadrant adjacent to fixation).

References

    1. Salvetat ML, Zeppieri M, Tosoni C, Parisi L, Brusini P.. Non-conventional perimetric methods in the detection of early glaucomatous functional damage. Eye. 2010; 24(5): 835–842. - PubMed
    1. Johnson CA. Visual fields: visual field test strategies. In: Giaconi J, Law S, Nouri-Mahdavi K, Coleman A, Caprioli J, eds. Pearls of glaucoma management. Heidelberg: Springer-Verlag; 2010: 123–128.
    1. Phu J, Khuu SK, Yapp M, Assaad N, Hennessy MP, Kalloniatis M.. The value of visual field testing in the era of advanced imaging: clinical and psychophysical perspectives. Clin Exp Optom. 2017; 100(4): 313–332. - PMC - PubMed
    1. Montolio FGJ, Junoy Montolio FG, Wesselink C, Gordijn M, Jansonius NM. Factors that influence standard automated perimetry test results in glaucoma: test reliability, technician experience, time of day, and season. Invest Opthalmol Vis Sci. 2012; 53(11): 7010. - PubMed
    1. Castro DPE, Kawase J, Melo LAS Jr.. Learning effect of standard automated perimetry in healthy individuals. Arq Bras Oftalmol. 2008; 71(4): 523–528. - PubMed

Publication types