. 2021 Mar:66:102660.
doi: 10.1016/j.scs.2020.102660. Epub 2020 Dec 15.

The concentration of major air pollutants during the movement control order due to the COVID-19 pandemic in the Klang Valley, Malaysia

Affiliations

The concentration of major air pollutants during the movement control order due to the COVID-19 pandemic in the Klang Valley, Malaysia

Mohd Talib Latif et al. Sustain Cities Soc. 2021 Mar.

Abstract

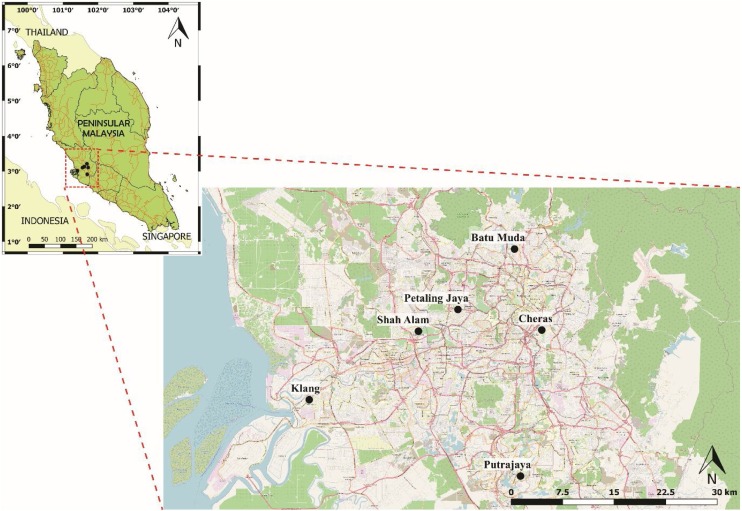
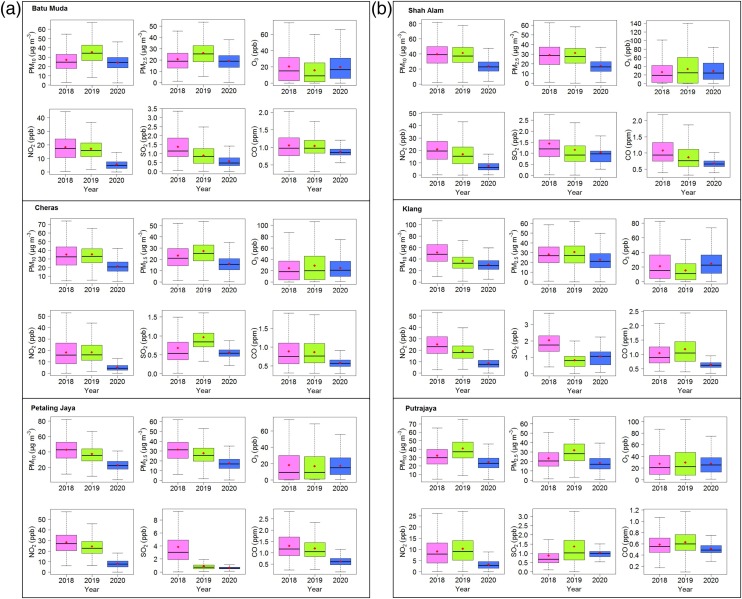
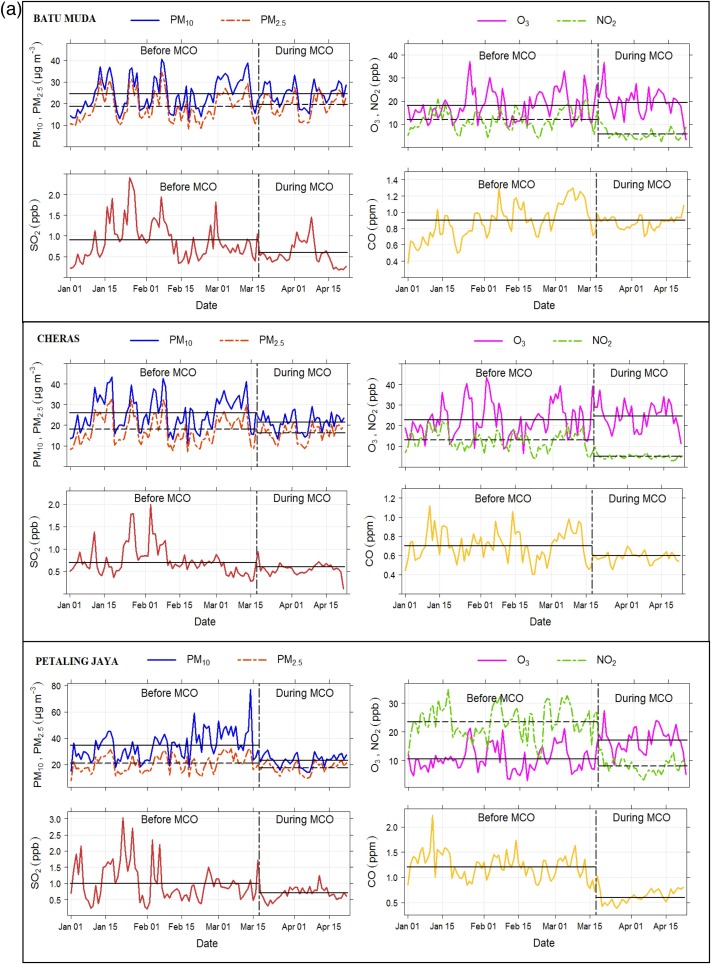
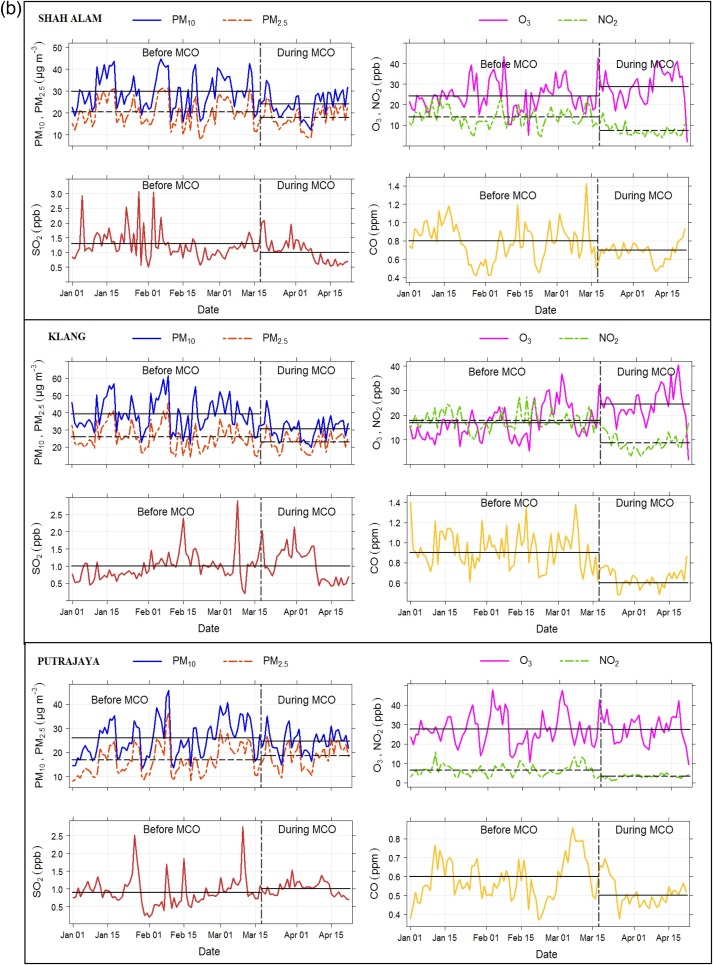
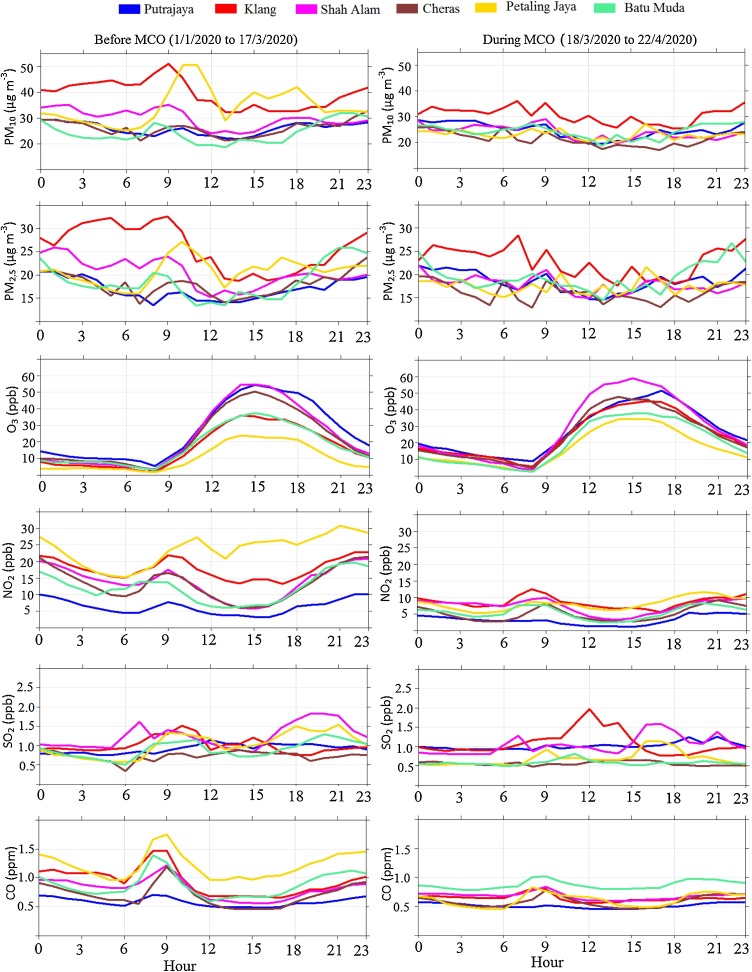
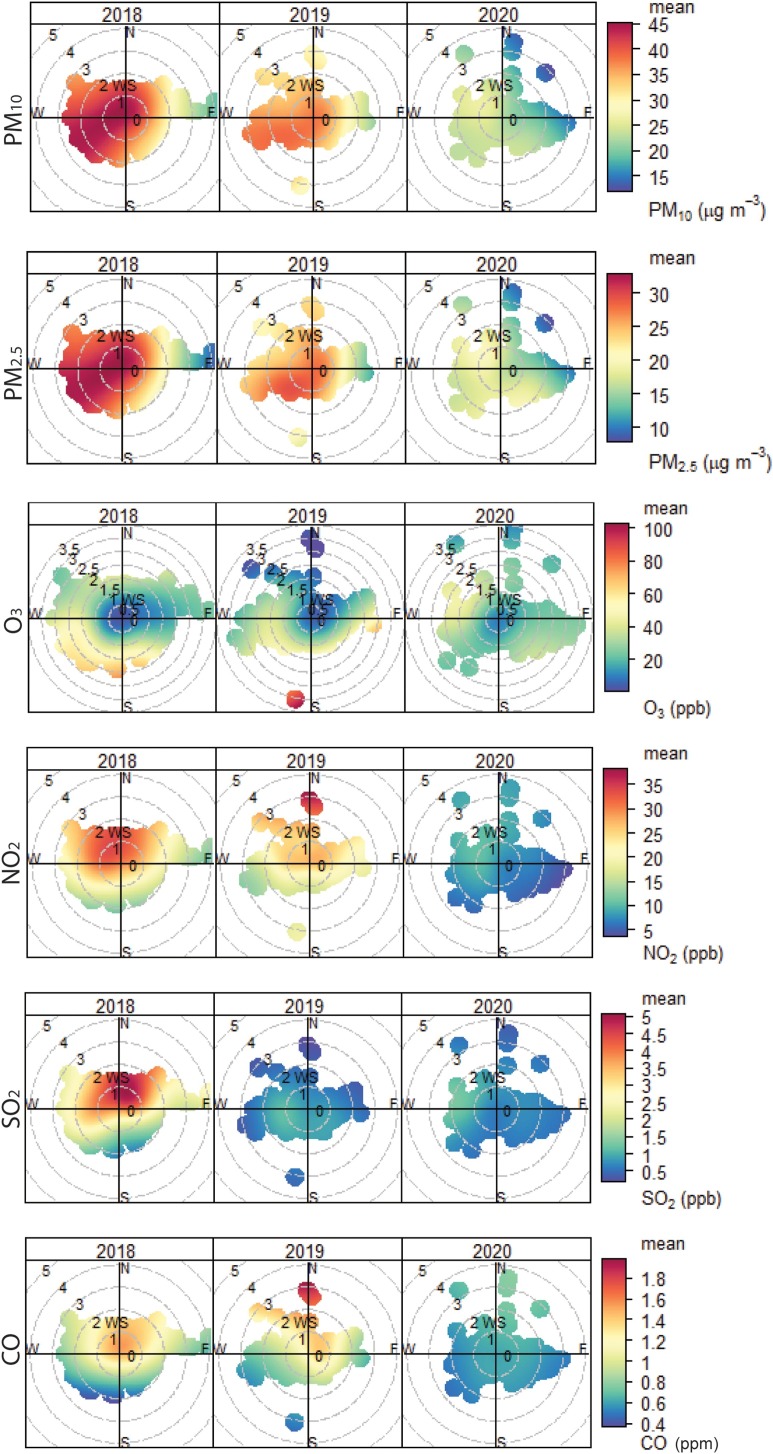
The COVID-19 pandemic forced many governments across the world to implement some form of lockdown to minimalize the spread of the virus. On 18th March 2020, the Malaysian government put into action an enforced movement control order (MCO) to reduce the numbers of infections. This study aims to investigate the concentrations of air pollutants during the MCO in the Klang Valley. The concentrations of air pollutants were recorded by the continuous air quality monitoring system (CAQMS) operated by the Department of Environment. The results showed that there were significant reductions (p < 0.05) of PM10, PM2.5, NO2 and CO during the MCO compared with the same periods in 2019 and 2018. The highest percentage of reduction during the MCO was recorded by NO2 with a percentage reduction of between -55 % and -72 %. O3 concentrations at several stations showed an increase due to the reductions of its precursors such as NO. Further investigation using diurnal patterns of air pollutant concentrations both before and during the MCO showed that NO2 and CO were both reduced significantly during the rush hours, indicating the reduction in motor vehicles on the roads as a consequence of the MCO influenced the levels of these pollutants.

Keywords: Air pollutants; COVID-19; Continuous monitoring; Movement control order.


Conflict of interest statement

The authors declare that they have no known competing financial interests or personal relationships that could have appeared to influence the work reported in this paper.

Figures

Fig. 1
Fig. 1
Location of the sampling stations in the Klang Valley, Malaysia.
Fig. 2
Fig. 2
a) Boxplot for air quality data at Batu Muda, Cheras and Petaling Jaya stations recorded during the Malaysian movement control order (MCO) (18th March 2020 to 22nd April 2020. Air quality data at the same time in 2019 (18th March 2019 to 22nd April 2019) and 2018 (18th March 2018 to 22nd April 2018) are used for comparison. b) Boxplot for air quality data at Shah Alam, Klang and Putrajaya stations recorded during the Malaysian movement control order (MCO) (18th March 2020 to 22nd April 2020). Air quality data at the same time in 2019 (18th March 2019 to 22nd April 2019) and 2018 (18th March 2018 to 22nd April 2018) are used for comparison.
Fig. 3
Fig. 3
(a) Time series of daily average concentration of major air pollutants before MCO (1st January 2020 to 17th March 2020) and during MCO (18th March 2020 to 22nd April 2020) for Batu Muda, Cheras and Petaling Jaya stations. The dashed vertical line is representing the first day of the MCO (18th March 2020). The horizontal line is representing the average value of the air pollutant before MCO and during MCO. (b) Time series of daily average concentration of major air pollutants before MCO (1st January 2020 to 17th March 2020) and during MCO (18th March 2020 to 22nd April 2020) for Shah Alam, Klang and Putrajaya stations. The dashed vertical line is representing the first day of the MCO (18th March 2020). The horizontal line is representing the average value of the air pollutant before MCO and during MCO.
Fig. 3
Fig. 3
(a) Time series of daily average concentration of major air pollutants before MCO (1st January 2020 to 17th March 2020) and during MCO (18th March 2020 to 22nd April 2020) for Batu Muda, Cheras and Petaling Jaya stations. The dashed vertical line is representing the first day of the MCO (18th March 2020). The horizontal line is representing the average value of the air pollutant before MCO and during MCO. (b) Time series of daily average concentration of major air pollutants before MCO (1st January 2020 to 17th March 2020) and during MCO (18th March 2020 to 22nd April 2020) for Shah Alam, Klang and Putrajaya stations. The dashed vertical line is representing the first day of the MCO (18th March 2020). The horizontal line is representing the average value of the air pollutant before MCO and during MCO.
Fig. 4
Fig. 4
Diurnal pattern of major air pollutants before MCO (1st January 2020 to 17th March 2020) and during MCO (18th March 2020 to 22nd April 2020).
Fig. 5
Fig. 5
Bivariate polar plot at Petaling Jaya station during MCO compared to a similar period in 2019 and 2018.
Fig. 6
Fig. 6
Backwards trajectories to Petaling Jaya station during (c) MCO and similar periods in (b) 2019 and (a) 2018.

References

    1. Ahamad F., Latif M.T., Tang R., Juneng L., Dominick D., Juahir H. Variation of surface ozone exceedance around Klang Valley, Malaysia. Atmospheric Research. 2014;61:434–445.
    1. Ash’aari Z.H., Aris A.Z., Ezani E., Kamal N.I.A., Jaafar N., Jahaya J.N., et al. Spatiotemporal variations and contributing factors of air pollutant concentration in Malaysia during movement control order due to the pandemic COVID-19. Aerosol and Air Quality Research. 2020;20:2047–2061.
    1. Azhari A., Latif M.T., Mohamed A.F. Road traffic as an air pollutant contributor within an industrial park environment. Atmospheric Pollution Research. 2018;9:680–687.
    1. Azmi S.Z., Latif M.T., Ismail A.S., Juneng L., Jemain A.A. Trend and status of air quality at three different monitoring stations in the Klang Valley, Malaysia. Air Quality, Atmosphere, & Health. 2010;3:53–64. - PMC - PubMed
    1. Baldasano J.M. COVID-19 lockdown effects on air quality by NO2 in the cities of Barcelona and Madrid (Spain) The Science of the Total Environment. 2020;741:40353. - PubMed

LinkOut - more resources