

Late Side Effects in Normal Mouse Brain Tissue After Proton Irradiation
- PMID: 33520710
- PMCID: PMC7842140
- DOI: 10.3389/fonc.2020.598360
Late Side Effects in Normal Mouse Brain Tissue After Proton Irradiation
Abstract
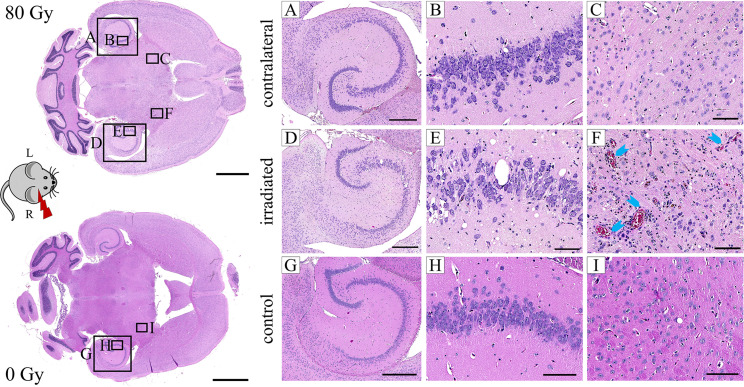
Radiation-induced late side effects such as cognitive decline and normal tissue complications can severely affect quality of life and outcome in long-term survivors of brain tumors. Proton therapy offers a favorable depth-dose deposition with the potential to spare tumor-surrounding normal tissue, thus potentially reducing such side effects. In this study, we describe a preclinical model to reveal underlying biological mechanisms caused by precise high-dose proton irradiation of a brain subvolume. We studied the dose- and time-dependent radiation response of mouse brain tissue, using a high-precision image-guided proton irradiation setup for small animals established at the University Proton Therapy Dresden (UPTD). The right hippocampal area of ten C57BL/6 and ten C3H/He mice was irradiated. Both strains contained four groups (nirradiated = 3, ncontrol = 1) treated with increasing doses (0 Gy, 45 Gy, 65 Gy or 85 Gy and 0 Gy, 40 Gy, 60 Gy or 80 Gy, respectively). Follow-up examinations were performed for up to six months, including longitudinal monitoring of general health status and regular contrast-enhanced magnetic resonance imaging (MRI) of mouse brains. These findings were related to comprehensive histological analysis. In all mice of the highest dose group, first symptoms of blood-brain barrier (BBB) damage appeared one week after irradiation, while a dose-dependent delay in onset was observed for lower doses. MRI contrast agent leakage occurred in the irradiated brain areas and was progressive in the higher dose groups. Mouse health status and survival corresponded to the extent of contrast agent leakage. Histological analysis revealed tissue changes such as vessel abnormalities, gliosis, and granule cell dispersion, which also partly affected the non-irradiated contralateral hippocampus in the higher dose groups. All observed effects depended strongly on the prescribed radiation dose and the outcome, i.e. survival, image changes, and tissue alterations, were very consistent within an experimental dose cohort. The derived dose-response model will determine endpoint-specific dose levels for future experiments and may support generating clinical hypotheses on brain toxicity after proton therapy.
Keywords: blood–brain barrier (BBB); brain irradiation; brain tissue toxicity; late side effects; magnetic resonance imaging (MRI); preclinical mouse model; proton therapy; radiation dose modeling.
Copyright © 2021 Suckert, Beyreuther, Müller, Azadegan, Meinhardt, Raschke, Bodenstein, von Neubeck, Lühr, Krause and Dietrich.
Conflict of interest statement
The authors declare that the research was conducted in the absence of any commercial or financial relationships that could be construed as a potential conflict of interest.
Figures


Similar articles
-
High-precision image-guided proton irradiation of mouse brain sub-volumes.Radiother Oncol. 2020 May;146:205-212. doi: 10.1016/j.radonc.2020.02.023. Epub 2020 Mar 26. Radiother Oncol. 2020. PMID: 32222488
-
Half brain irradiation in a murine model of breast cancer brain metastasis: magnetic resonance imaging and histological assessments of dose-response.Radiat Oncol. 2018 Jun 1;13(1):104. doi: 10.1186/s13014-018-1028-8. Radiat Oncol. 2018. PMID: 29859114 Free PMC article.
-
Dose-response relationship for late functional changes in the rat brain after radiosurgery evaluated by magnetic resonance imaging.Int J Radiat Oncol Biol Phys. 1997 Dec 1;39(5):1163-72. doi: 10.1016/s0360-3016(97)00387-8. Int J Radiat Oncol Biol Phys. 1997. PMID: 9392559
-
Radiation therapy in the multimodal treatment approach of pituitary adenoma.Strahlenther Onkol. 2002 Apr;178(4):173-86. doi: 10.1007/s00066-002-0826-x. Strahlenther Onkol. 2002. PMID: 12040754 Review.
-
Normal tissue complications from low-dose proton therapy.Health Phys. 2012 Nov;103(5):586-9. doi: 10.1097/HP.0b013e3182611114. Health Phys. 2012. PMID: 23032888 Review.
Cited by
-
Cell-specific analysis of microglia following partial brain proton irradiation in mice.Clin Transl Radiat Oncol. 2025 Jun 27;54:101003. doi: 10.1016/j.ctro.2025.101003. eCollection 2025 Sep. Clin Transl Radiat Oncol. 2025. PMID: 40687733 Free PMC article.
-
Neurotoxicity from Old and New Radiation Treatments for Brain Tumors.Int J Mol Sci. 2023 Jun 26;24(13):10669. doi: 10.3390/ijms241310669. Int J Mol Sci. 2023. PMID: 37445846 Free PMC article. Review.
-
Radiation-induced changes of reactive astrocyte distribution in mice as a late response to partial-brain proton irradiation.Acta Oncol. 2025 Jul 23;64:902-908. doi: 10.2340/1651-226X.2025.44056. Acta Oncol. 2025. PMID: 40697178 Free PMC article.
-
Models for Translational Proton Radiobiology-From Bench to Bedside and Back.Cancers (Basel). 2021 Aug 22;13(16):4216. doi: 10.3390/cancers13164216. Cancers (Basel). 2021. PMID: 34439370 Free PMC article. Review.
-
In vivo modeling recapitulates radiotherapy delivery and late-effect profile for childhood medulloblastoma.Neurooncol Adv. 2024 Jun 6;6(1):vdae091. doi: 10.1093/noajnl/vdae091. eCollection 2024 Jan-Dec. Neurooncol Adv. 2024. PMID: 38946880 Free PMC article.
References
-
- Cancer burden statistics and trends across Europe | ECIS . Available at: https://ecis.jrc.ec.europa.eu/index.php (Accessed August 12, 2020).
LinkOut - more resources
Full Text Sources
Other Literature Sources