. 2021 Jan 15:8:617548.
doi: 10.3389/fped.2020.617548. eCollection 2020.

Changes of Structural Brain Network Following Repetitive Transcranial Magnetic Stimulation in Children With Bilateral Spastic Cerebral Palsy: A Diffusion Tensor Imaging Study

Affiliations

Changes of Structural Brain Network Following Repetitive Transcranial Magnetic Stimulation in Children With Bilateral Spastic Cerebral Palsy: A Diffusion Tensor Imaging Study

Wenxin Zhang et al. Front Pediatr. .

Abstract

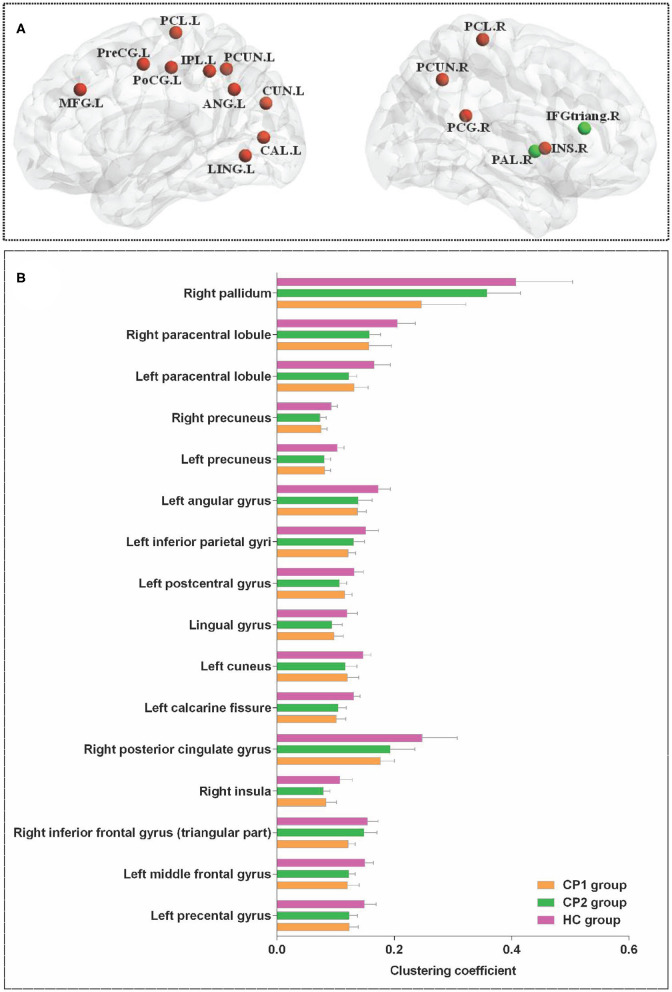
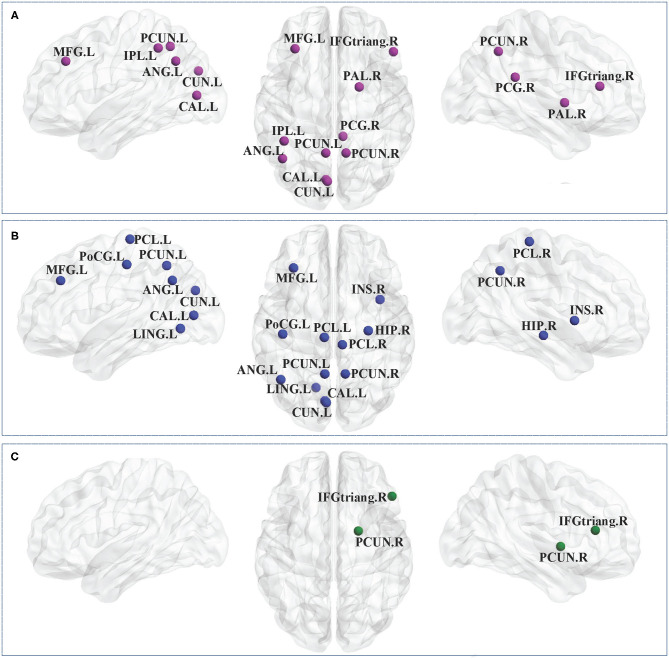
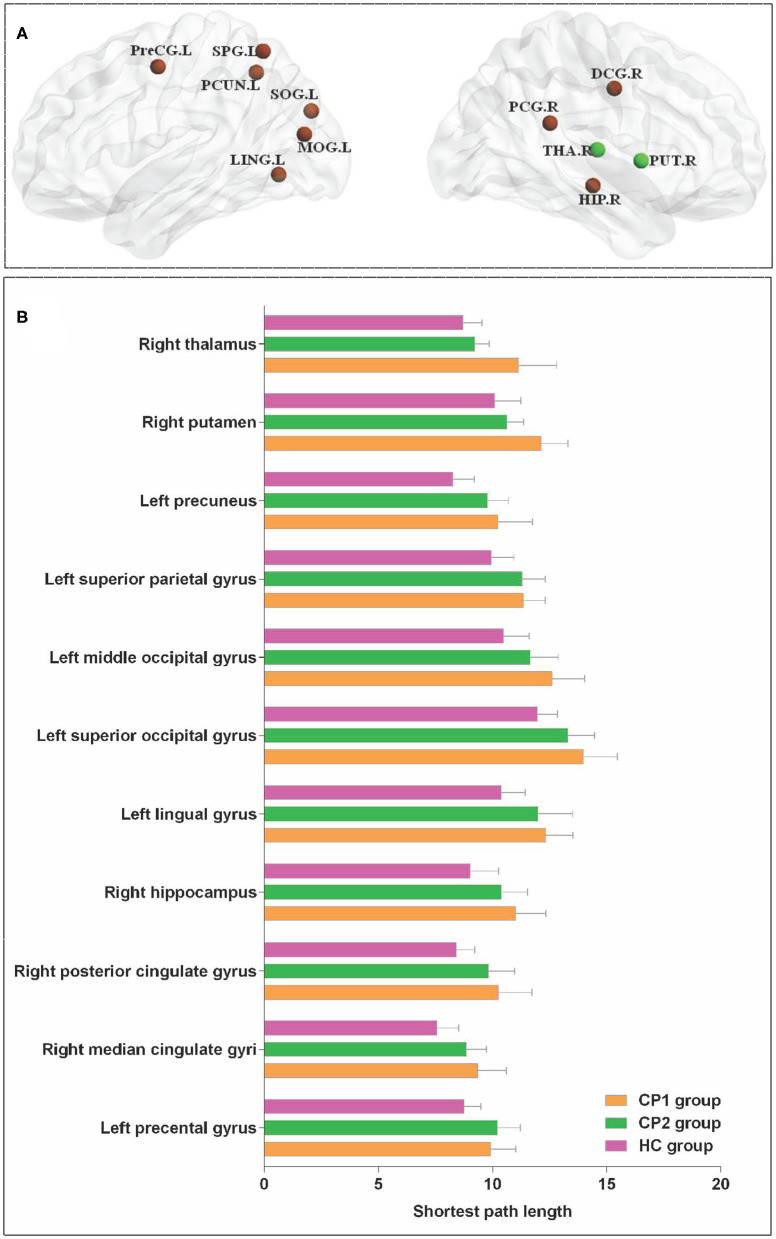
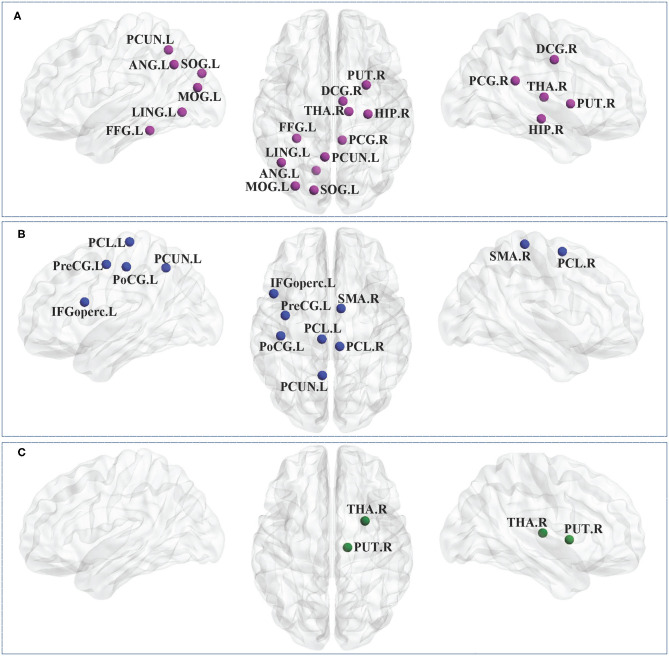
Introduction: Bilateral spastic cerebral palsy (BSCP) is the most common subtype of cerebral palsy (CP), which is characterized by various motor and cognitive impairments, as well as emotional instability. However, the neural basis of these problems and how repetitive transcranial magnetic stimulation (rTMS) can make potential impacts on the disrupted structural brain network in BSCP remain unclear. This study was aimed to explore the topological characteristics of the structural brain network in BSCP following the treatment of rTMS. Methods: Fourteen children with BSCP underwent 4 weeks of TMS and 15 matched healthy children (HC) were enrolled. Diffusion tensor imaging (DTI) data were acquired from children with bilateral spastic cerebral palsy before treatment (CP1), children with bilateral spastic cerebral palsy following treatment (CP2) and HC. The graph theory analysis was applied to construct the structural brain network. Then nodal clustering coefficient (C i ) and shortest path length (L i ) were measured and compared among groups. Results: Brain regions with significant group differences in C i were located in the left precental gyrus, middle frontal gyrus, calcarine fissure, cuneus, lingual gyrus, postcentral gyrus, inferior parietal gyri, angular gyrus, precuneus, paracentral lobule and the right inferior frontal gyrus (triangular part), insula, posterior cingulate gyrus, precuneus, paracentral lobule, pallidum. In addition, significant differences were detected in the L i of the left precental gyrus, lingual gyrus, superior occipital gyrus, middle occipital gyrus, superior parietal gyrus, precuneus and the right median cingulate gyrus, posterior cingulate gyrus, hippocampus, putamen, thalamus. Post hoc t-test revealed that the CP2 group exhibited increased C i in the right inferior frontal gyrus, pallidum and decreased L i in the right putamen, thalamus when compared with the CP1 group. Conclusion: Significant differences of node-level metrics were found in various brain regions of BSCP, which indicated a disruption in structural brain connectivity in BSCP. The alterations of the structural brain network provided a basis for understanding of the pathophysiological mechanisms of motor and cognitive impairments in BSCP. Moreover, the right inferior frontal gyrus, putamen, thalamus could potentially be biomarkers for predicting the efficacy of TMS.

Keywords: cerebral palsy; diffusion tensor imaging; graph theory; repetitive transcranial magnetic stimulation; structural brain network.


Conflict of interest statement

The authors declare that the research was conducted in the absence of any commercial or financial relationships that could be construed as a potential conflict of interest.

Figures

Figure 1
Figure 1
Brain regions with significant group effects in the nodal clustering coefficient among the three groups (ANOVA; FDR-corrected P < 0.05). CP1, children with bilateral spastic cerebral palsy before treatment; CP2,children with bilateral spastic cerebral palsy following treatment; HC, health children. (A) Brain regions with significant group differences; (B) statistical comparisons among the three groups. ANOVA: one-way analysis of variance. FDR: false discovery rate. FDR-corrected P < 0.05 indicated statistically significant differences among the three groups.
Figure 2
Figure 2
Brain regions with significant group effects in the nodal clustering coefficient between the CP1, CP2, and HC groups (post hoc t-test; FDR-corrected P < 0.05). CP1, children with bilateral spastic cerebral palsy before treatment; CP2, children with bilateral spastic cerebral palsy following treatment; HC, health children. (A) Statistical comparisons between CP1 and HC; (B) statistical comparisons between CP2 and HC; (C) statistical comparisons between CP1 and CP2. FDR, false discovery rate. FDR-corrected P < 0.05 indicated statistically significant differences between groups.
Figure 3
Figure 3
Brain regions with significant group effects in the nodal path length among the three groups (ANOVA; FDR-corrected P < 0.05). CP1, children with bilateral spastic cerebral palsy before treatment; CP2, children with bilateral spastic cerebral palsy following treatment; HC, health children. (A) Brain regions with significant group differences; (B) statistical comparisons among the three groups. ANOVA: one-way analysis of variance. FDR, false discovery rate. FDR-corrected P < 0.05 indicated statistically significant differences among the three groups.
Figure 4
Figure 4
Brain regions with significant group effects in the nodal path length between the CP1, CP2, and HC groups (post hoc t-test; FDR-corrected P < 0.05). CP1, children with bilateral spastic cerebral palsy before treatment; CP2, children with bilateral spastic cerebral palsy following treatment; HC, health children. (A) Statistical comparisons between CP1 and HC; (B) statistical comparisons between CP2 and HC; (C) statistical comparisons between CP1 and CP2. FDR, false discovery rate. FDR-corrected P < 0.05 indicated statistically significant differences between groups.

Similar articles

Cited by

References

    1. Van Naarden Braun K, Doernberg N, Schieve L, Christensen D, Goodman A, Yeargin-Allsopp M. Birth prevalence of cerebral palsy: a population-based study. Pediatrics. (2016) 137:1–9. 10.1542/peds.2015-2872 - DOI - PMC - PubMed
    1. Sellier E, Platt MJ, Andersen GL, I Krägeloh-Mann, De La Cruz J, Cans C. Decreasing prevalence in cerebral palsy: a multi-site European population-based study, 1980 to 2003. Dev Med Child Neurol. (2016) 58:85–92. 10.1111/dmcn.12865 - DOI - PubMed
    1. Gómez-Pérez C, JM Font-Llagunes, Martori JC, Vidal Samsó J. Gait parameters in children with bilateral spastic cerebral palsy: a systematic review of randomized controlled trials. Dev Med Child Neurol. (2019) 61:770–82. 10.1111/dmcn.14108 - DOI - PubMed
    1. Noble JJ, Gough M, Shortland AP. Selective motor control and gross motor function in bilateral spastic cerebral palsy. Dev Med Child Neurol. (2019) 61:57–61. 10.1111/dmcn.14024 - DOI - PubMed
    1. Papadelis C, Kaye H, Shore B, Snyder B, Grant PE, Rotenberg A. Maturation of corticospinal tracts in children with hemiplegic cerebral palsy assessed by diffusion tensor imaging and transcranial magnetic stimulation. Front Hum Neurosci. (2019) 13:254. 10.3389/fnhum.2019.00254 - DOI - PMC - PubMed

LinkOut - more resources