. 2021 Jan 12:8:559693.
doi: 10.3389/fpubh.2020.559693. eCollection 2020.

Mathematical Modeling Predicts That Strict Social Distancing Measures Would Be Needed to Shorten the Duration of Waves of COVID-19 Infections in Vietnam

Affiliations

Mathematical Modeling Predicts That Strict Social Distancing Measures Would Be Needed to Shorten the Duration of Waves of COVID-19 Infections in Vietnam

Anass Bouchnita et al. Front Public Health. .

Abstract

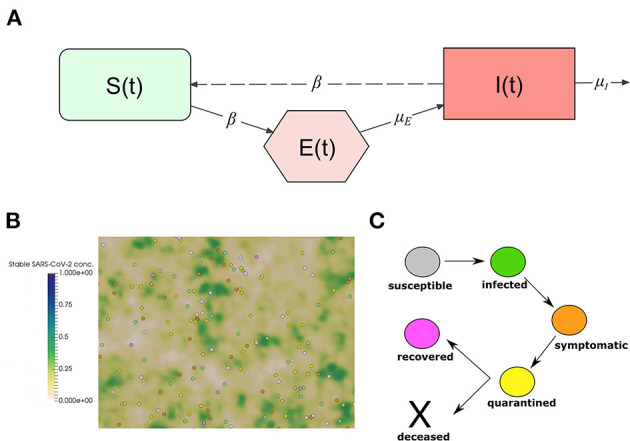
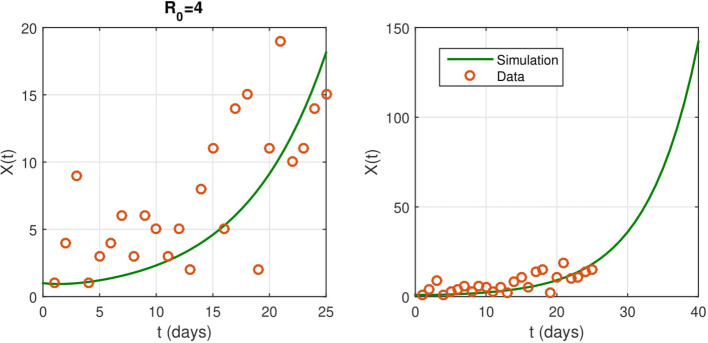
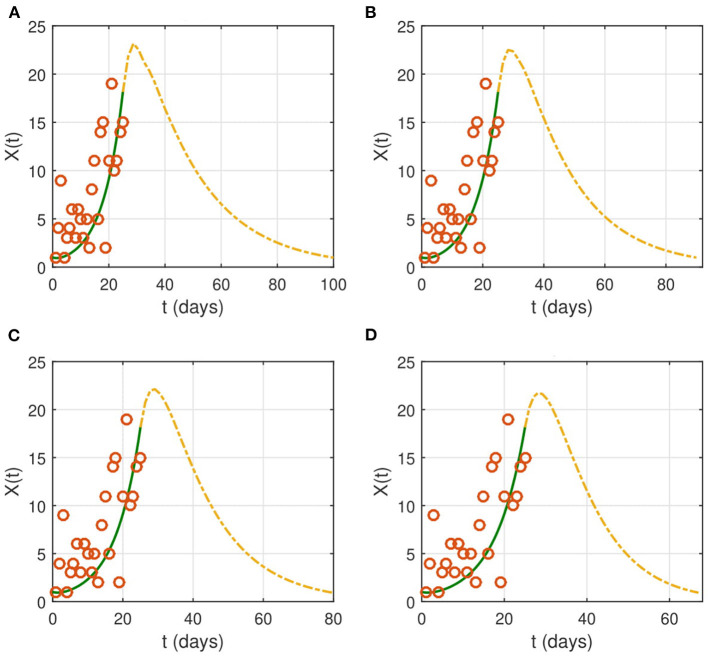
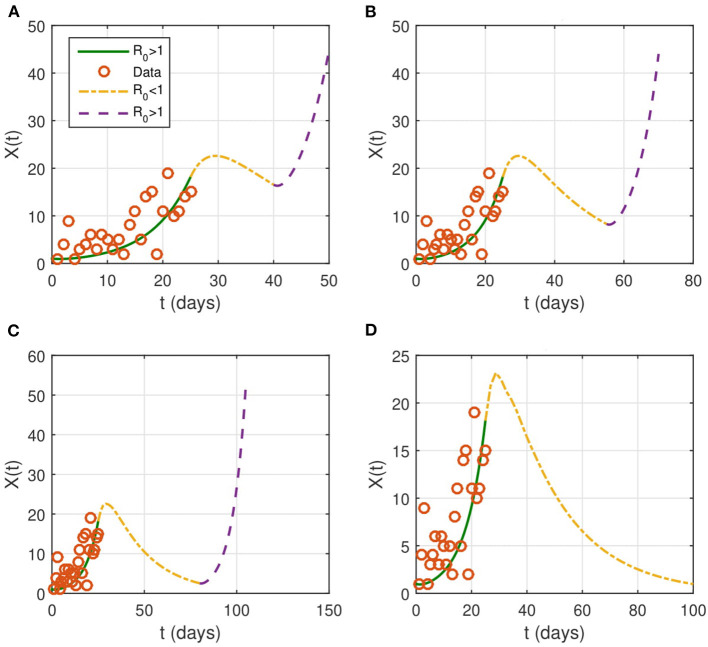
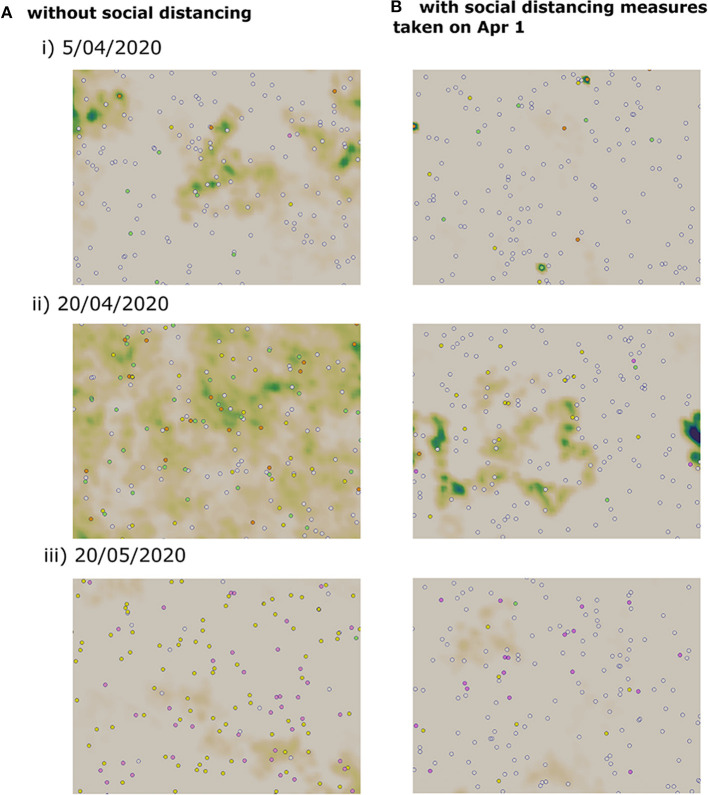
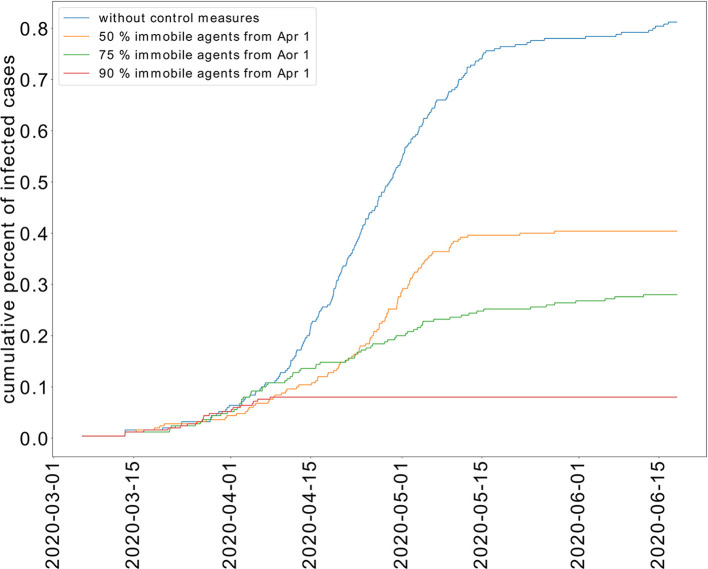
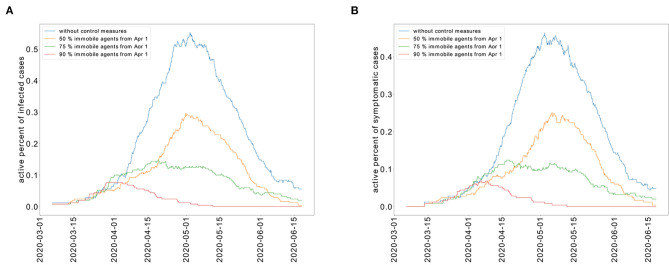
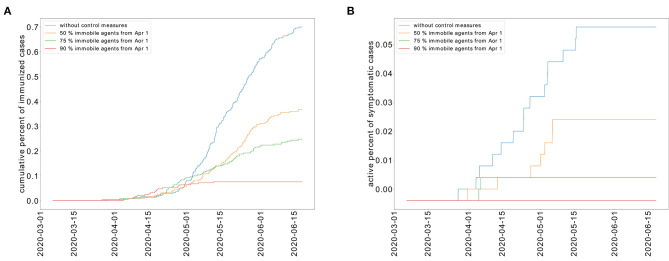
Coronavirus disease 2019 (COVID-19) emerged in Wuhan, China in 2019, has spread throughout the world and has since then been declared a pandemic. As a result, COVID-19 has caused a major threat to global public health. In this paper, we use mathematical modeling to analyze the reported data of COVID-19 cases in Vietnam and study the impact of non-pharmaceutical interventions. To achieve this, two models are used to describe the transmission dynamics of COVID-19. The first model belongs to the susceptible-exposed-infectious-recovered (SEIR) type and is used to compute the basic reproduction number. The second model adopts a multi-scale approach which explicitly integrates the movement of each individual. Numerical simulations are conducted to quantify the effects of social distancing measures on the spread of COVID-19 in urban areas of Vietnam. Both models show that the adoption of relaxed social distancing measures reduces the number of infected cases but does not shorten the duration of the epidemic waves. Whereas, more strict measures would lead to the containment of each epidemic wave in one and a half months.

Keywords: COVID-19; SARS-CoV-2; basic reproduction number; epidemic model; multi-scale modeling.


Conflict of interest statement

The authors declare that the research was conducted in the absence of any commercial or financial relationships that could be construed as a potential conflict of interest.

Figures

Figure 1
Figure 1
(A) Interactions between the compartments of the epidemiological model (1). The continuous lines represent transition between compartments, and entrance and exit of individuals. The dashed line represents the transmission of the infection through the interaction between susceptible and infected individuals. (B) Snapshot of a numerical simulation of the model. Spheres represent individual people moving in a square section of 250 ×250 m. The color of each individual represents the class to which it belongs: white for susceptible, green for infected, orange for symptomatic, yellow for quarantined, and pink for recovered. The concentration of stable SARS-CoV-2 on surfaces is represented using the gradient of the green color. (C) The clinical course of COVID-19 patients in the model.
Figure 2
Figure 2
(Left) The fitted curve for epidemic evolution, with ε = 0.08. The small red circles are the reported case data. (Right) an illustrations of the shape of X(t) without any intervention. It predicts the spread of the epidemic.
Figure 3
Figure 3
The effect of NPIs on the evolution of the identification function X(t). Lockdown starts on from April 1, 2020 (t = 26). We choose the following values for the contact rate: (A) βnew = 0.1 × β, (B) βnew = 0.08 × β, (C) βnew = 0.05 × β, and (D) βnew = 0.001 × β. The time interval of the X-axis represents the duration of the epidemic. The red circles represent the data for the number of reported cases.
Figure 4
Figure 4
Evolution of the identified infected population of X(t). NPIs are considered from April 1 (t = 26), with βnew = 0.1 × β and last for a duration T. We take several intervention's duration: (A) T = 15 days, (B) T = 30 days, (C) T = 45 days, and (D) T = 75 days. The red circles represent the data for the number of reported cases.
Figure 5
Figure 5
Snapshots of numerical simulations showing the effect of social distancing on the transmission dynamics of COVID-19 in three different dates. (A) Without social distancing measures. (B) With a partial lockdown which targets 75% of the population.
Figure 6
Figure 6
Effect of limited movement of the population on the cumulative percent of infected individuals.
Figure 7
Figure 7
Restricted population movement flattens the epidemic curve for the active percent of infected individuals (A) and symptomatic individuals (B).
Figure 8
Figure 8
Cumulative percent of recovered individuals (A) and deceased patients (B) for different levels of restricted movement.

Similar articles

Cited by

References

    1. Bouchnita A, Jebrane A. A hybrid multi-scale model of COVID-19 transmission dynamics to assess the potential of non-pharmaceutical interventions. Chaos Solit Fract. (2020) 138:109941. 10.1016/j.chaos.2020.109941 - DOI - PMC - PubMed
    1. Bouchnita A, Jebrane A. A multi-scale model quantifies the impact of limited movement of the population and mandatory wearing of face masks in containing the COVID-19 epidemic in Morocco. Math Model Nat Phenom. (2020) 15:13 10.1051/mmnp/2020016 - DOI
    1. Jia J, Ding J, Liu S, Liao G, Li J, Duan B, et al. Modeling the control of COVID-19: impact of policy interventions and meteorological factors. arXiv. (2020) 200302985.
    1. Volpert V, Banerjee M, Petrovskii S. On a quarantine model of coronavirus infection and data analysis. Math Model Nat Phenom. (2020) 15:24 10.1051/mmnp/2020006 - DOI
    1. Kuniya T. Prediction of the epidemic peak of coronavirus disease in Japan, 2020. J Clin Med. (2020) 9:789. 10.3390/jcm9030789 - DOI - PMC - PubMed

Publication types