. 2021 Feb:32:100718.
doi: 10.1016/j.eclinm.2020.100718. Epub 2021 Jan 7.

Local measures enable COVID-19 containment with fewer restrictions due to cooperative effects

Affiliations

Local measures enable COVID-19 containment with fewer restrictions due to cooperative effects

Philip Bittihn et al. EClinicalMedicine. 2021 Feb.

Abstract

Background: Many countries worldwide are faced with the choice between the (re)surgence of COVID-19 and endangering the economic and mental well-being of their citizens. While infection numbers are monitored and measures adjusted, a systematic strategy for balancing contact restrictions and socioeconomic life in the absence of a vaccine is currently lacking.

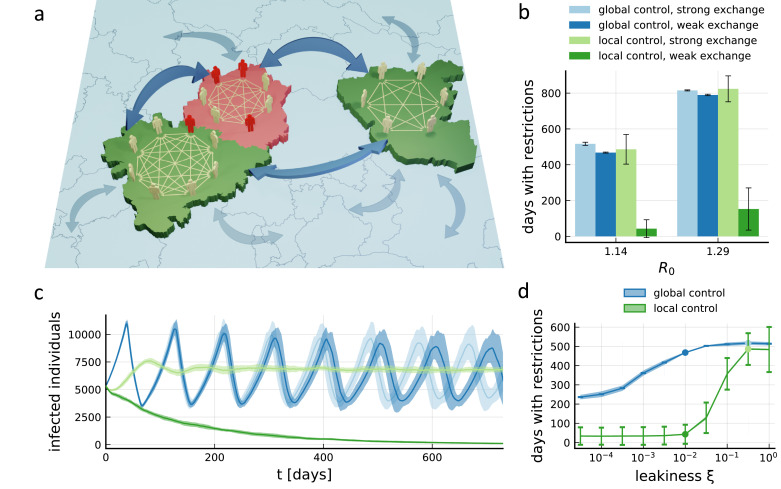
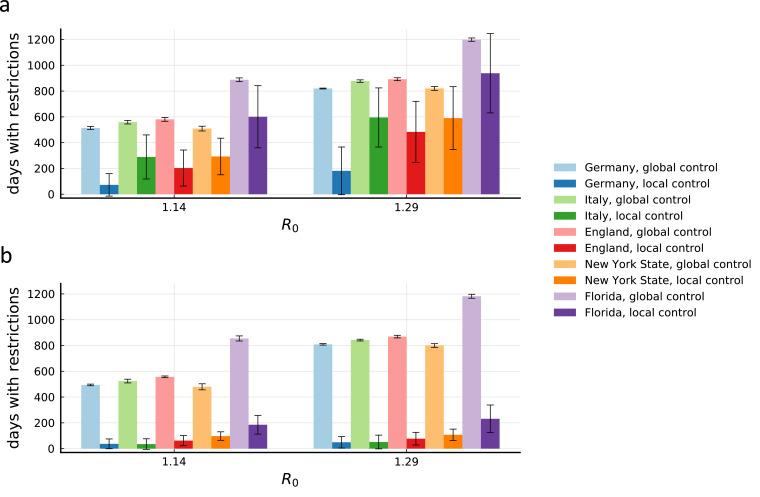
Methods: In a mathematical model, we determine the efficacy of regional containment strategies, where contact restrictions are triggered locally in individual regions upon crossing critical infection number thresholds. Our stochastic meta-population model distinguishes between contacts within a region and cross-regional contacts. We use current data on the spread of COVID-19 in Germany, Italy, England, New York State and Florida, including the effects of their individual national lockdowns, and county population sizes obtained from census data to define individual regions. As a performance measure, we determine the number of days citizens will experience contact restrictions over the next 5 years ('restriction time') and compare it to an equivalent national lockdown strategy. To extract crucial parameters, we vary the proportion of cross-regional contacts (between 0% and 100%), the thresholds for initiating local measures (between 5 and 20 active infections per 100,000 inhabitants) as well as their duration after infection numbers have returned below the threshold (between 7 and 28 days). We compare performance across the five different countries and test how further subdivision of large counties into independently controlled regions of up to 100,000 or 200,000 inhabitants affects the results.

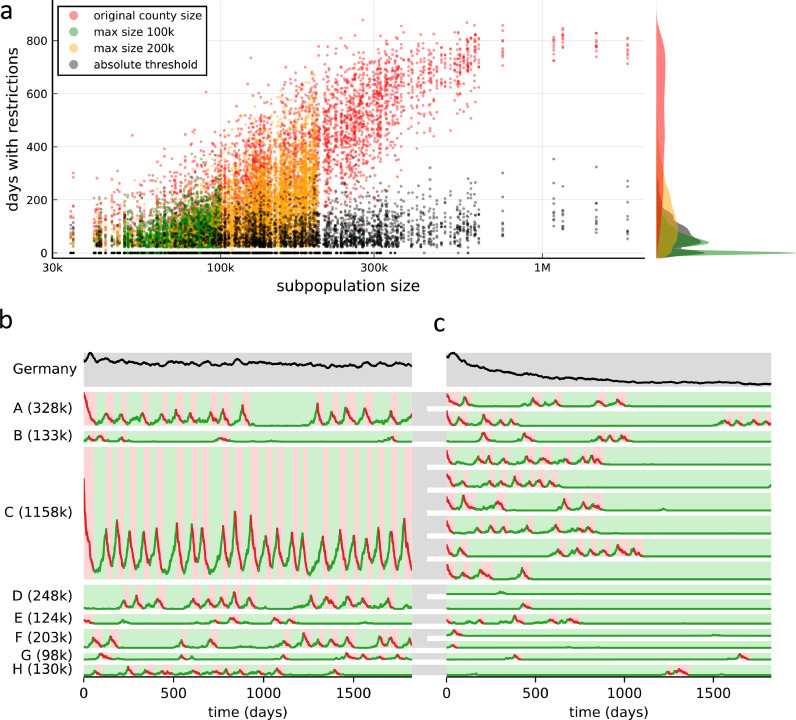
Findings: Our numerical simulations show a substantially reduced restriction time for regional containment, if the effective reproduction number of SARS-CoV-2 without restrictions, R 0, is only slightly larger than 1 and the proportion of cross-regional contacts (the so-called leakiness) is low. In Germany, specifically, for R 0=1.14, a leakiness of 1% is sufficiently low to reduce the mean restriction time from 468 days (s.d. 3 days) for the national containment strategy to 43 days (s.d. 3 days across simulations) for the regional strategy, when local measures are initiated at 10 infections per 100,000 inhabitants in the past 7 days. For R 0=1.28, the allowed leakiness for minimal restriction time reduces to approximately 0.3%. The dependence of the restriction time on the leakiness is threshold-like only for regional containment, due to cooperative effects. It rises to levels similar to the national containment strategy for a leakiness > 10% (517 days national vs. 486 days regional for leakiness 32% and R 0=1.14). We find a strong correlation between the population size of each region and the experienced restriction time. For countries with large counties, this can result in only a mild reduction in restriction time for regional containment, which can only be partly compensated by lower thresholds for initiating local measures and increasing their duration. In contrast, further subdividing large counties into smaller units can ensure a strong reduction of the restriction time for the regional strategy.

Interpretation: The leakiness, i.e. the proportion of cross-regional contacts, and the regional structure itself were crucial parameters for the performance of the regional strategy. Therefore, regional strategies could offer an adaptive way to contain the epidemic with fewer overall restrictions, if cross-regional infections can be kept below the critical level, which could be achieved without affecting local socioeconomic freedom. Maintaining general hygiene and contact tracing, testing should be intensified to ensure regional measures can be initiated at low infection thresholds, preventing the spread of the disease to other regions before local elimination. While such tight control could lead to more restrictions in the short run, restrictions necessary for long-term containment could be reduced by up to a factor of 10. Our open-source simulation code is freely available and can be readily adapted to other countries.

Funding: This work was supported by the Max Planck Society.

Keywords: COVID-19; Containment strategies; Epidemic modeling.


Conflict of interest statement

The authors have nothing to disclose.

Figures

Fig 1
Fig. 1
Freedom from restrictions through local containment measures. (a) Illustration of core model ingredients: Individuals have contacts with random individuals inside their local sub-population (small arrows), which is defined, e.g., by a county. A certain proportion of contacts takes place across sub-population boundaries with random individuals from the whole population (large arrows). This leakiness ξ is defined such that the total number of contacts an individual has per unit time is a ξ-independent constant, which determines the reproductive number R0. If the number of infected individuals (red) in a sub-population exceeds a certain threshold, the sub-population enters a temporary local lockdown that lowers R0 and infection numbers can decline (red county). A precise model definition is available in the Supplementary Information. (b) Number of days the average person in the population will have to spend in lockdowns within the next 5 years, using the county structure and current active case numbers from Germany, with counties further split up into sub-populations of a maximum population of 200,000 (see Figs. 2, 3 for details). Numbers are shown for high (ξ = 32%) or low (ξ = 1%) leakiness between sub-populations, and for the local containment strategy outlined in panel a or an analogous population-wide (‘global’) strategy, τsafety = 21 days, θ = 10:100,000. The four cases are shown for two different values of R0. Error bars indicate total standard deviation across members of all populations in 20 realizations. (c) Time evolution in the first two years of the total number of infected individuals in the entire population for the four cases shown in panel b for the lower value of R0. Shading indicates standard deviation across 20 realizations. (d) Restriction time for the full spectrum of leakiness values. The four cases shown in panels b and c (lower value of R0) are marked by dots of the same color. See Supp. Figs. 3, 5, 6, 7, 8, 9, 10 for additional parameters and detailed results for other countries. Error bars indicate standard deviation across members of the population in a single simulation (averaged across 20 realizations), shading around lines indicates standard deviation of the average across realizations. (For interpretation of the references to color in this figure legend, the reader is referred to the web version of this article.)
Fig 2
Fig. 2
Relative lockdown thresholds cause persistence of the disease in densely populated areas. (a) Number of days individual sub-populations have to activate severe restrictions because of local outbreaks, plotted against their corresponding size, in simulations of the epidemic over the next 5 years. Scatter plot shows data from 10 realizations of the stochastic dynamics each, for the original German county sizes (red) and further subdivided counties until sub-population sizes of a maximum of 200,000 (yellow) and 100,000 (green) are achieved, all for the same relative lockdown threshold of θ = 10:100,000. Data for an absolute lockdown threshold of 10 infected individuals for every sub-population regardless of its size is shown in black. The marginal distributions of the time spent under local lockdowns for individuals across the entire population are displayed on the right-hand side using the same colors. Remaining parameters: R0 = 1.29, ξ = 1%, τsafety = 21 days. (b) Dynamics of infection numbers for the case of original county sizes (red data points in panel a) in the first 5 years. Infection numbers in the total German population are shown in the top row. The lower rows show the dynamics in a number of sample counties A-H, with the population size shown in parentheses. Red shading indicates periods with lockdown, green shading indicates no lockdown. (c) Dynamics in a simulation with large counties further split into equally sized populations, such that the maximum sub-population size is 200,000 (yellow data points in panel a). Otherwise, parameters are identical to those in panel b. Gray areas connecting panels b and c indicate the split-up. (For interpretation of the references to color in this figure legend, the reader is referred to the web version of this article.)
Fig 3
Fig. 3
Different county structures lead to varying effectiveness of local measures between countries. (a) Days with restrictions for the average person for tight global or local control for all five countries included in the analysis with their respective Rl during lockdown (see Supp. Fig. 2). Parameters represent a control strategy with θ = 5:100,000, τsafety = 28 days, a leakiness of ξ = 1% and no further subdivision of the counties. For countries with large county sizes, local measures are less effective in bringing down the duration of restrictions required. Error bars indicate total standard deviation across members of all populations in 20 realizations. (b) Same as in panel a, but for a further subdivision of the counties into sub-populations with a maximum population of 200,000 individuals.

Similar articles

Cited by

References

    1. Dong E., Du H., Gardner L. An interactive web-based dashboard to track COVID-19 in real time. Lancet Infect Dis. 2020;20:533–534. http://www.sciencedirect.com/science/article/pii/S1473309920301201 - PMC - PubMed
    1. World Health Organization, 72th WHO situation report on COVID-19, Subject in Focus: Public Health and Social Measures (2020). URL https://www.who.int/docs/default-source/coronaviruse/situation-reports/2....
    1. Anderson R.M., Heesterbeek H., Klinkenberg D., Hollingsworth T.D. How will country-based mitigation measures influence the course of the COVID-19 epidemic? The Lancet. 2020;395:931–934. - PMC - PubMed
    1. Wilder-Smith A., Freedman D.O. Isolation, quarantine, social distancing and community containment: pivotal role for old-style public health measures in the novel coronavirus (2019-nCoV) outbreak. J Travel Med. 2020;27 - PMC - PubMed
    1. Liu X. et al. Modelling the Situation of COVID-19 and Effects of Different Containment Strategies in China with Dynamic Differential Equations and Parameters Estimation. The Lancet Preprint Server THELANCET–D–20–03242 (2020).