

Real-life validation of the Panbio™ COVID-19 antigen rapid test (Abbott) in community-dwelling subjects with symptoms of potential SARS-CoV-2 infection
- PMID: 33521610
- PMCID: PMC7832943
- DOI: 10.1016/j.eclinm.2020.100677
Real-life validation of the Panbio™ COVID-19 antigen rapid test (Abbott) in community-dwelling subjects with symptoms of potential SARS-CoV-2 infection
Abstract
Background: RT-qPCR is the reference test for identification of active SARS-CoV-2 infection, but is associated with diagnostic delay. Antigen detection assays can generate results within 20 min and outside of laboratory settings. Yet, their diagnostic test performance in real life settings has not been determined.
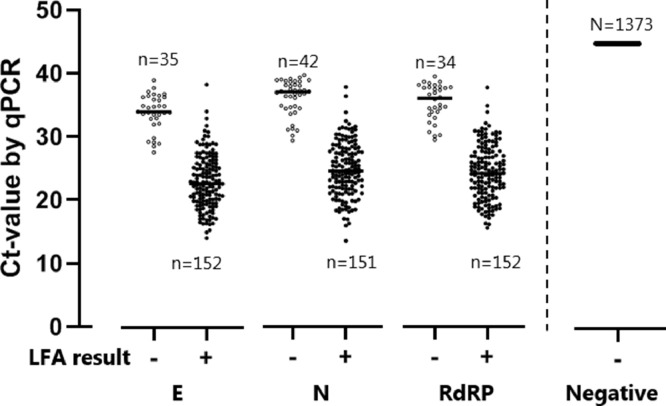
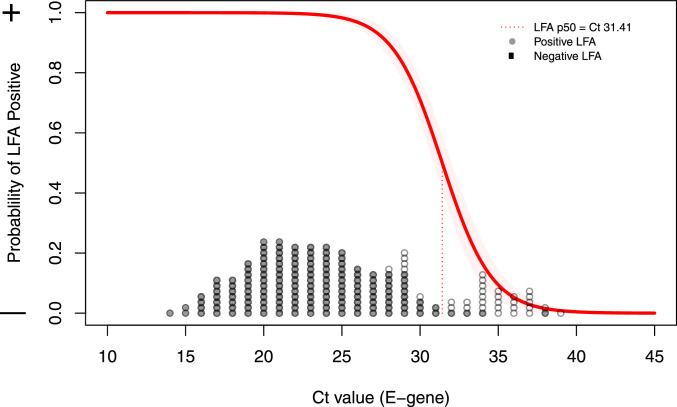
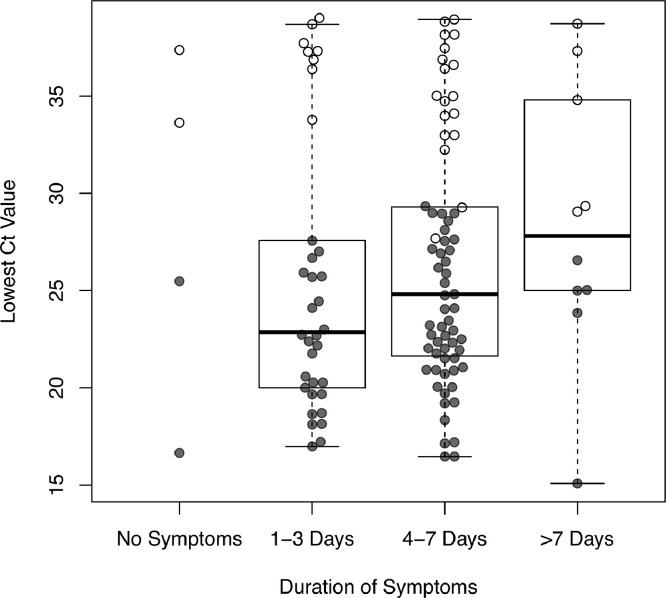
Methods: The diagnostic value of the Panbio™ COVID-19 Ag Rapid Test (Abbott), was determined in comparison to RT-qPCR (Seegene Allplex) in community-dwelling mildly symptomatic subjects in a medium (Utrecht, the Netherlands) and high endemic area (Aruba), using two concurrently obtained nasopharyngeal swabs.Findings: 1367 and 208 subjects were enrolled in Utrecht and Aruba, respectively. SARS-CoV-2 prevalence, based on RT-qPCR, was 10.2% (n = 139) and 30.3% (n = 63) in Utrecht and Aruba respectively. Specificity of the Panbio™ COVID-19 Ag Rapid Test was 100% (95%CI: 99.7-100%) in both settings. Test sensitivity was 72.6% (95%CI: 64.5-79.9%) in the Netherlands and 81.0% (95% CI: 69.0-89.8%) in Aruba. Probability of false negative results was associated with RT-qPCR Ct-values, but not with duration of symptoms. Restricting RT-qPCR test positivity to Ct-values <32 yielded test sensitivities of 95.2% (95%CI: 89.3-98.5%) in Utrecht and 98.0% (95%CI: 89.2-99.95%) in Aruba.
Interpretation: In community-dwelling subjects with mild respiratory symptoms the Panbio™ COVID-19 Ag Rapid Test had 100% specificity, and a sensitivity above 95% for nasopharyngeal samples when using Ct-values <32 cycles as cut-off for RT-qPCR test positivity. Considering short turnaround times, user friendliness, low costs and opportunities for decentralized testing, this test can improve our efforts to control transmission of SARS-CoV-2.
© 2020 Published by Elsevier Ltd.
Conflict of interest statement
Dr. Wensing reports grants from ViiV Healthcare, Gilead, grants from Janssen, Gilead, Merck, grants from Janssen, Gilead, Merck, ViiV Healthcare, grants from ARK diagnostics, outside the submitted work. All other authors report no conflict.
Figures
Comment in
-
Rapid antigen test had up to 98% sensitivity and 100% specificity for detecting COVID-19 in persons with mild symptoms.Ann Intern Med. 2021 Jun;174(6):JC71. doi: 10.7326/ACPJ202106150-071. Epub 2021 Jun 1. Ann Intern Med. 2021. PMID: 34058108
References
-
- Grant B.D., Anderson C.E., Williford J.R., Alonzo L.F., Glukhova V.A., Boyle D.S. SARS-CoV-2 coronavirus nucleocapsid antigen-detecting half-strip lateral flow assay toward the development of point of care tests using commercially available reagents. Anal Chem. 2020;92(16):11305–11309. doi: 10.1021/acs.analchem.0c01975. - DOI - PubMed
-
- Finddx.org. Access date October 13 2020, [Internet]. Available from: https://www.finddx.org/covid-19/pipeline/
LinkOut - more resources
Full Text Sources
Other Literature Sources
Miscellaneous
