Assessing Polycystic Kidney Disease in Rodents: Comparison of Robotic 3D Ultrasound and Magnetic Resonance Imaging
- PMID: 33521650
- PMCID: PMC7842280
- DOI: 10.34067/kid.0003912020
Assessing Polycystic Kidney Disease in Rodents: Comparison of Robotic 3D Ultrasound and Magnetic Resonance Imaging
Abstract
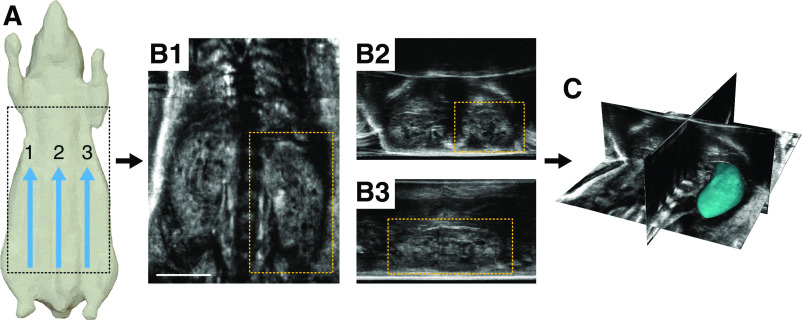
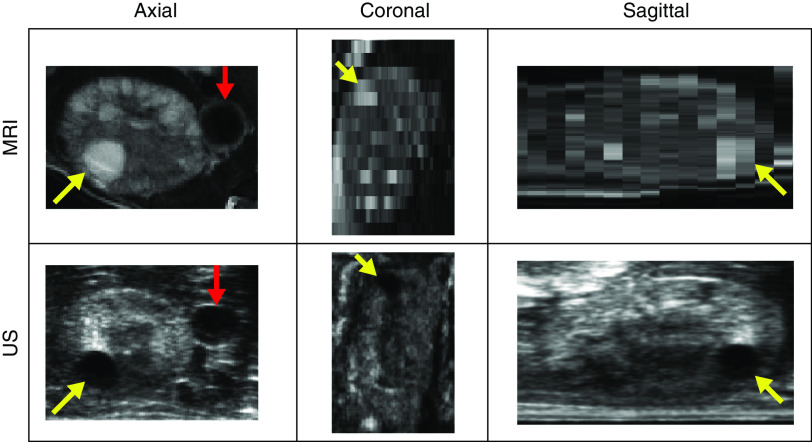
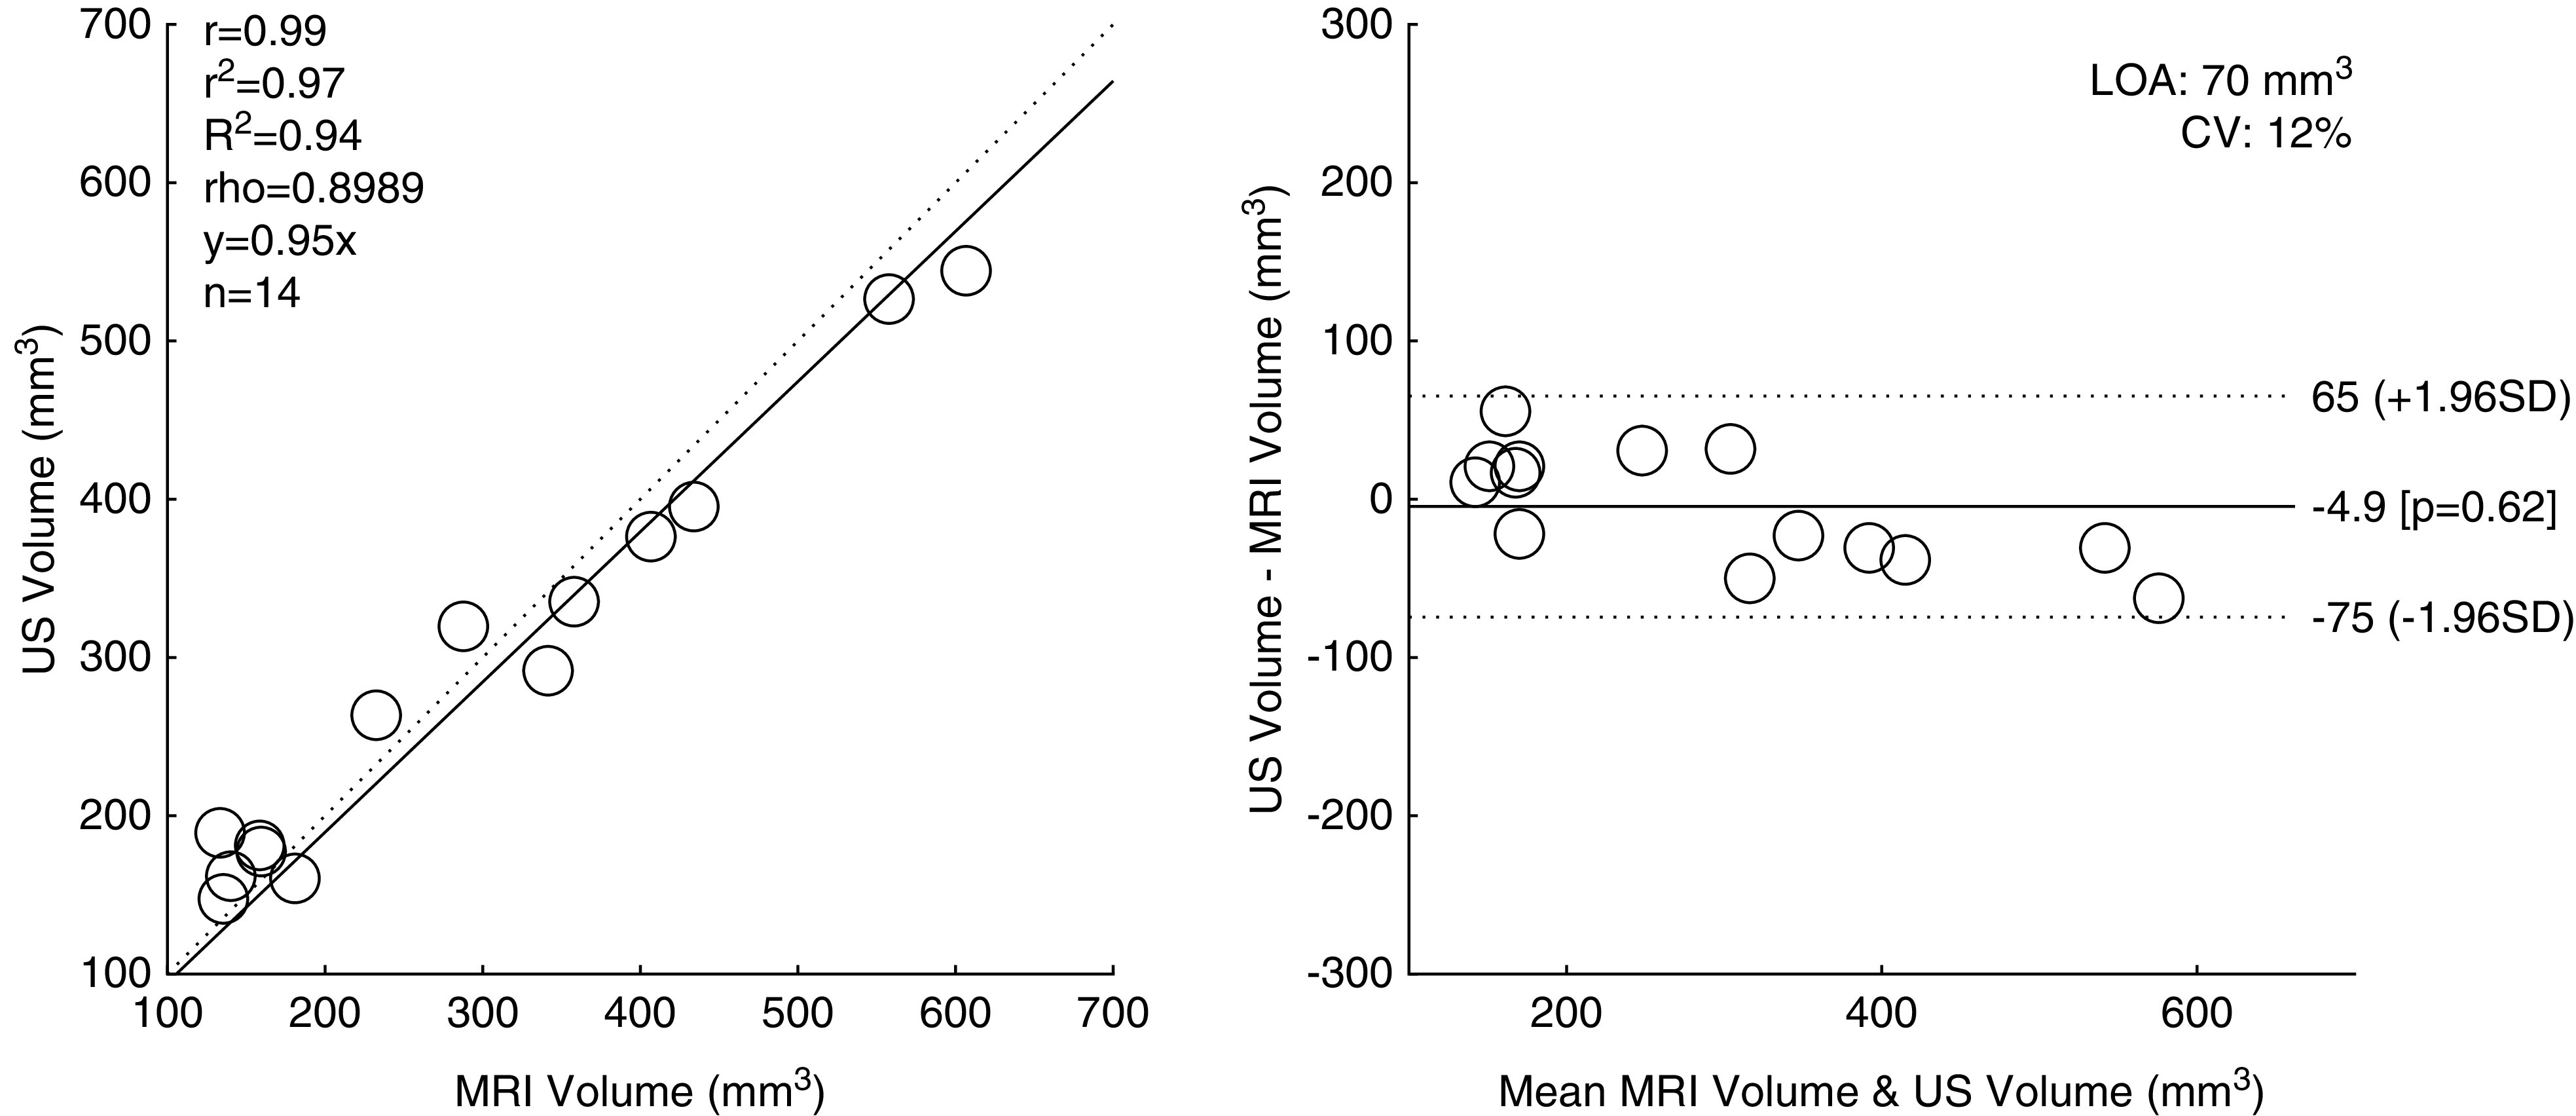
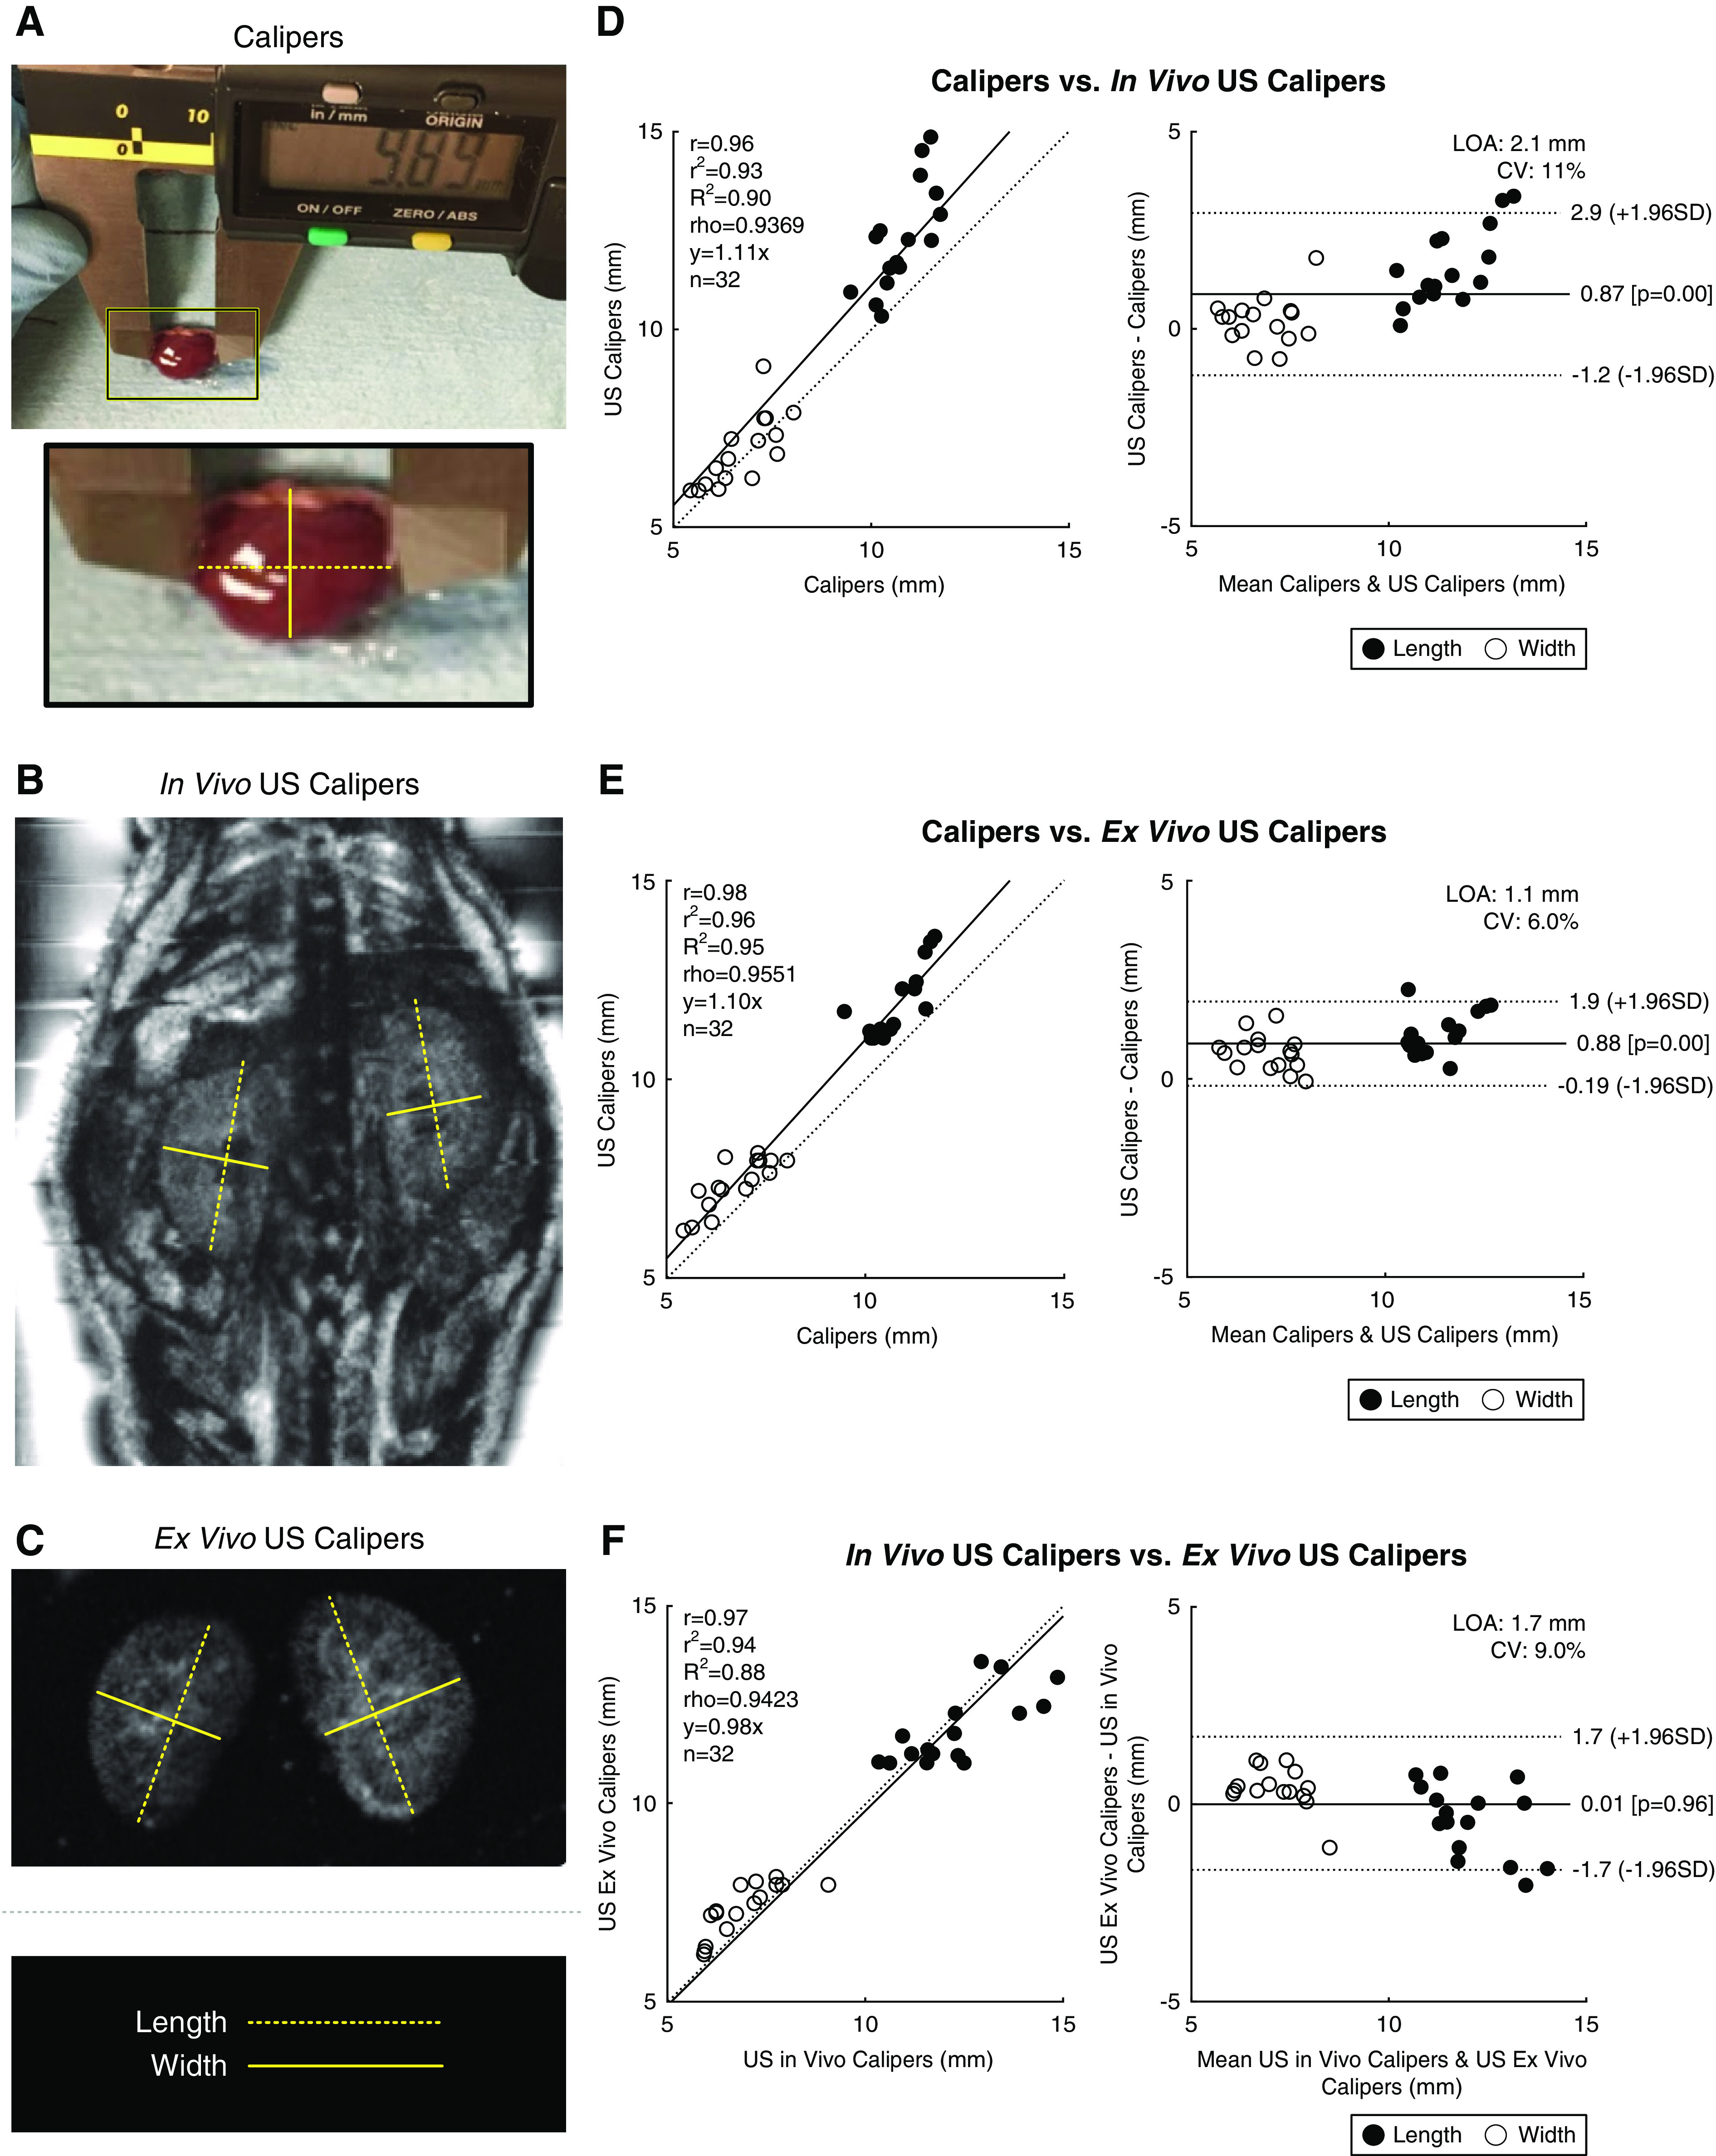
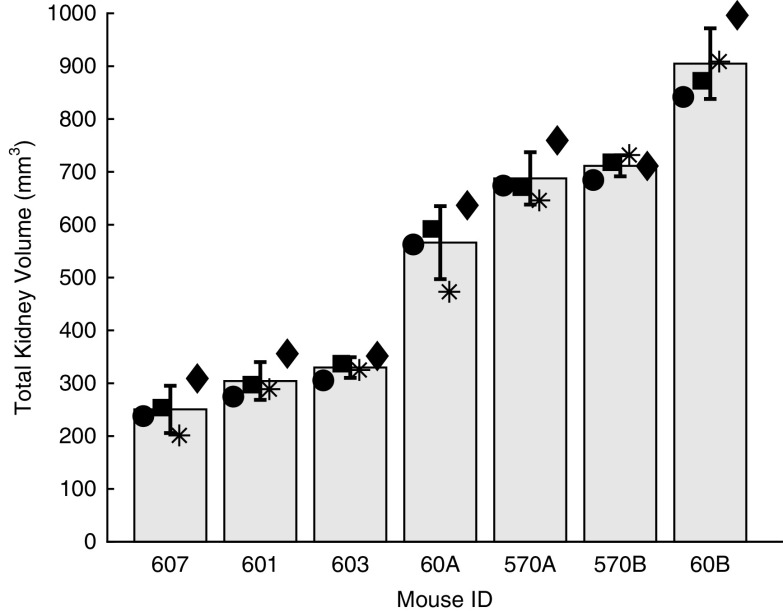
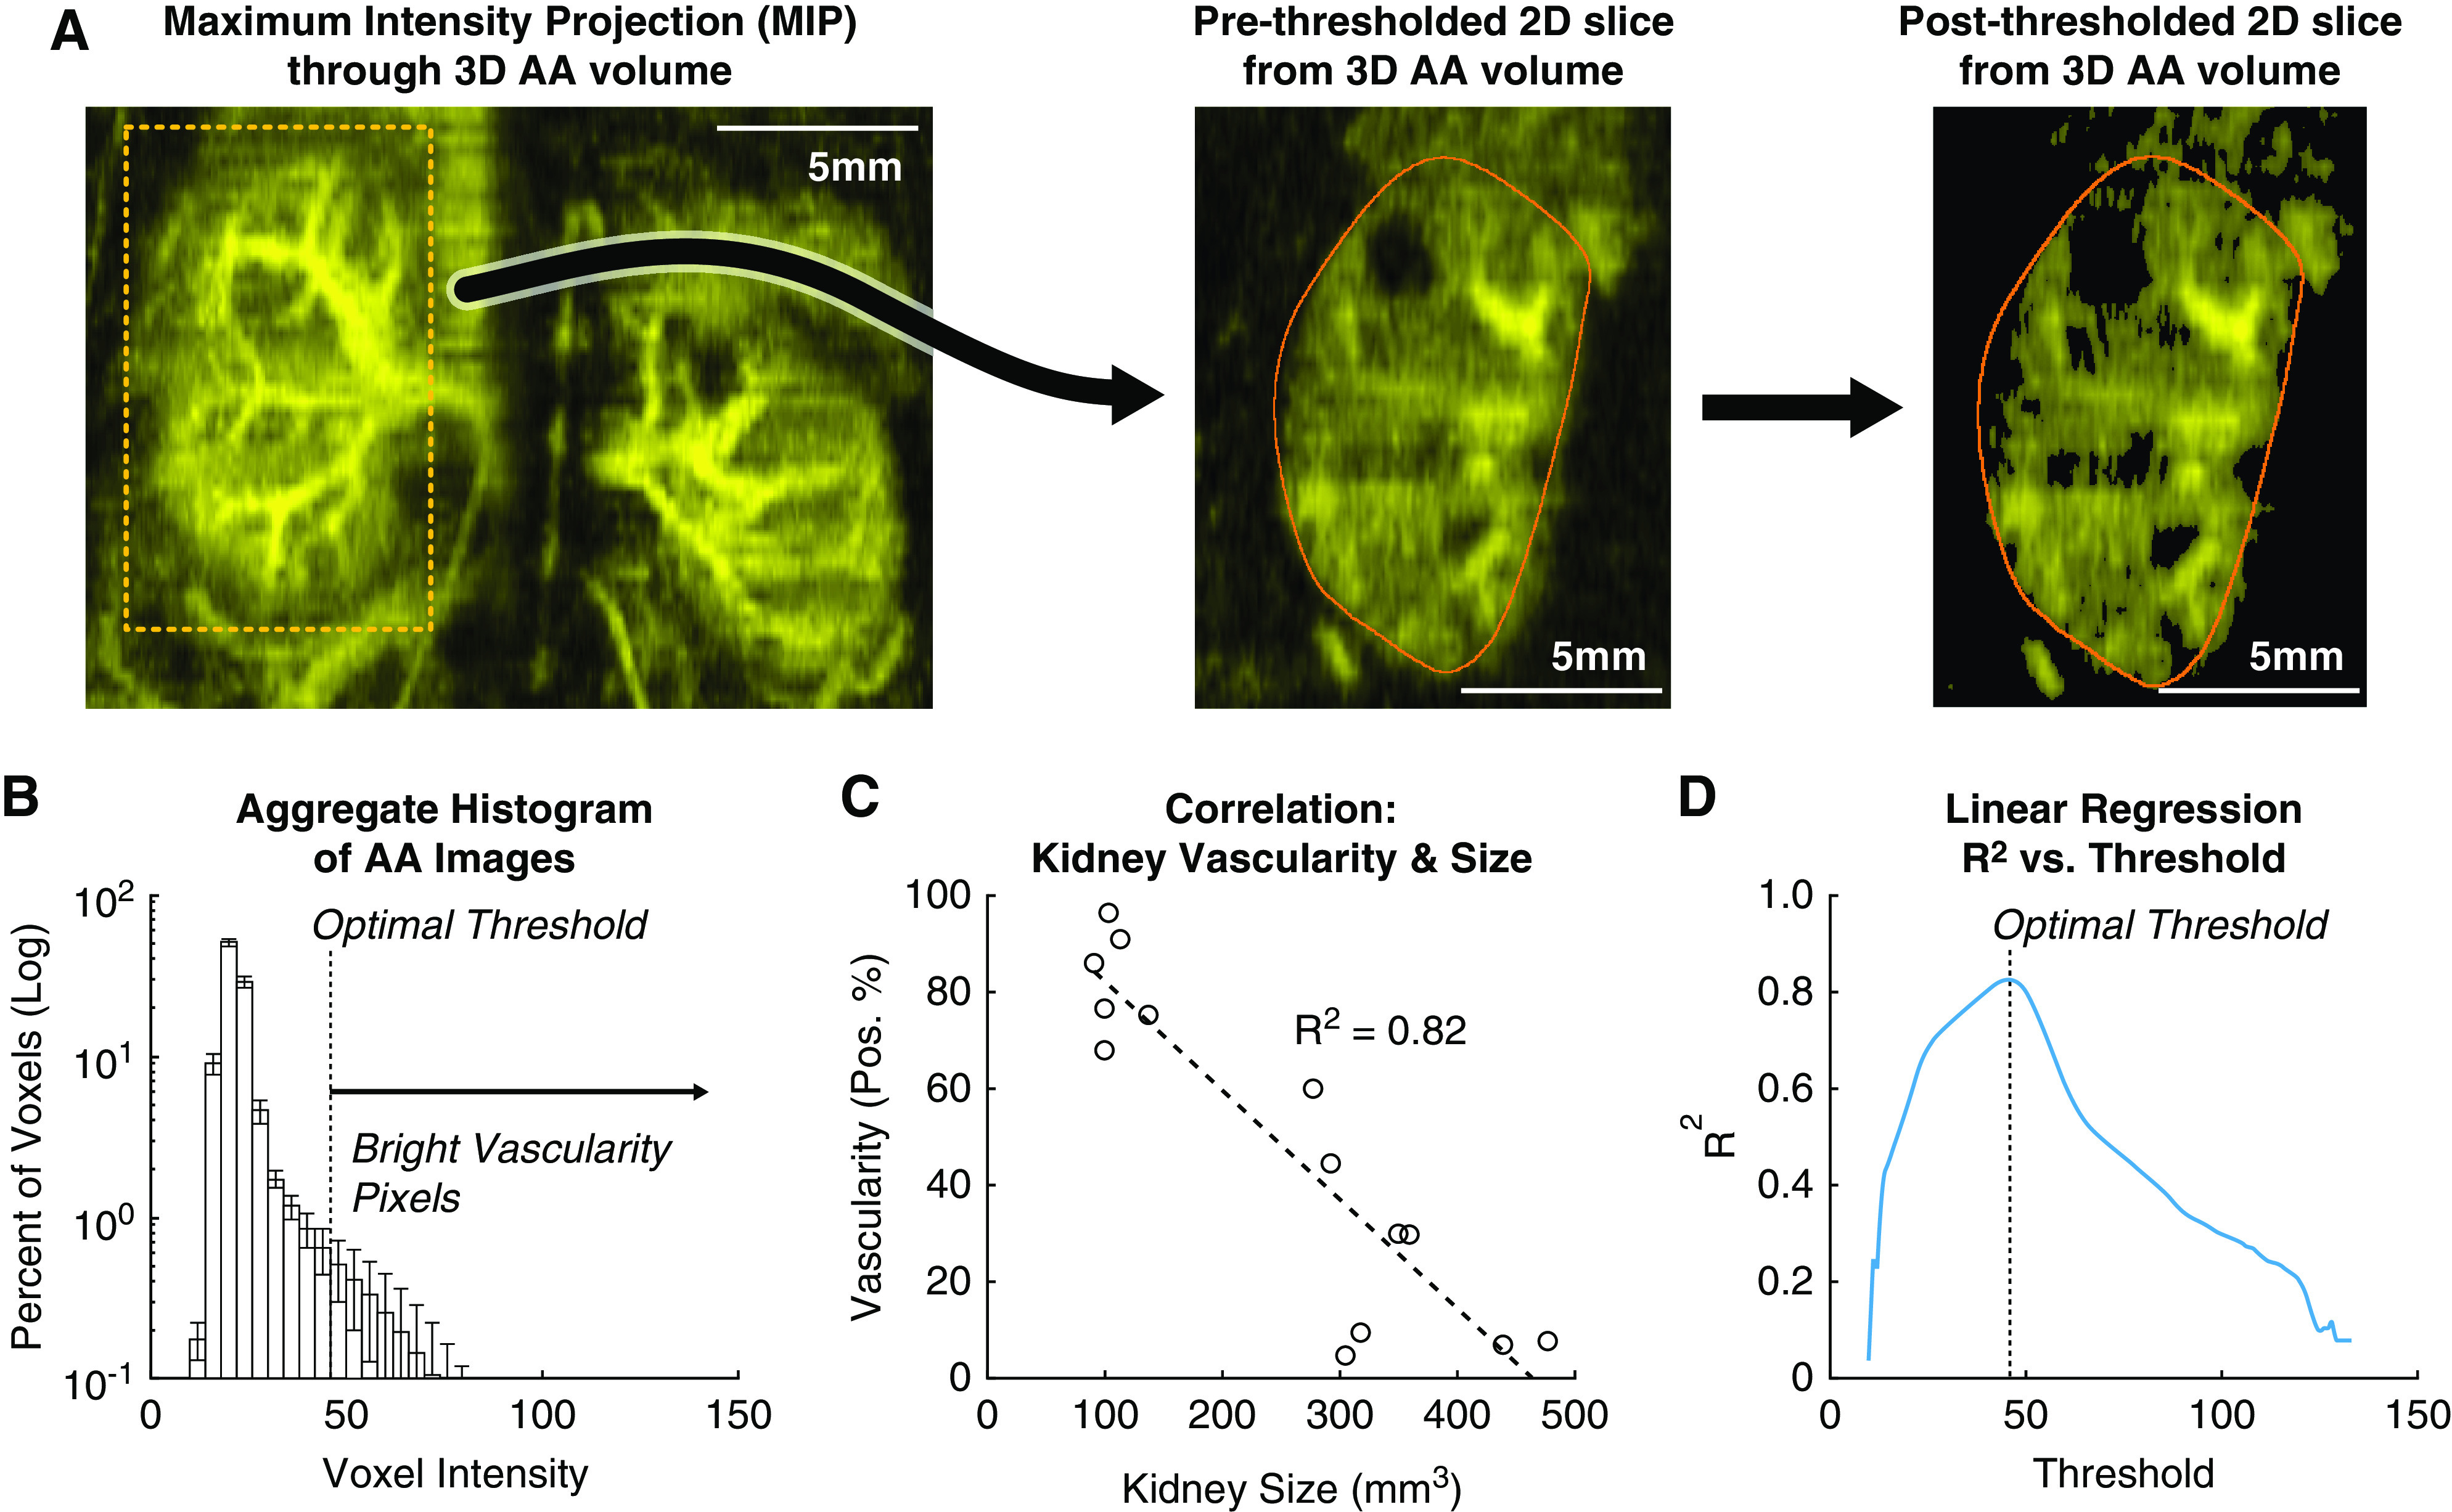
Polycystic kidney disease (PKD) is an inherited disorder characterized by renal cyst formation and enlargement of the kidney. PKD severity can be staged noninvasively by measuring total kidney volume (TKV), a promising biomarker that has recently received regulatory qualification. In preclinical mouse models, where the disease is studied and potential therapeutics are evaluated, the most popular noninvasive method of measuring TKV is magnetic resonance imaging (MRI). Although MRI provides excellent 3D resolution and contrast, these systems are expensive to operate, have long acquisition times, and, consequently, are not heavily used in preclinical PKD research. In this study, a new imaging instrument, based on robotic ultrasound (US), was evaluated as a complementary approach for assessing PKD in rodent models. The objective was to determine the extent to which TKV measurements on the robotic US scanner correlated with both in vivo and ex vivo reference standards (MRI and Vernier calipers, respectively). A cross-sectional study design was implemented that included both PKD-affected mice and healthy wild types, spanning sex and age for a wide range of kidney volumes. It was found that US-derived TKV measurements and kidney lengths were strongly associated with both in vivo MRI and ex vivo Vernier caliper measurements (R 2=0.94 and 0.90, respectively). In addition to measuring TKV, renal vascular density was assessed using acoustic angiography (AA), a novel contrast-enhanced US methodology. AA image intensity, indicative of volumetric vascularity, was seen to have a strong negative correlation with TKV (R 2=0.82), suggesting impaired renal vascular function in mice with larger kidneys. These studies demonstrate that robotic US can provide a rapid and accurate approach for noninvasively evaluating PKD in rodent models.
Conflict of interest statement
N. Beaumont, T. Czernuszewicz, P. Dayton, R. Gessner, and J. Rojas are either employed by, have a significant financial interest in, or are coinventors on patents licensed by SonoVol, Inc. Authors report the following National Institutes of Health (NIH) grant with SonoVol is under consideration: R43 DK126607 (Small Business Innovation Research/NIH; multiple principal investigator [MPI]; SonoVol principal investigator, T. Czernuszewicz/Mayo; Mayo MPI, T. Kline and M. Romero), “A new robotic AI imaging platform for improved kidney disease research and drug discovery.” This proposal builds on and extends the work presented in this manuscript.
Figures
Similar articles
-
Accuracy and processing time of kidney volume measurement methods in rodents polycystic kidney disease models: superiority of semiautomated kidney segmentation.Am J Physiol Renal Physiol. 2023 Apr 1;324(4):F423-F430. doi: 10.1152/ajprenal.00295.2022. Epub 2023 Feb 16. Am J Physiol Renal Physiol. 2023. PMID: 36794756 Free PMC article.
-
Automated measurement of total kidney volume from 3D ultrasound images of patients affected by polycystic kidney disease and comparison to MR measurements.Abdom Radiol (NY). 2022 Jul;47(7):2408-2419. doi: 10.1007/s00261-022-03521-5. Epub 2022 Apr 27. Abdom Radiol (NY). 2022. PMID: 35476147 Free PMC article.
-
Use of 3D Robotic Ultrasound for In Vivo Analysis of Mouse Kidneys.J Vis Exp. 2021 Aug 12;(174). doi: 10.3791/62682. J Vis Exp. 2021. PMID: 34459826
-
Looking at the (w)hole: magnet resonance imaging in polycystic kidney disease.Pediatr Nephrol. 2013 Sep;28(9):1771-83. doi: 10.1007/s00467-012-2370-y. Epub 2012 Dec 14. Pediatr Nephrol. 2013. PMID: 23239392 Review.
-
Assessing Risk of Rapid Progression in Autosomal Dominant Polycystic Kidney Disease and Special Considerations for Disease-Modifying Therapy.Am J Kidney Dis. 2021 Aug;78(2):282-292. doi: 10.1053/j.ajkd.2020.12.020. Epub 2021 Mar 8. Am J Kidney Dis. 2021. PMID: 33705818 Review.
Cited by
-
Robotic Ultrasound and Novel Collagen Analyses for Polycystic Kidney Disease Research Using Mice.Kidney360. 2024 Oct 1;5(10):1543-1552. doi: 10.34067/KID.0000000000000542. Epub 2024 Aug 12. Kidney360. 2024. PMID: 39145639 Free PMC article.
References
-
- Levy M, Feingold J: Estimating prevalence in single-gene kidney diseases progressing to renal failure. Kidney Int 58: 925–943, 2000 - PubMed
-
- Igarashi P, Somlo S: Polycystic kidney disease. J Am Soc Nephrol 18: 1371–1373, 2007 - PubMed
-
- Nagao S, Kugita M, Yoshihara D, Yamaguchi T: Animal models for human polycystic kidney disease. Exp Anim 61: 477–488, 2012 - PubMed
Publication types
MeSH terms
Grants and funding
LinkOut - more resources
Full Text Sources