. 2020 Apr:1:423-436.
doi: 10.1038/s43018-019-0020-z. Epub 2020 Feb 17.

Single-cell analyses reveal increased intratumoral heterogeneity after the onset of therapy resistance in small-cell lung cancer

Affiliations

Single-cell analyses reveal increased intratumoral heterogeneity after the onset of therapy resistance in small-cell lung cancer

C Allison Stewart et al. Nat Cancer. 2020 Apr.

Abstract

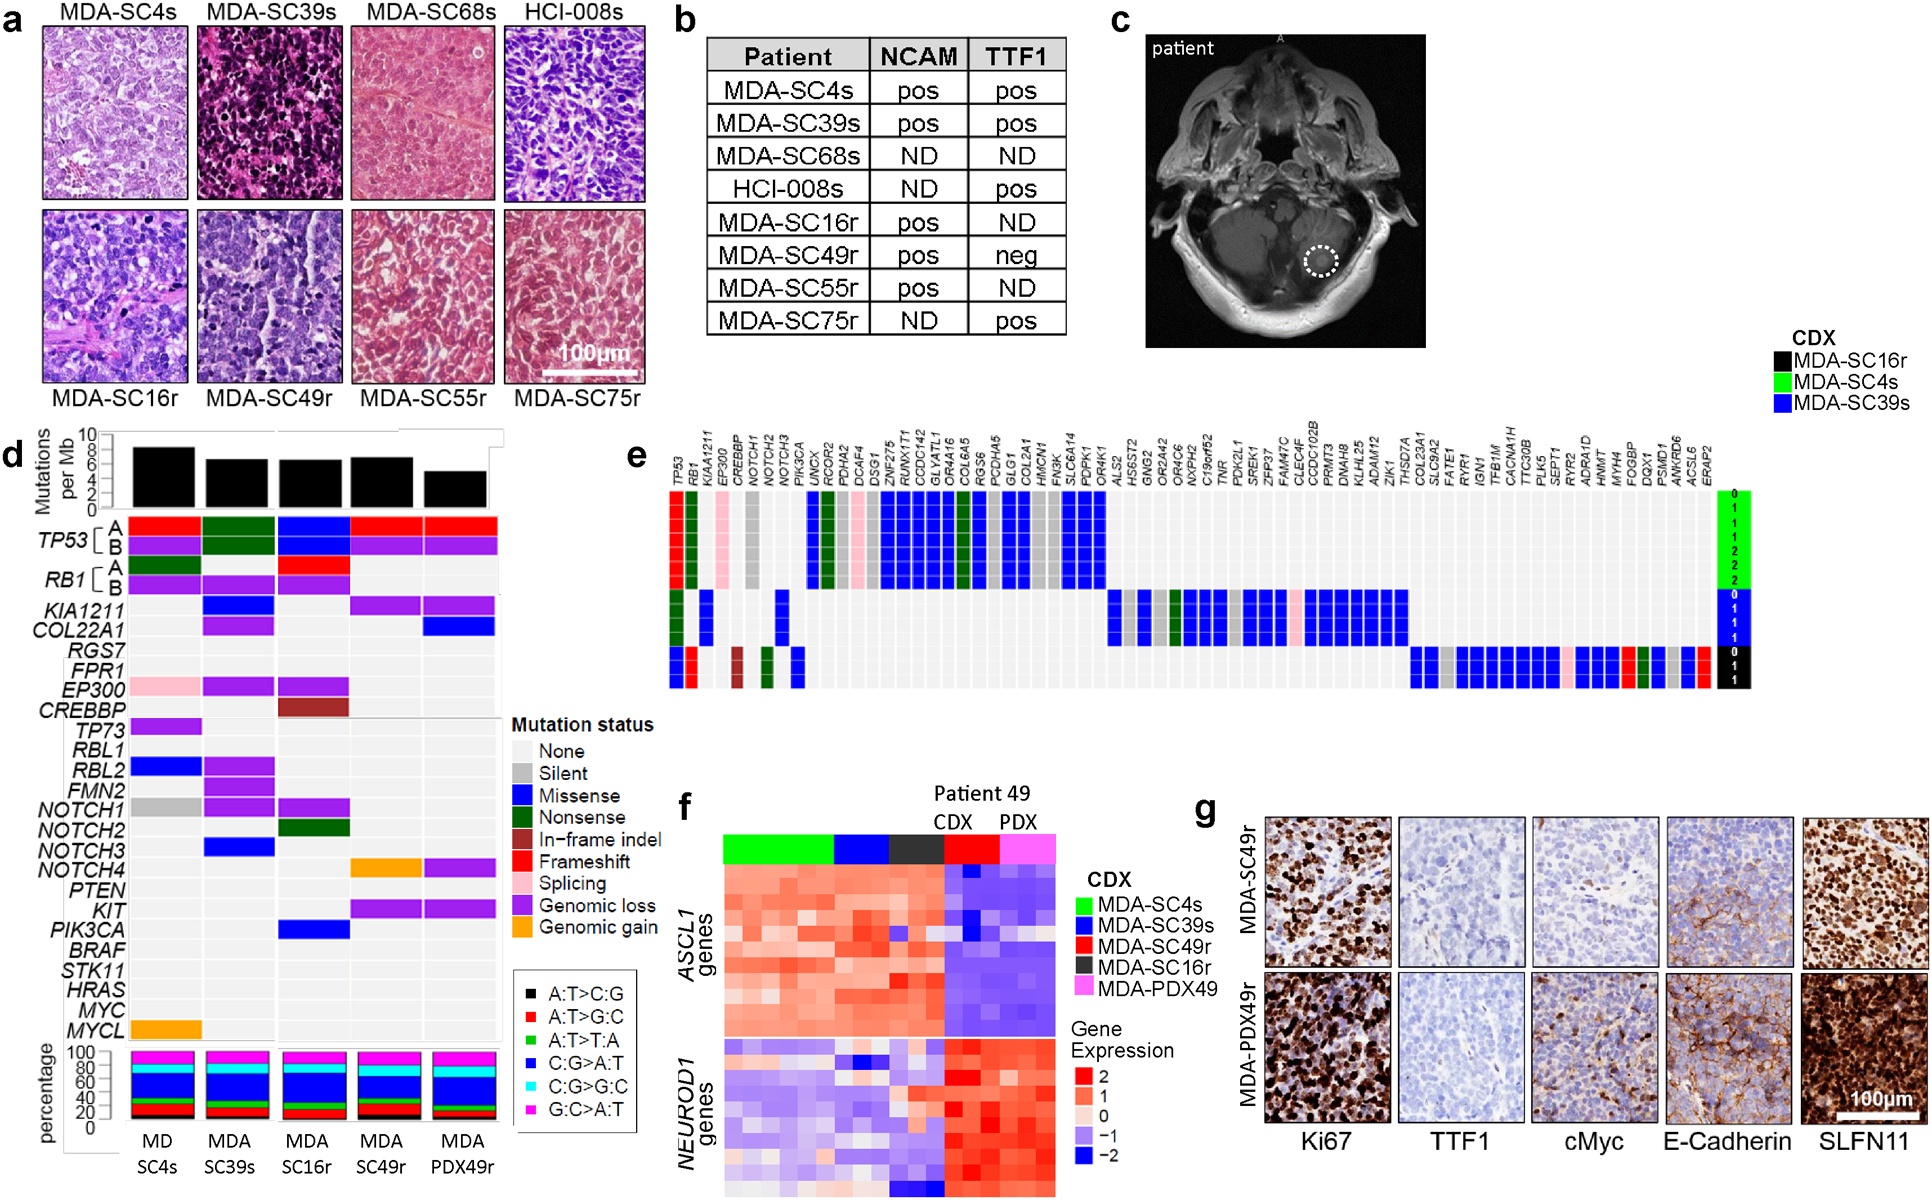
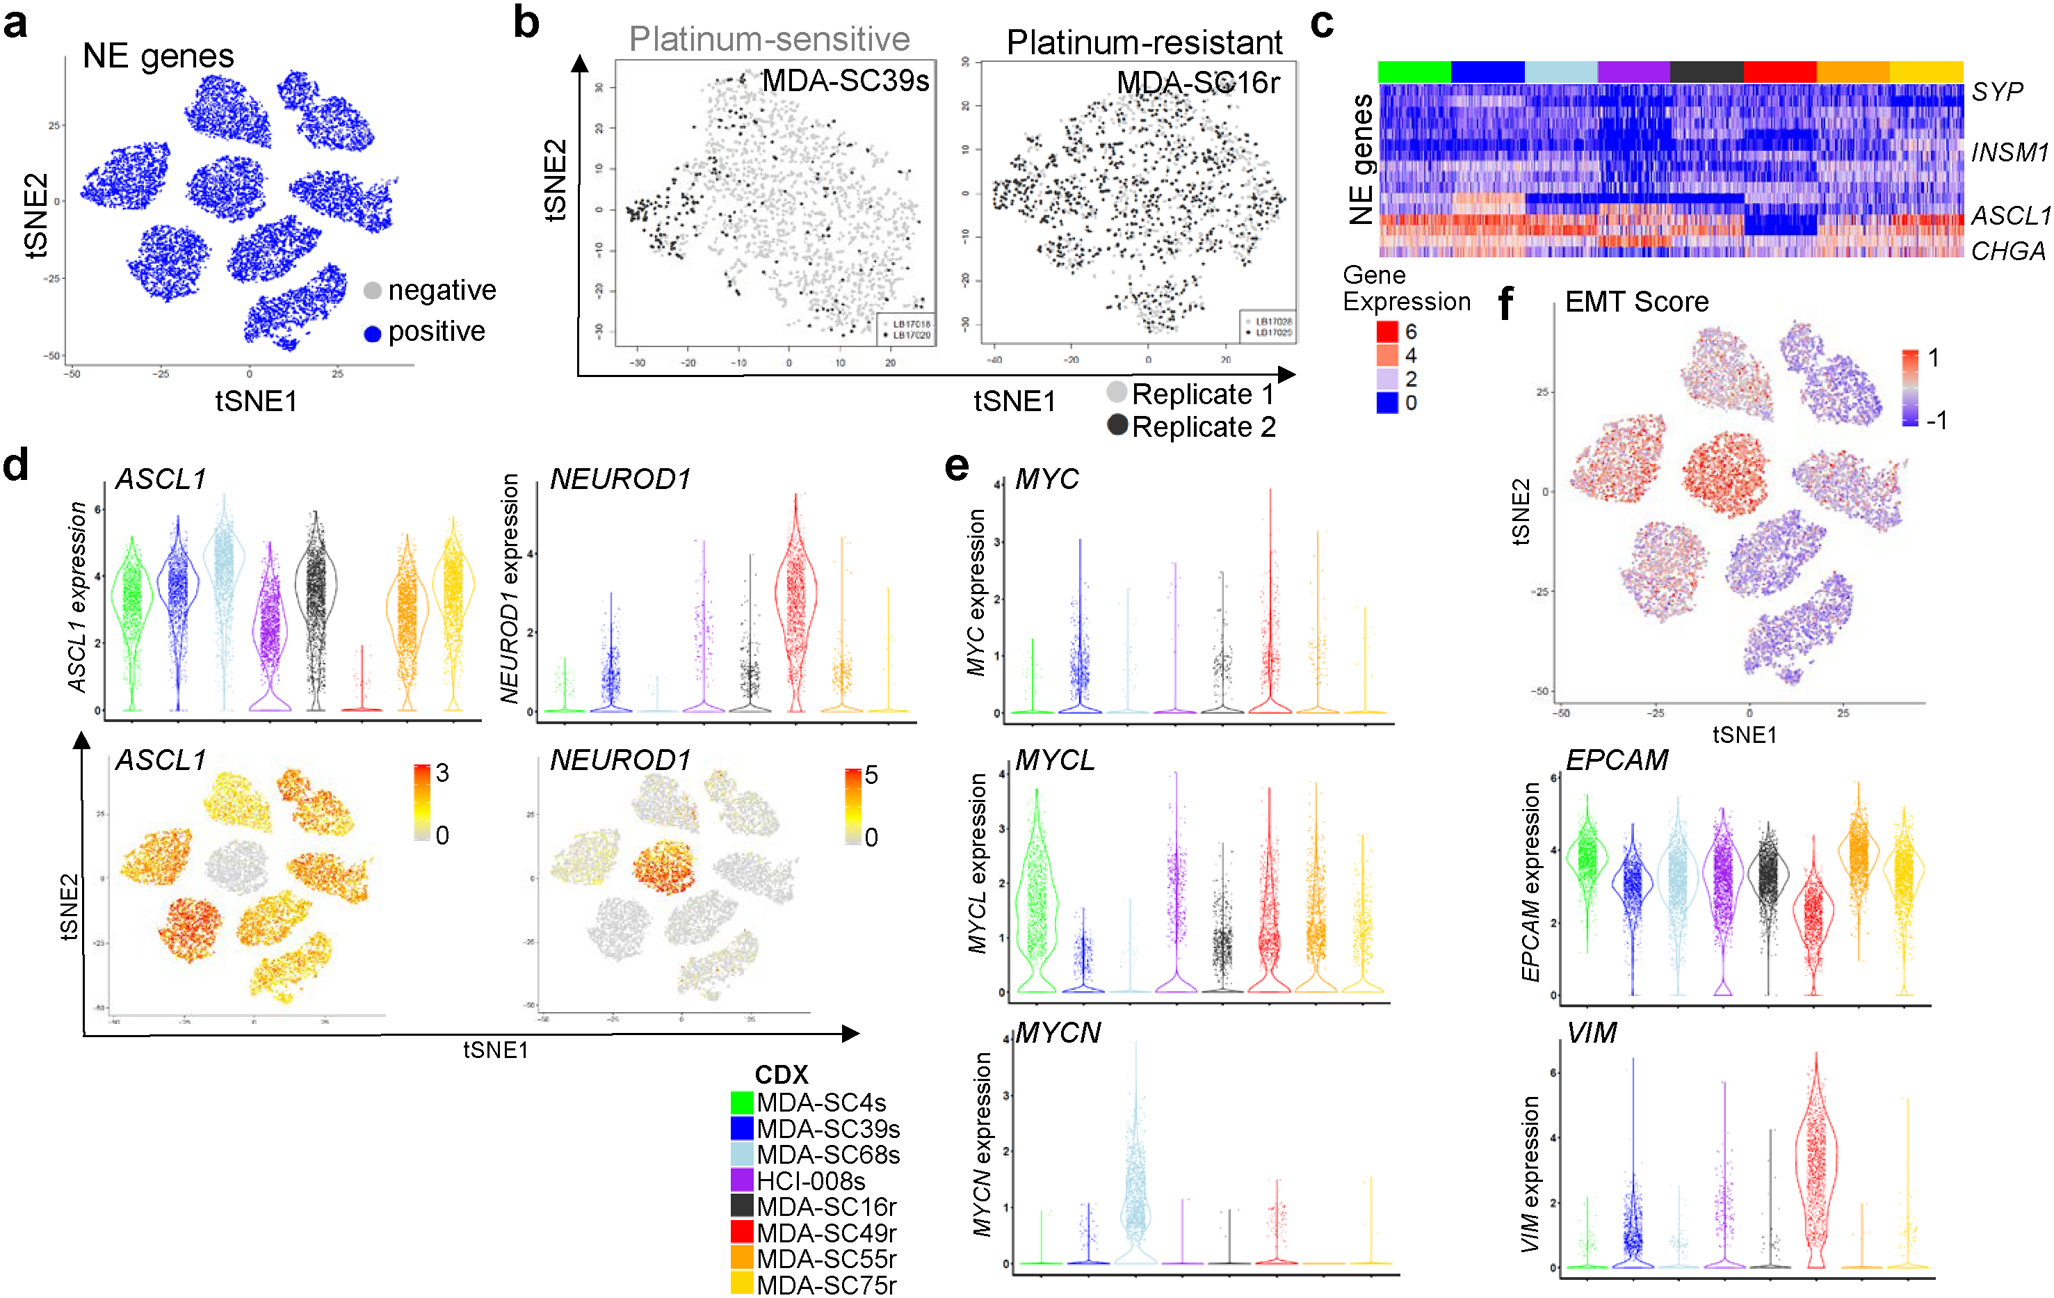
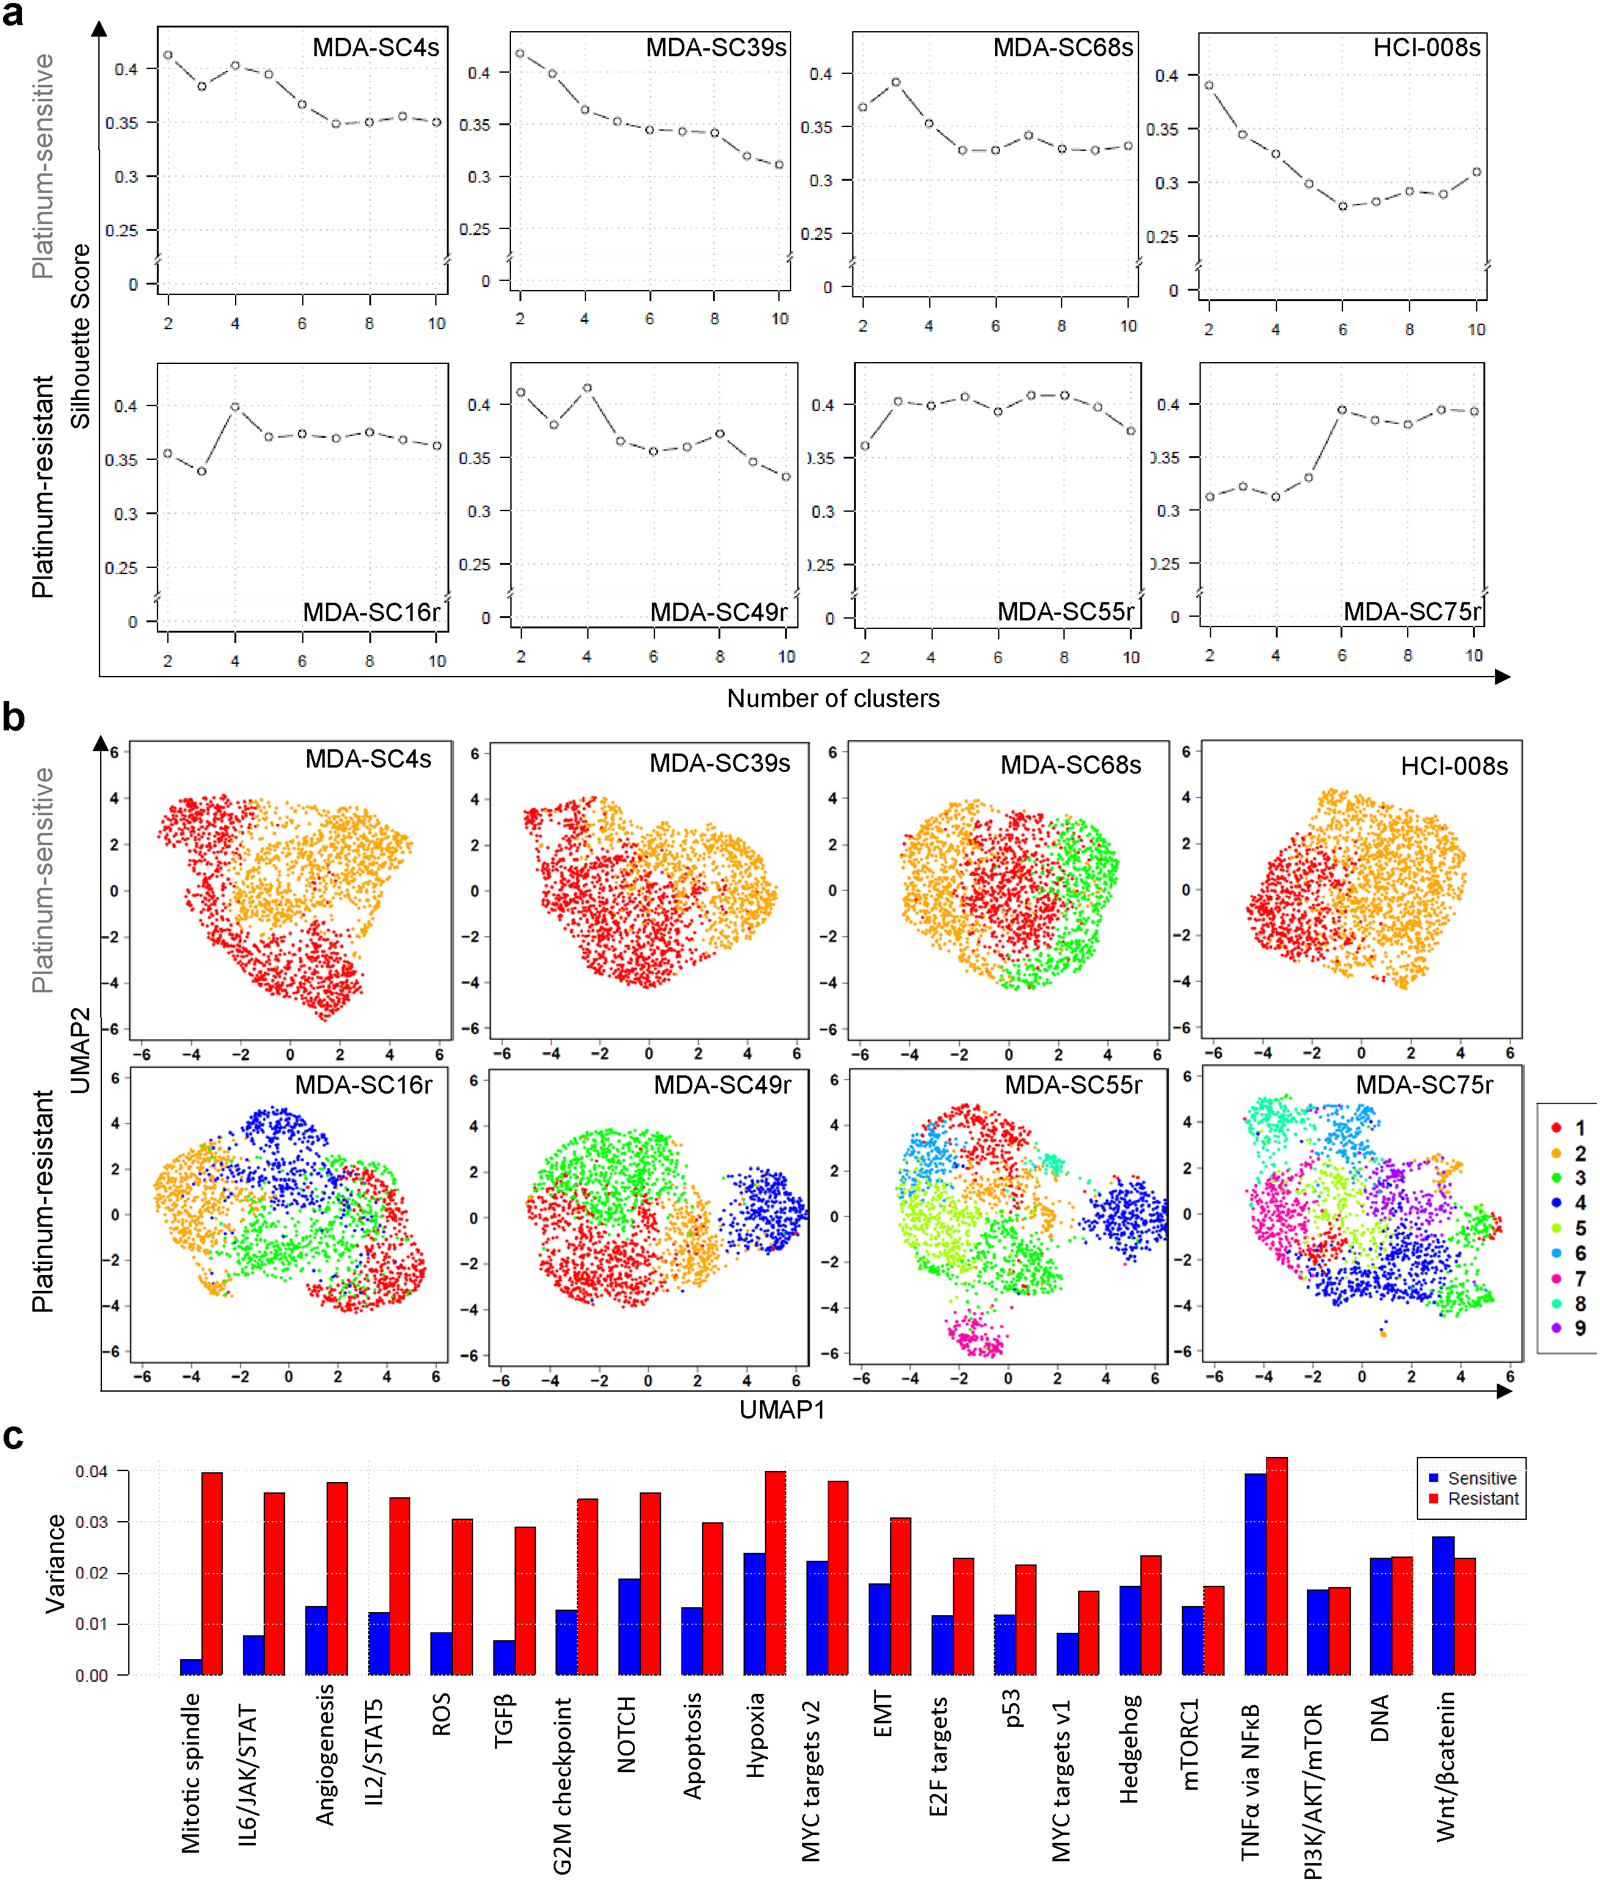
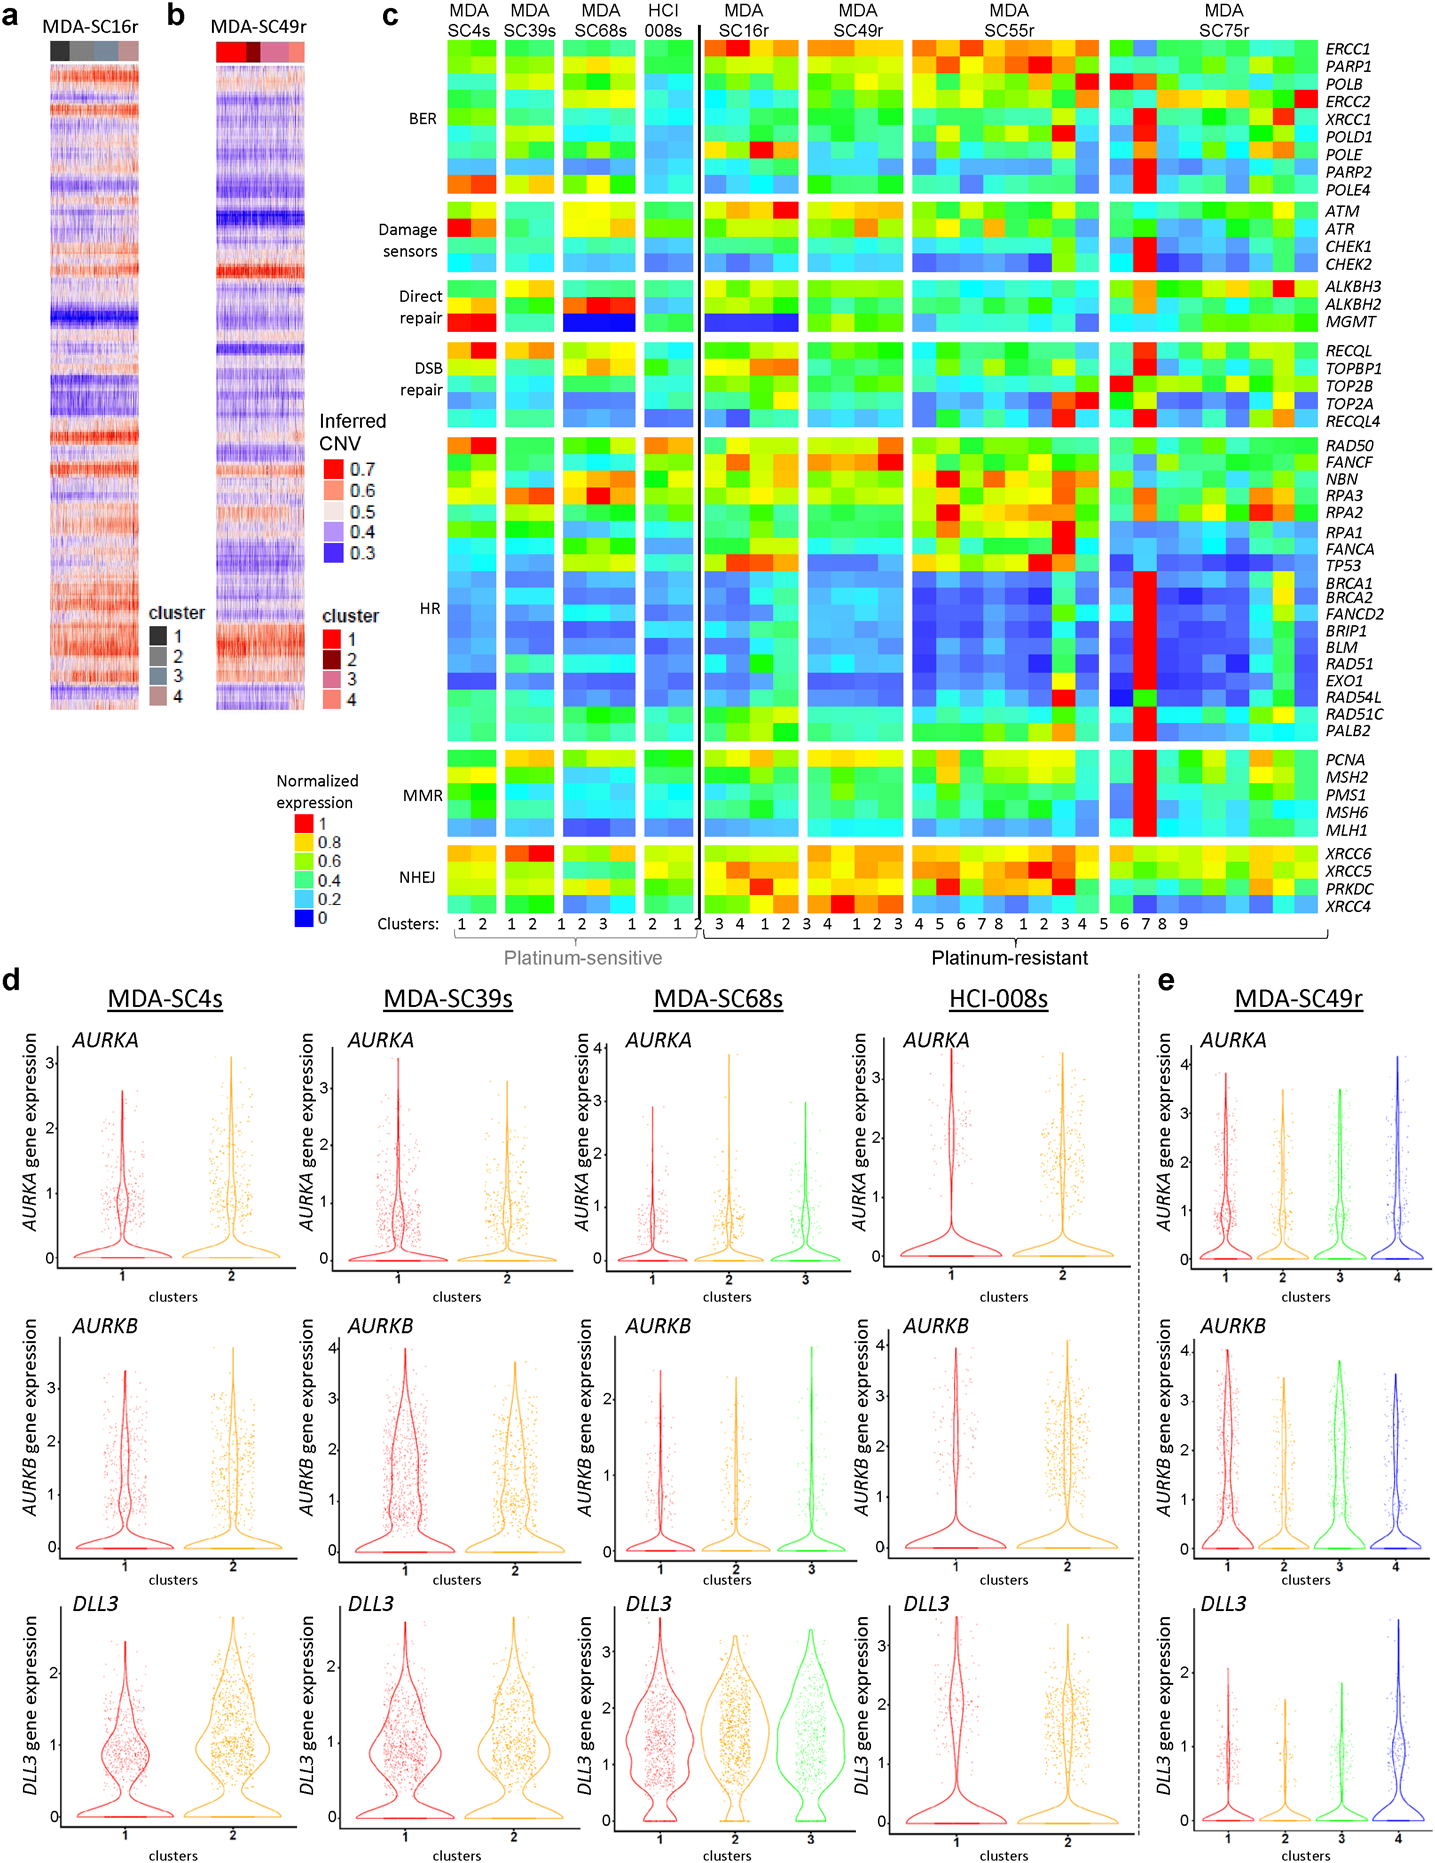
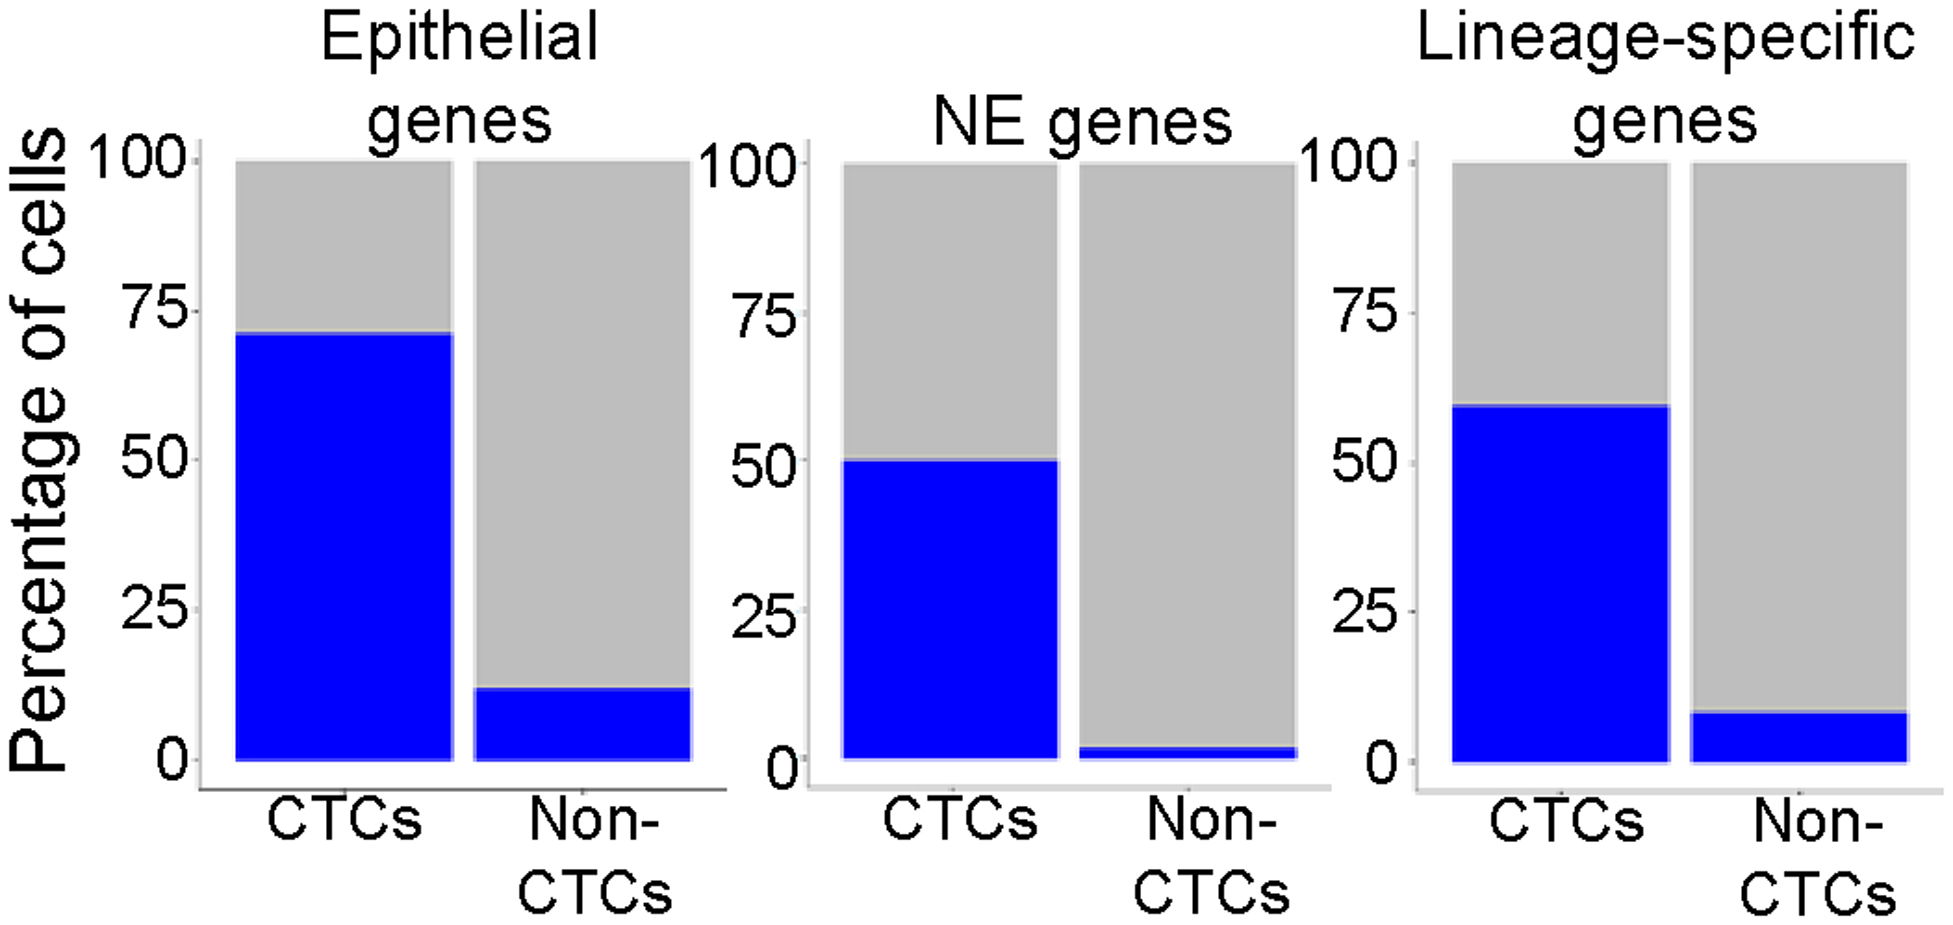
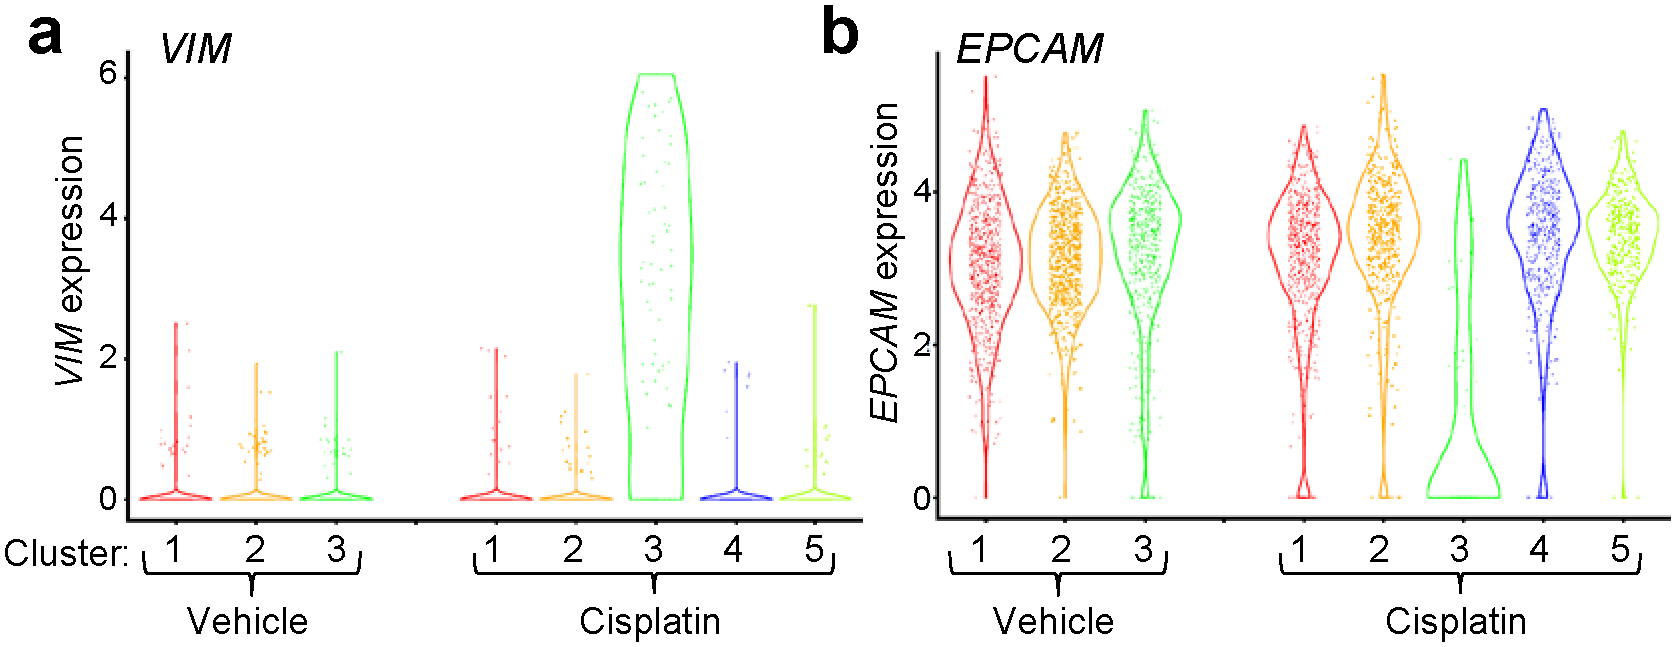
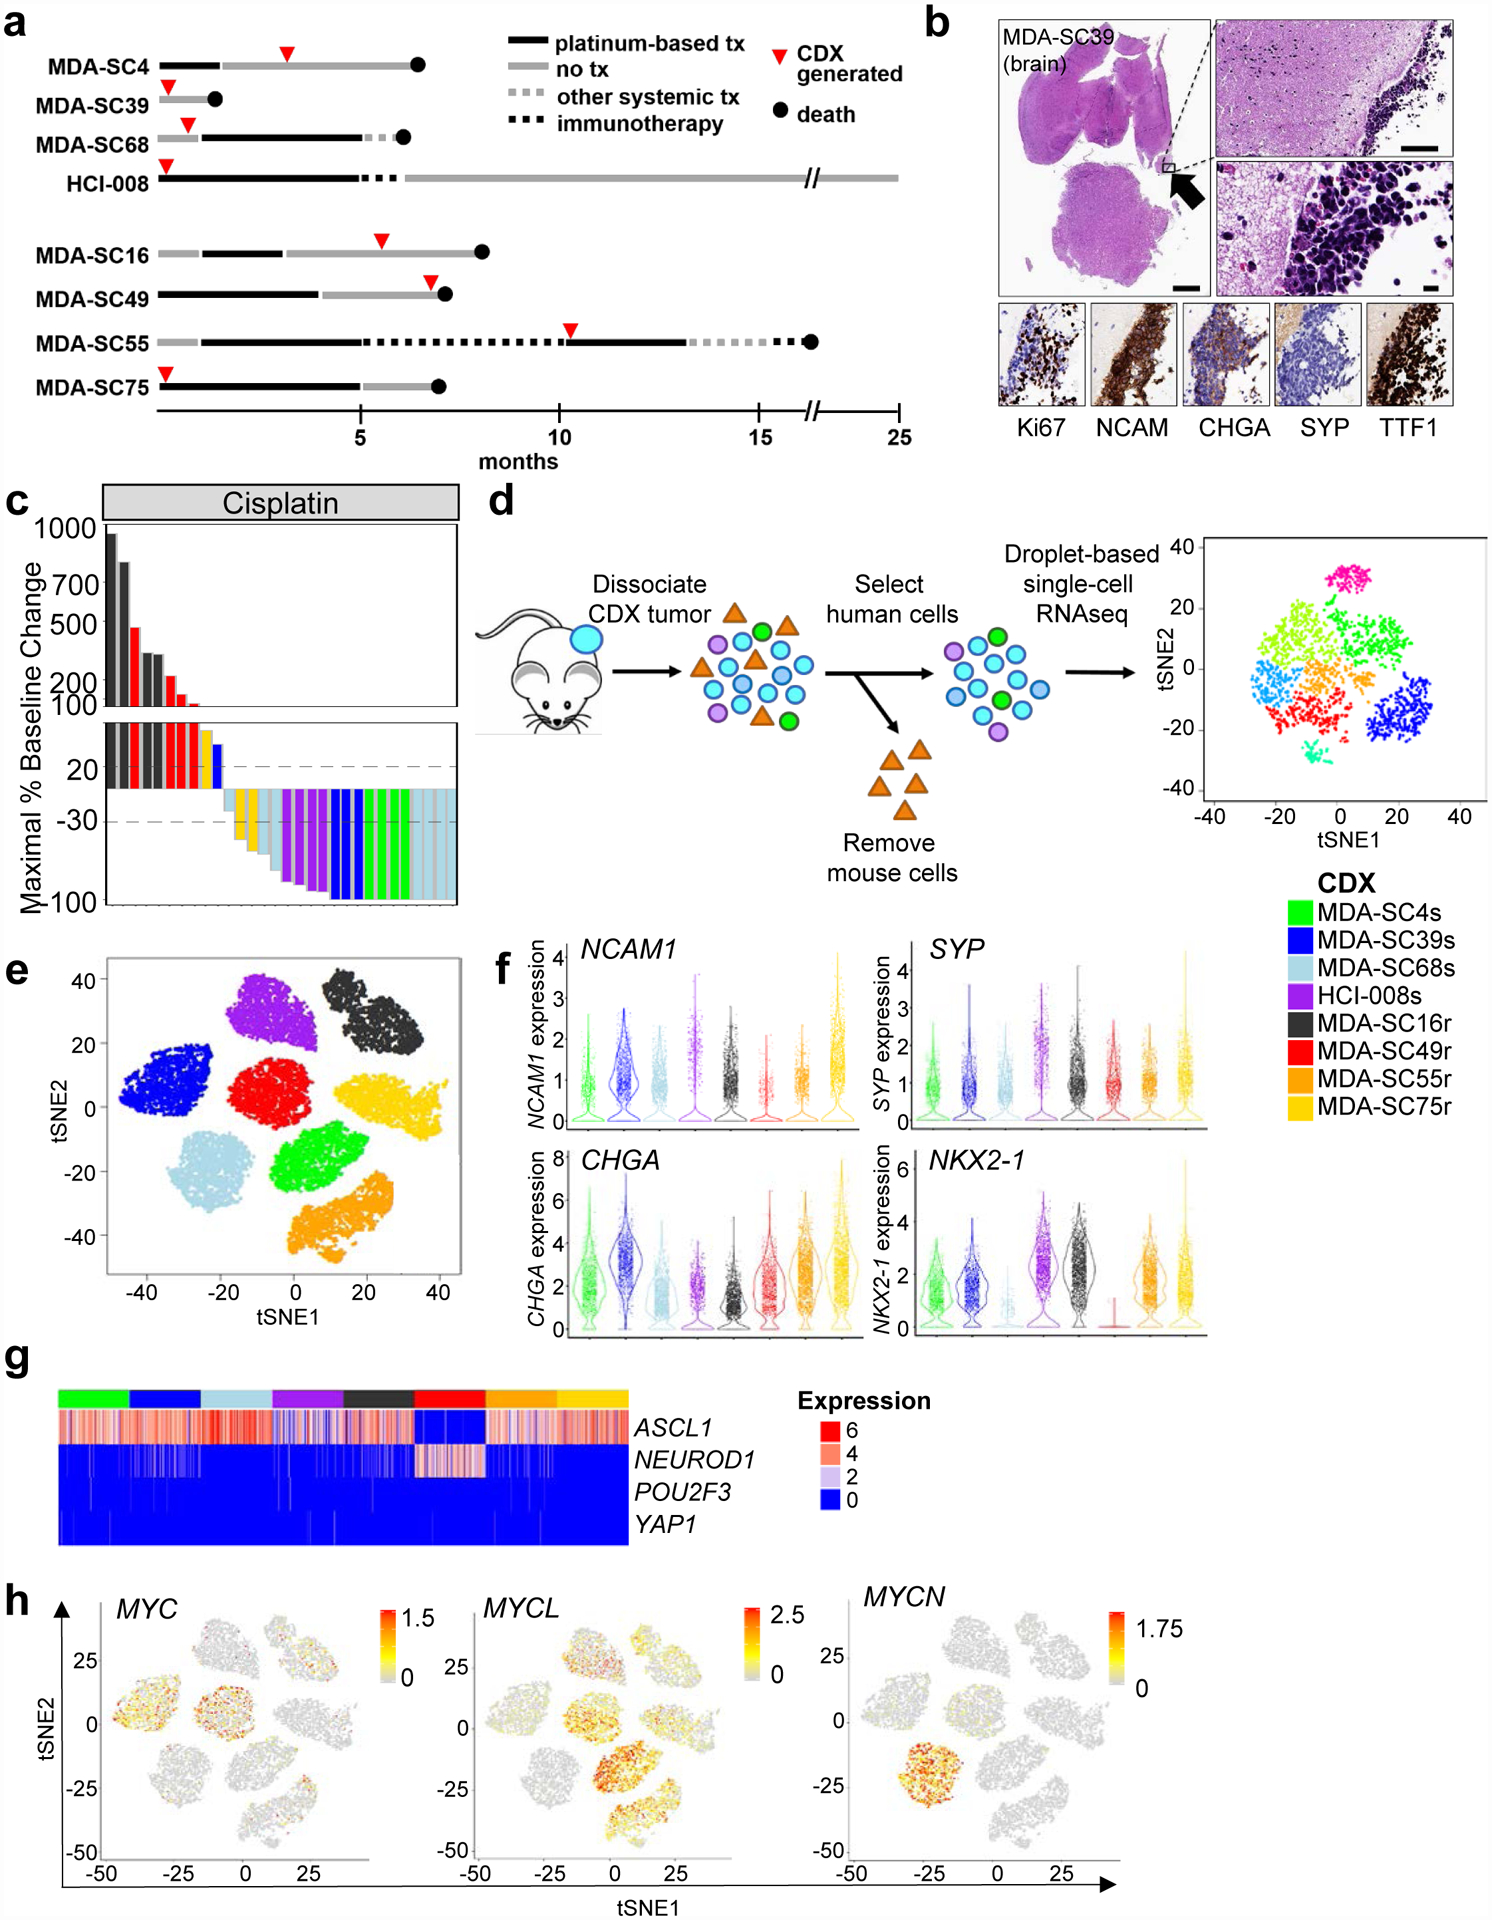
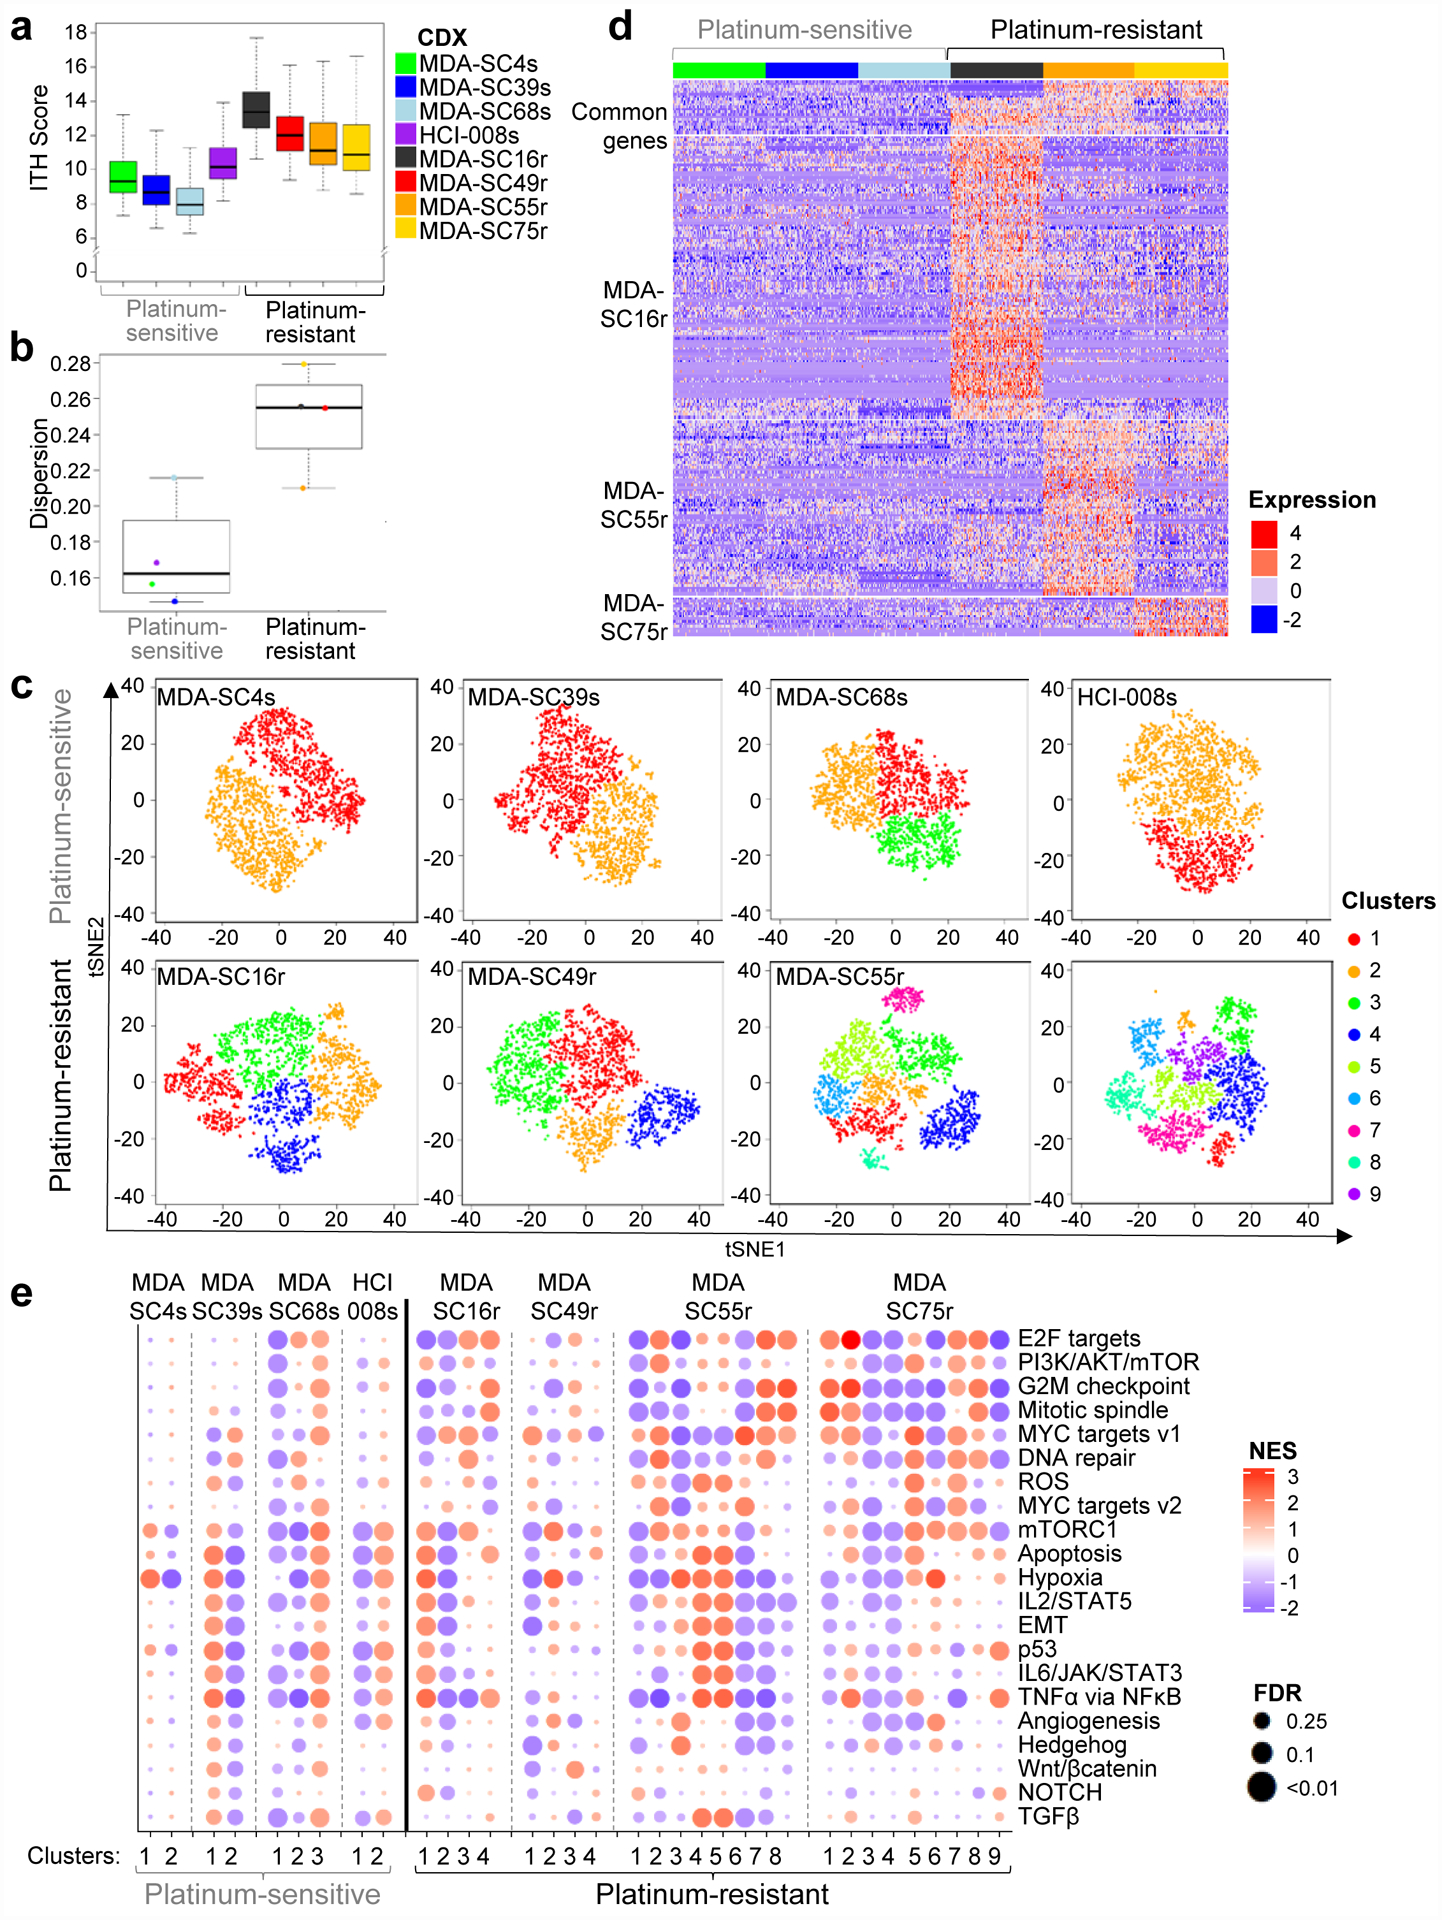
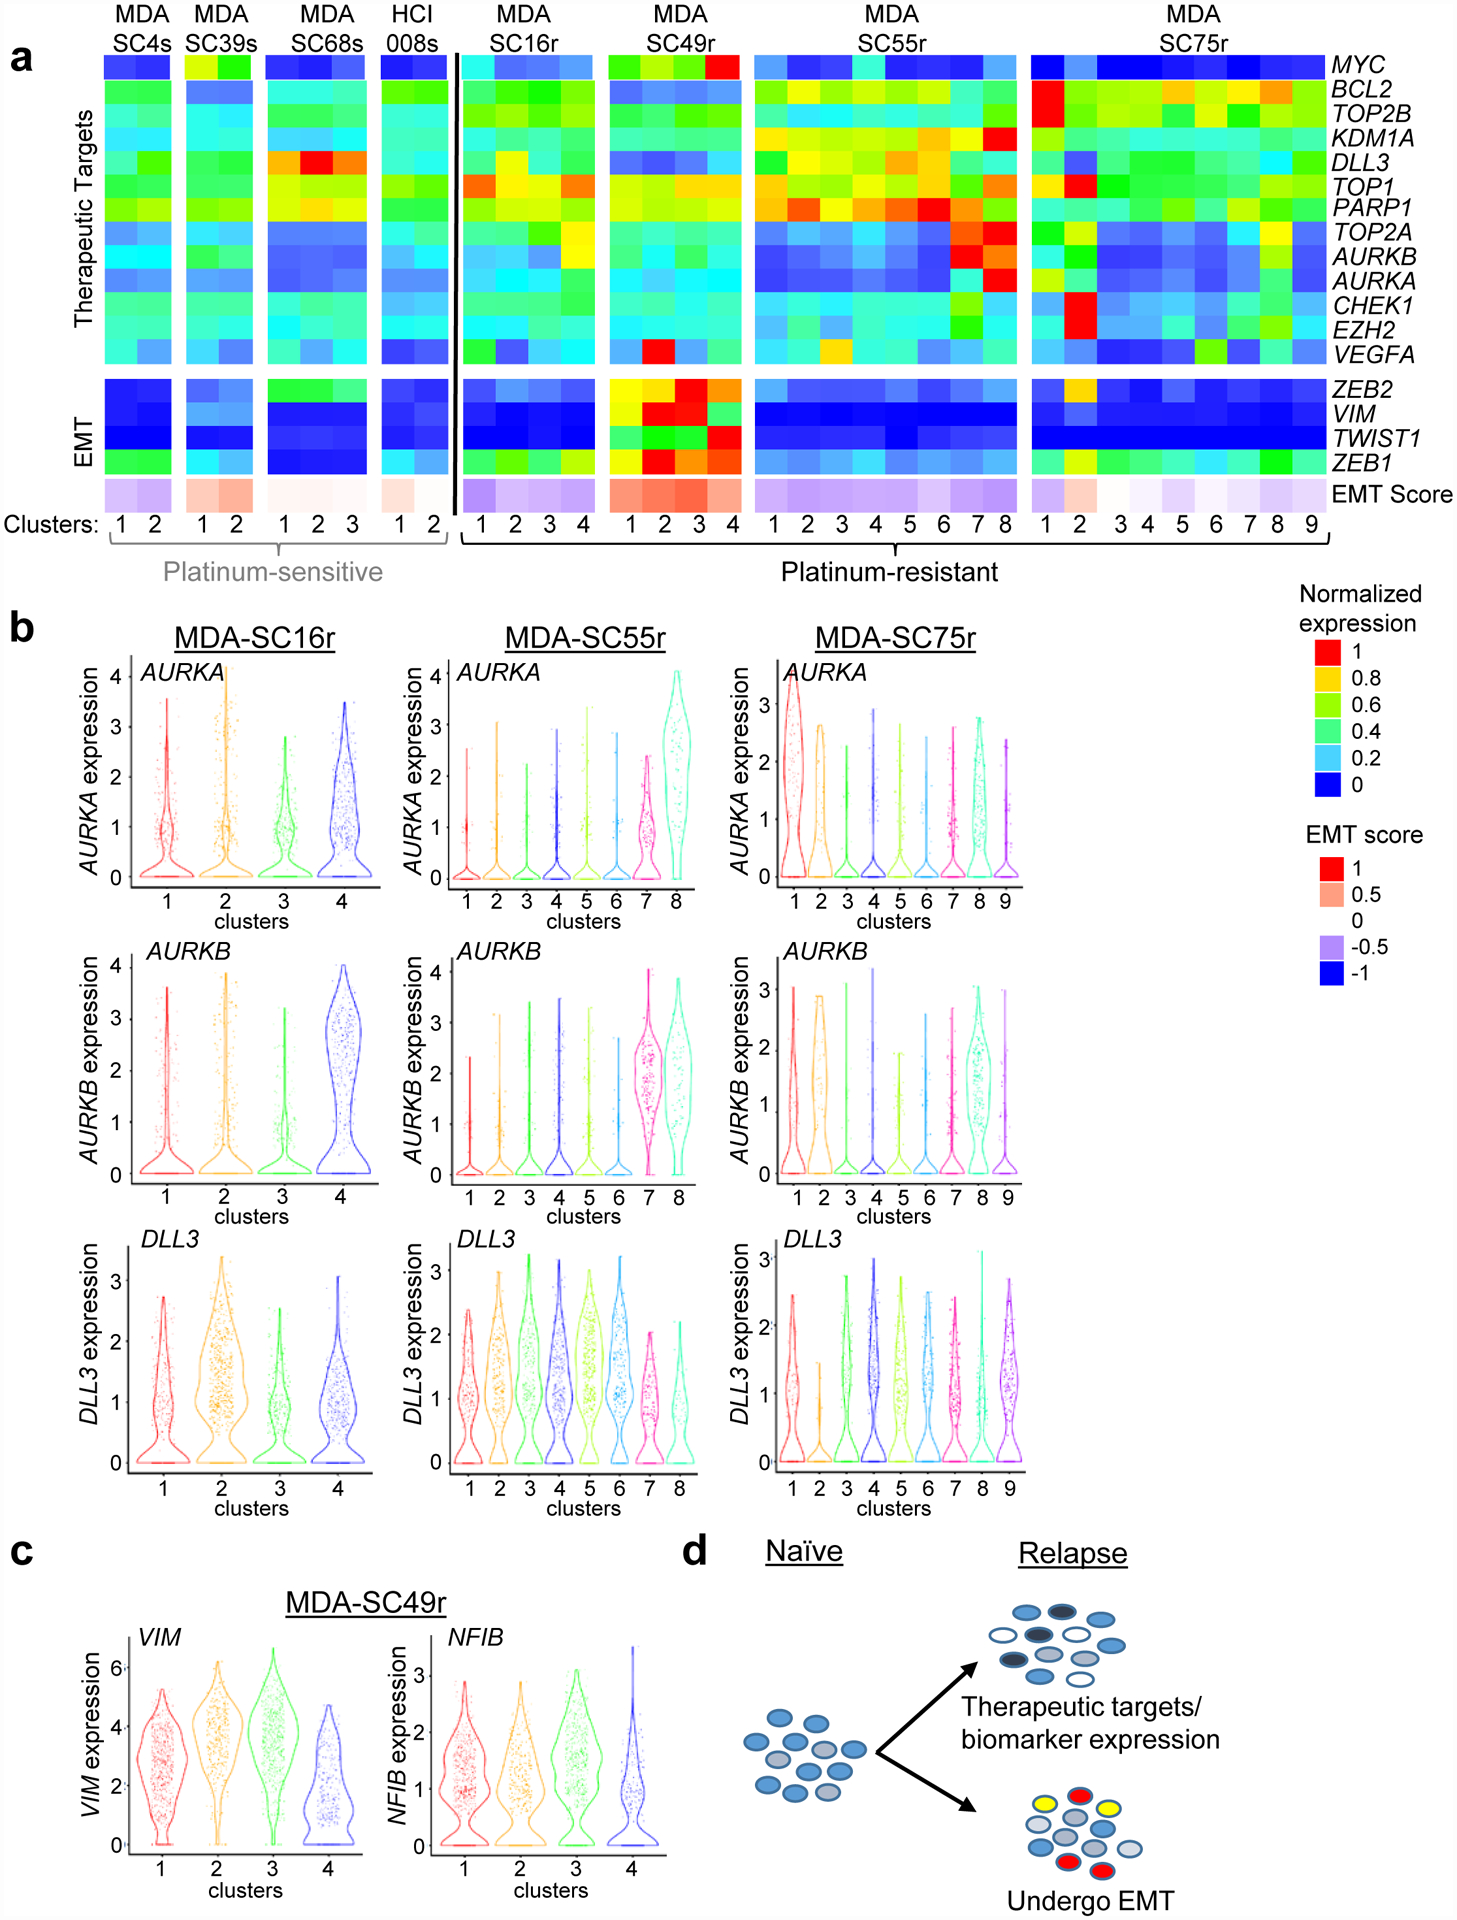
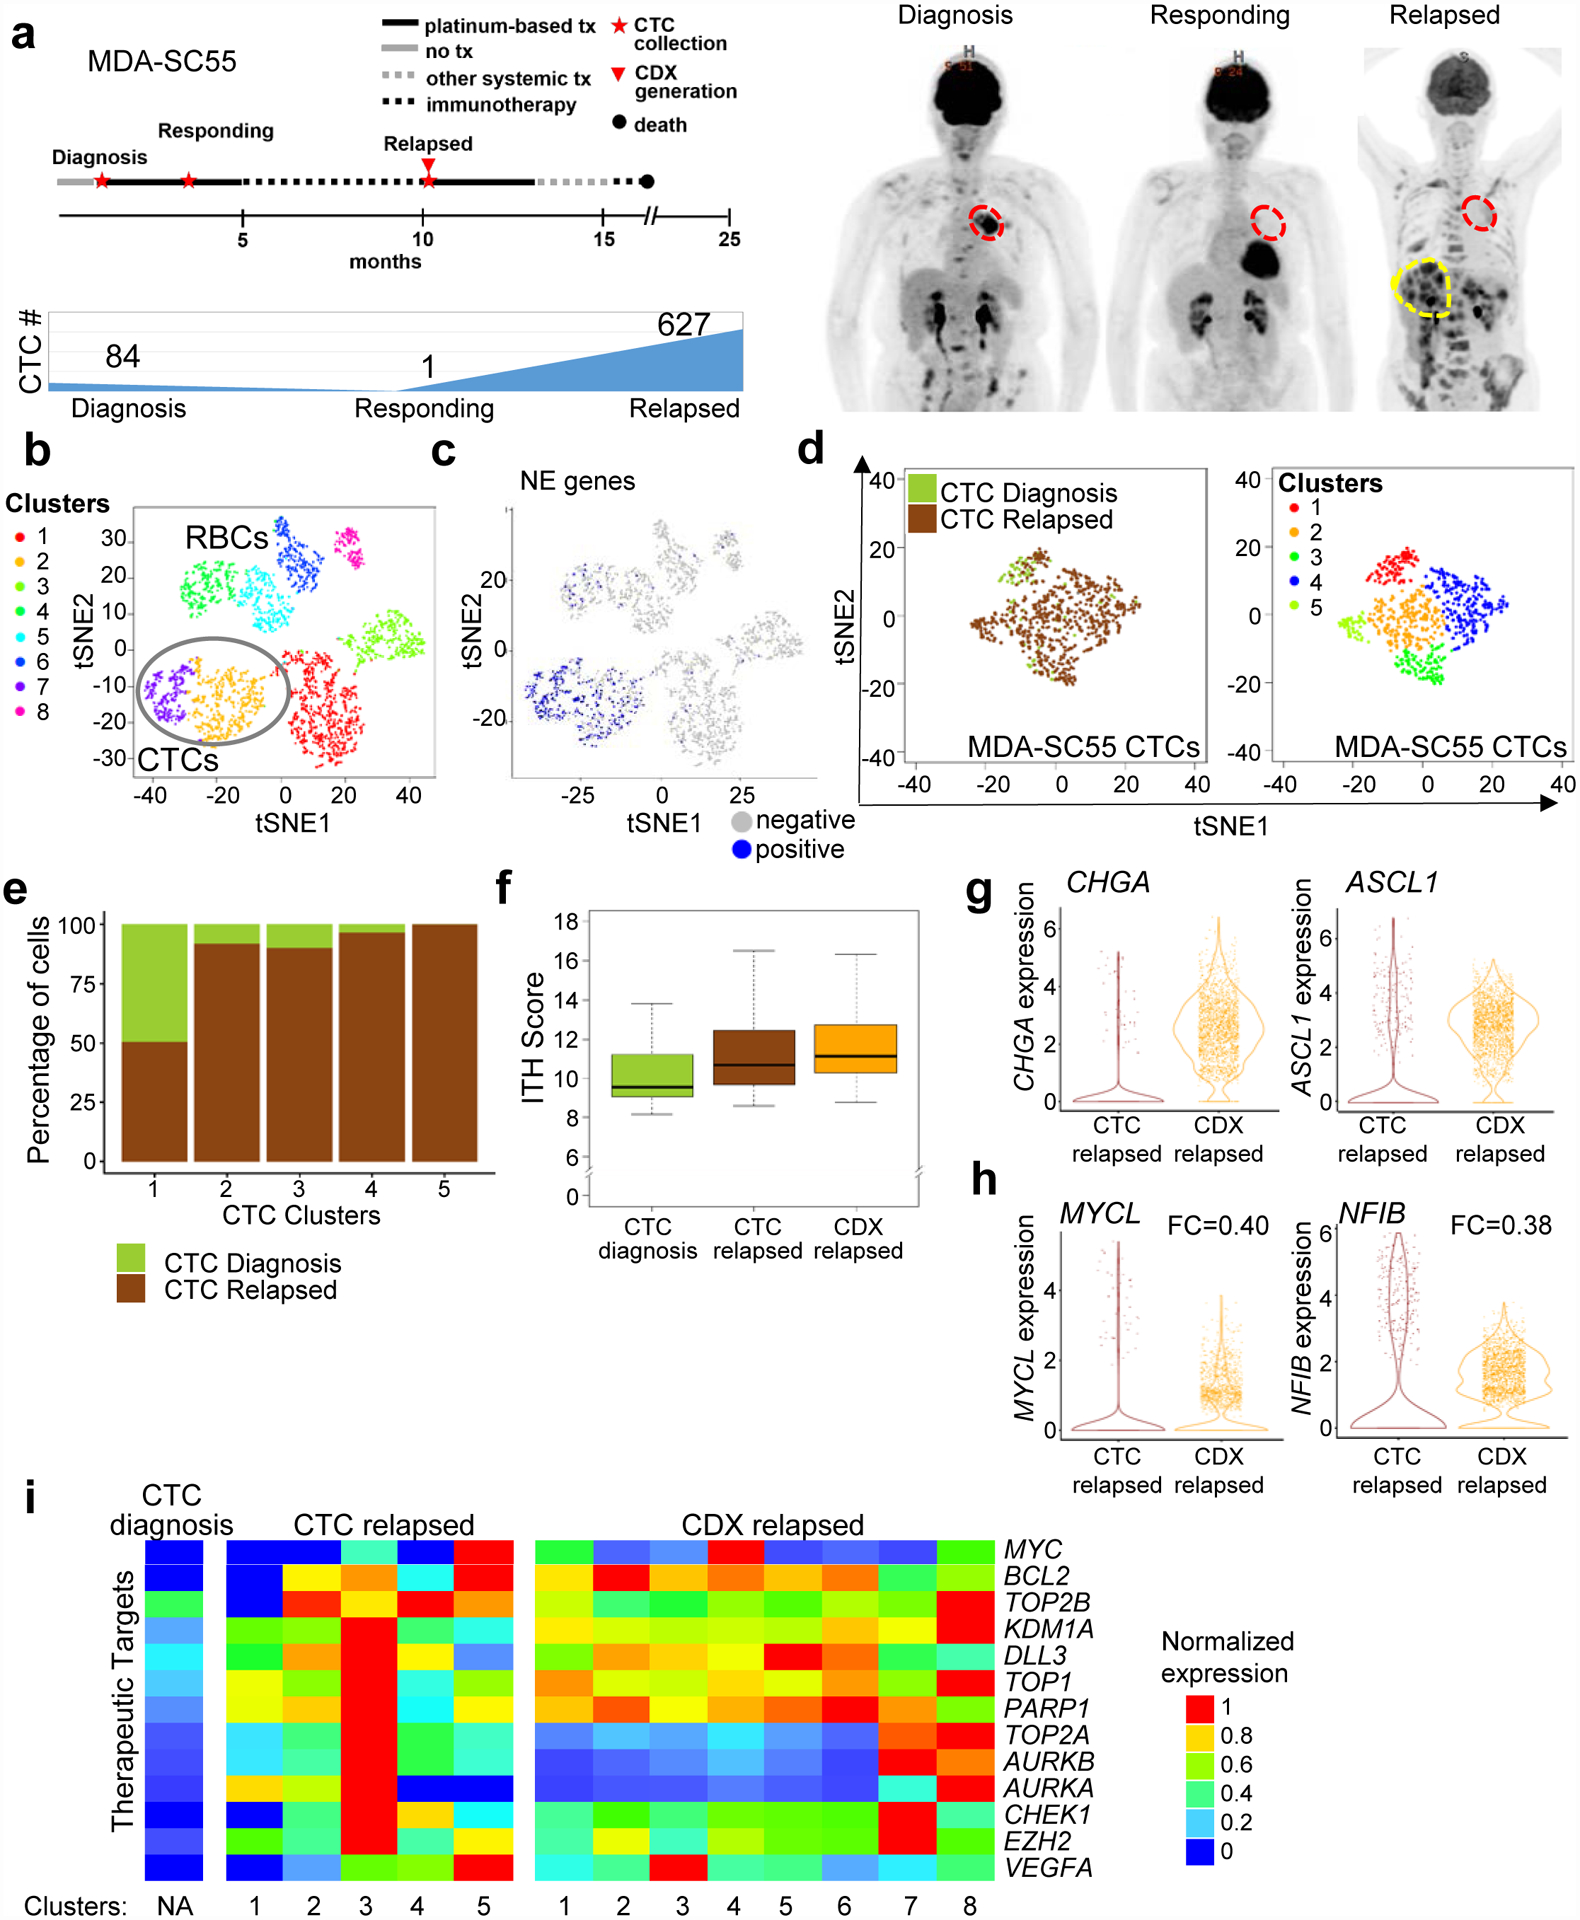
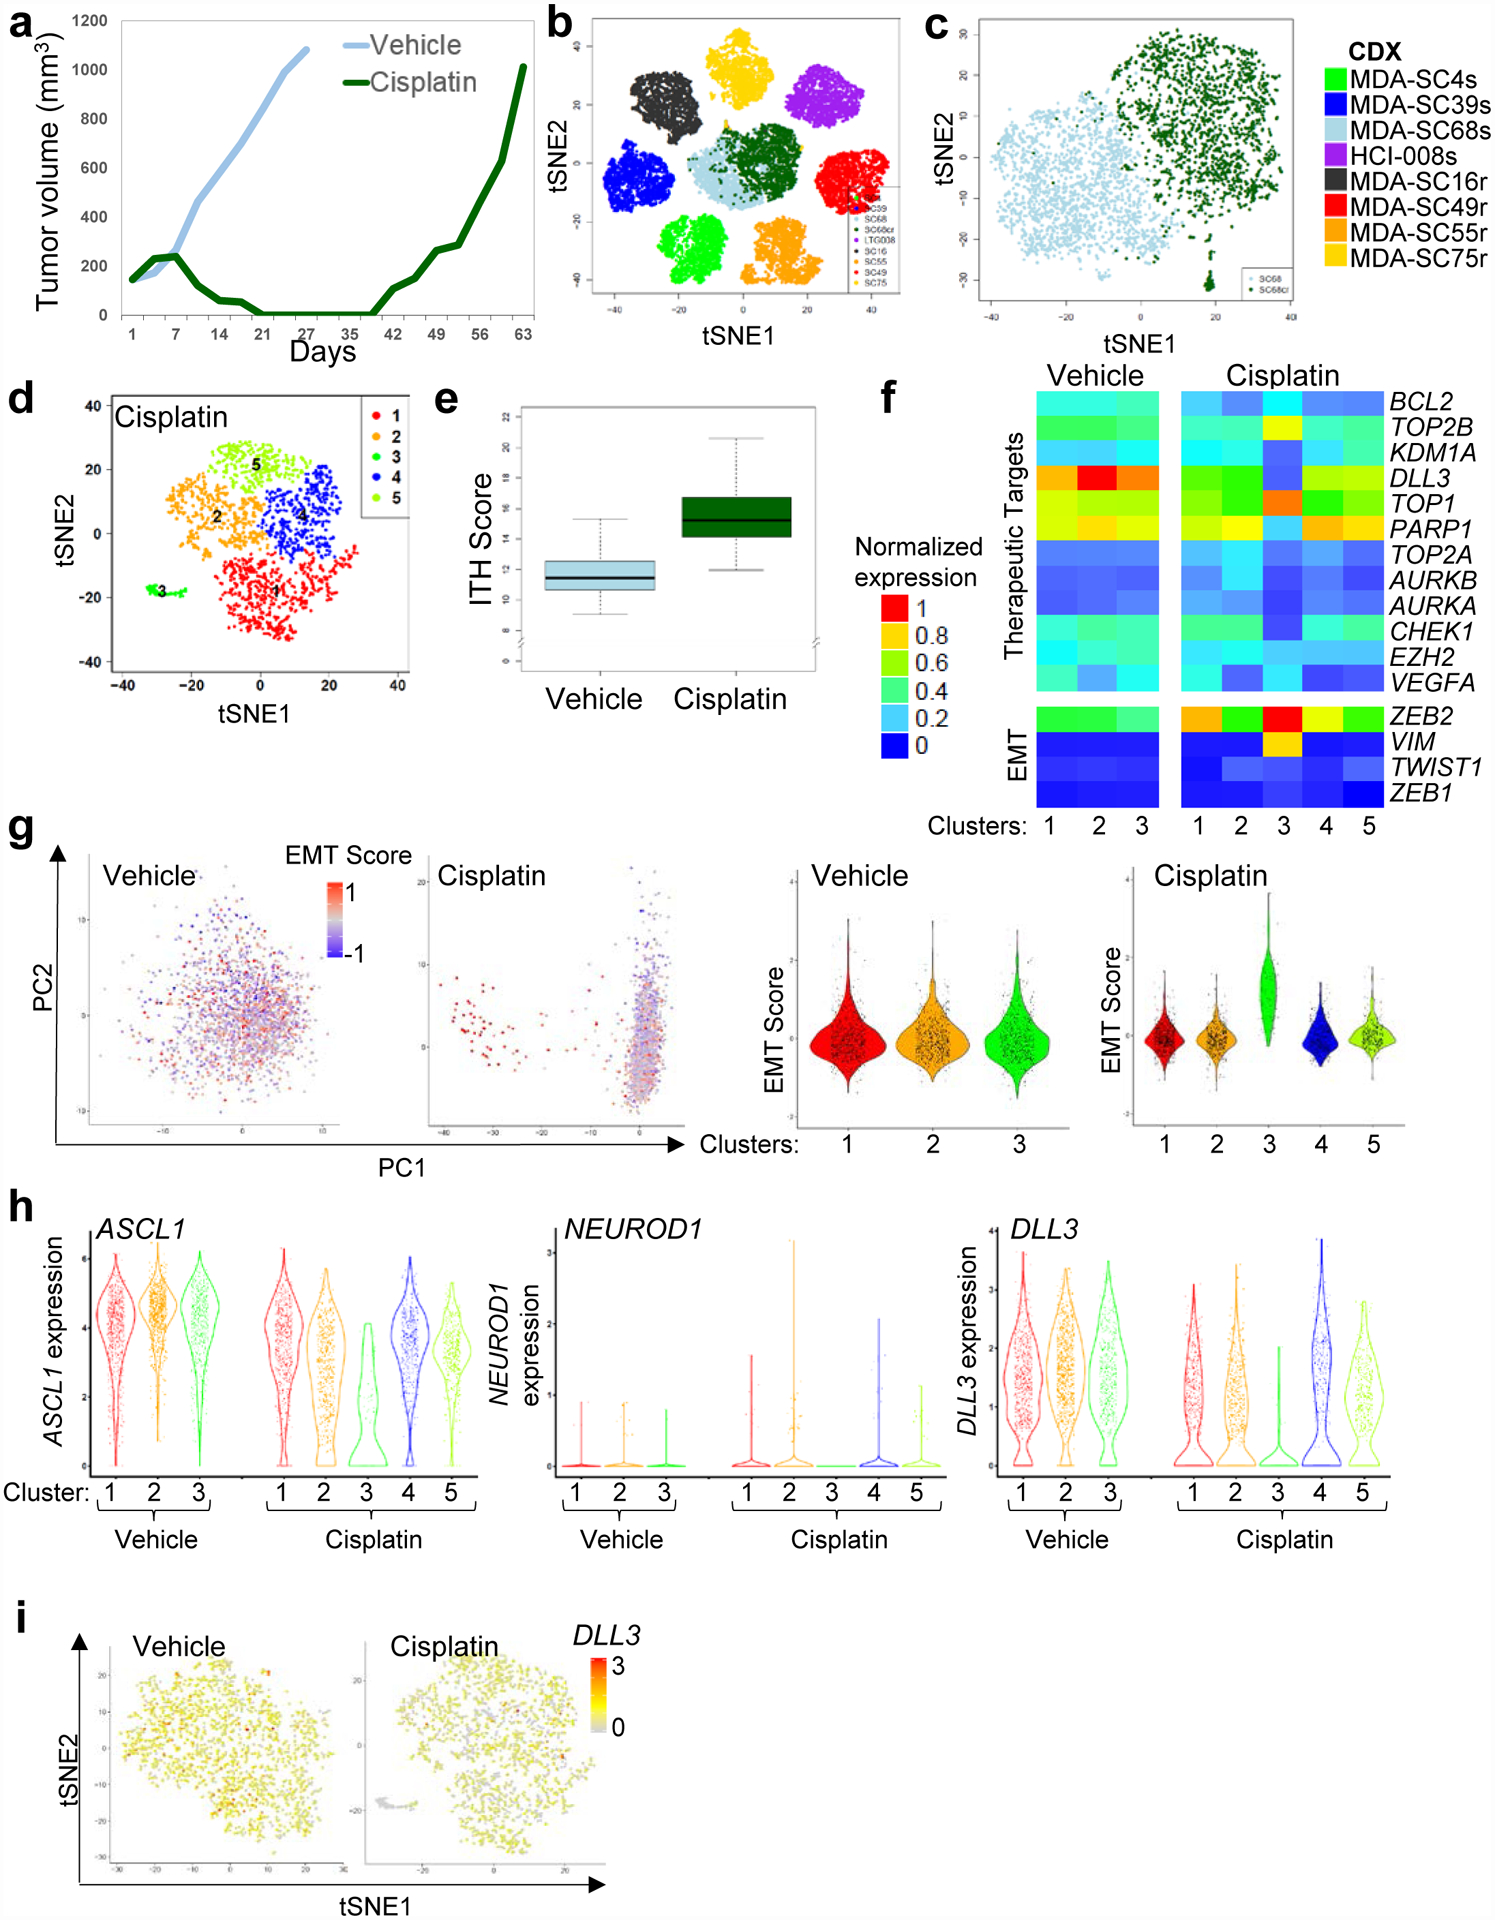
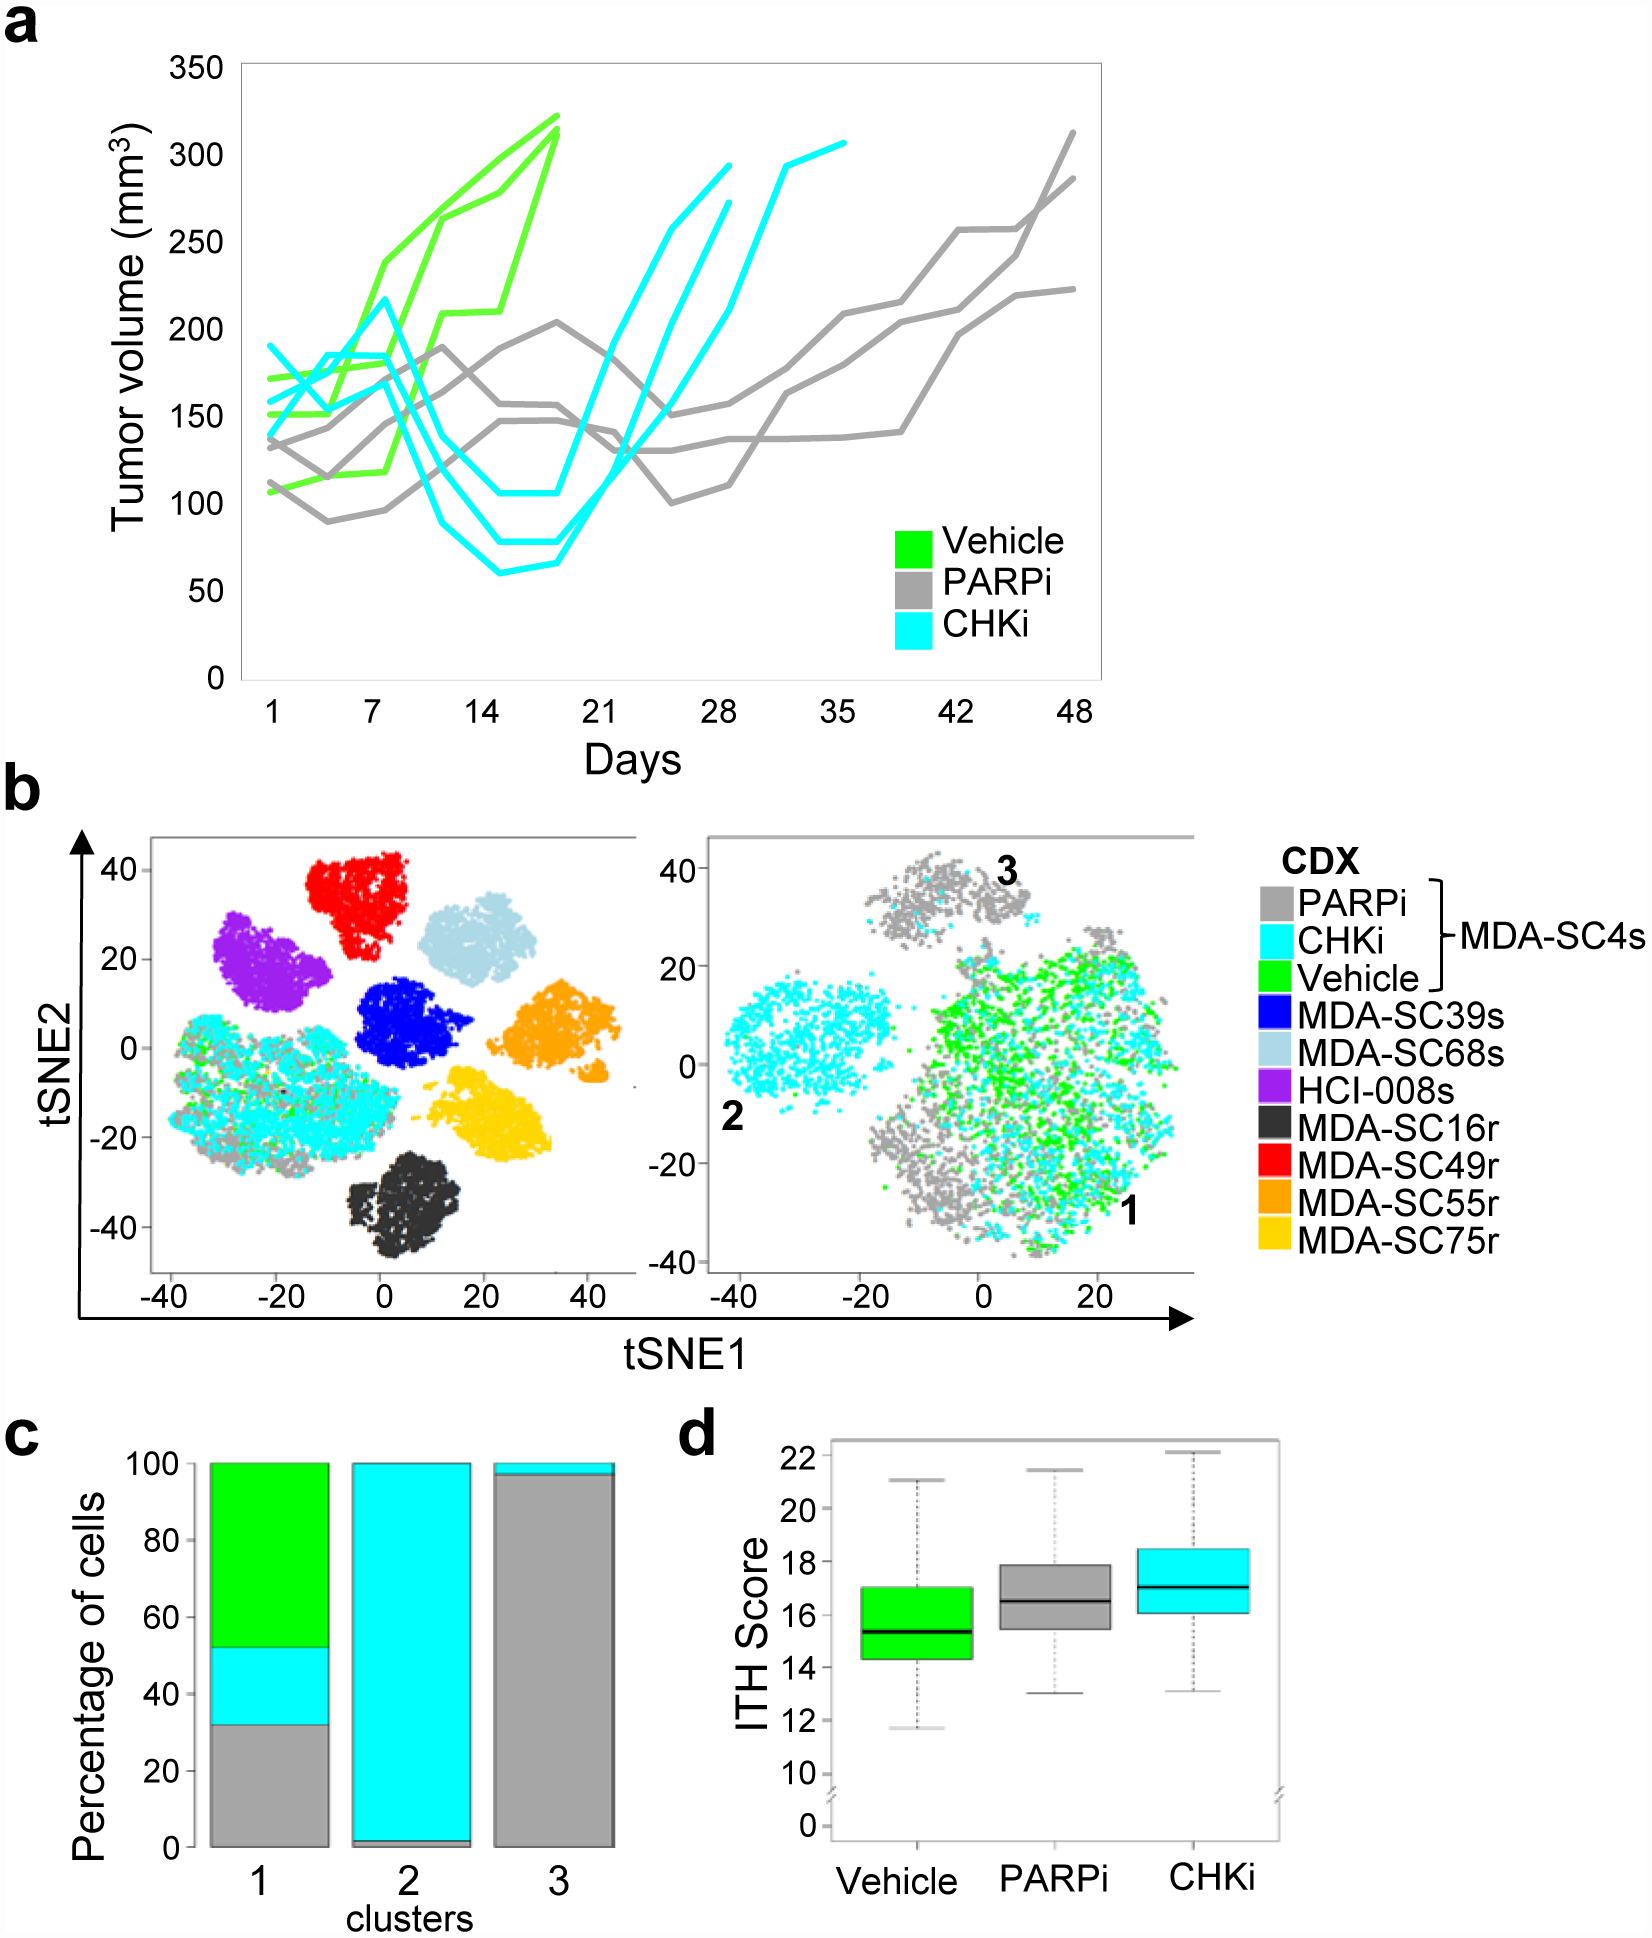
The natural history of small cell lung cancer (SCLC) includes rapid evolution from chemosensitivity to chemoresistance, although mechanisms underlying this evolution remain obscure due to scarcity of post-relapse tissue samples. We generated circulating tumor cell (CTC)-derived xenografts (CDXs) from SCLC patients to study intratumoral heterogeneity (ITH) via single-cell RNAseq of chemo-sensitive and -resistant CDXs and patient CTCs. We found globally increased ITH including heterogeneous expression of therapeutic targets and potential resistance pathways, such as EMT, between cellular subpopulations following treatment-resistance. Similarly, serial profiling of patient CTCs directly from blood confirmed increased ITH post-relapse. These data suggest that treatment-resistance in SCLC is characterized by coexisting subpopulations of cells with heterogeneous gene expression leading to multiple, concurrent resistance mechanisms. These findings emphasize the need for clinical efforts to focus on rational combination therapies for treatment-naïve SCLC tumors to maximize initial responses and counteract the emergence of ITH and diverse resistance mechanisms.

Keywords: CDX; CTC; SCLC; intratumoral heterogeneity; single-cell RNAseq.


Conflict of interest statement

COMPETING INTERESTS STATEMENT L.A.B. serves on advisory committees for AstraZeneca, AbbVie, GenMab, BergenBio, Pharma Mar SA, Sierra Oncology, Merck, Bristol Myers Squibb, Genentech, and Pfizer and has research support from AbbVie, AstraZeneca, GenMab, Sierra Oncology, Tolero Pharmaceuticals. J.V.H. serves on advisory committees for AstraZeneca, Boehringer Ingelheim, Exelixis, Genentech, GSK, Guardant Health, Hengrui, Lilly, Novartis, Spectrum, EMD Serono, and Synta, has research support from AstraZeneca, Bayer, GlaxoSmithKline, and Spectrum and royalties and licensing fees from Spectrum. Otherwise, there are no pertinent financial or non-financial conflicts of interest to report.

Figures

Extended Data Figure 1.
CDXs exhibit common SCLC markers and mutations that are maintained over multiple generations. a, Histological analysis of CDX tumors are consistent with SCLC. Scale bar = 100 μM. b, Expression of NCAM and TTF1 in patient biopsy by staff pathologist review of diagnostic sample matches CDXs. c, Presence of parenchymal brain metastasis, confirmed by staff neuroradiologist and treating physician review, in the cerebellum (indicated by dashed circle) of the patient from which MDA-SC39 was derived. d, Genomic alterations in CDXs. Top panel: mutation load; middle panel: somatic mutations and genomic gain/loss status; lower panel: type of base-pair substitution. e, Mutational status of common SCLC genes and others unique to each CDX are maintained over multiple CDX passages in three separate models. f, Expression heatmap for ASCL1- and NEUROD1-associated genes. g, CDX and PDX models derived from patient SC49 exhibit similar patterns of expression for common SCLC markers, including loss of TTF1 expression. These experiments were repeated in three independent tumors from each model. Scale bar = 100 μM.
Extended Data Figure 2.
ITH among SCLC molecular subtypes. a, t-SNE visualization of NE gene expression status in all CDXs (n=2,000 cells each). b, t-SNE visualization of cell populations from biological replicates of MDA-SC39s and MDA-SC16r obtained from tumors grown in the same passage, but different mice. Note mixing of cell populations indicate that clustering is not due to variations in replicate (n=2,000 cells each). c, Heatmap analysis of NE gene expression indicating that all CDXs are considered high neuroendocrine subtypes. d, Expression of ASCL1 and NEUROD1 in all CDXs by both violin plot to indicate range in expression and feature plot to show abundance (n=2,000 cells each). e, Violin plots indicating expression of MYC family members in the CDXs (n=2,000 cells each). Each dot represents one cell and the violin curve represent the density of the cells at different expression levels. f, EMT score is elevated within MDA-SC39s and MDA-SC49r, which corresponds with increased expression of VIM and decreased EPCAM (n=2,000 cells each).
Extended Data Figure 3.
Validation of cluster calls and visualization. a, Silhouette analysis to determine cluster number in each of the eight CDXs. b, UMAP visualization of the clusters in all CDXs. c, Barplot of variations of absolute normalized enrichment scores (NES) for hallmark pathways in GSEA analysis in sensitive clusters (blue) and resistant clusters (red). The variation of pathway enrichment is higher in resistant clusters than sensitive clusters by one-sided Wilcoxon rank sum test (P-value=2.9e-6; n=21 pathways).
Extended Data Figure 4.
CDX copy number and expression of DNA repair genes between clusters. a,b, Inferred copy number between clusters in MDA-SC16r (a) and MDA-SC49r (b). c, Expression heatmap of genes associated with DNA repair in all CDX clusters. d, Violin plots indicating range of expression of several therapeutic targets within individual clusters. AURKA, AURKB and DLL3 were relatively unchanged between clusters. MDA-SC4s: n=978, 1022 cells for clusters 1–2; MDA-SC39s: n=1172, 828 cells for clusters 1–2; MDA-SC68s: n=733, 704, 563 cells for clusters 1–3; HCI-008s: n=596, 1,404 cells for clusters 1–2; MDA-SC49r: n=683, 317, 652, 348 cells for clusters 1–4. Each dot represents one cell and the violin curve represent the density of the cells at different expression levels.
Extended Data Figure 5.
Percentage of cells expressing epithelial, NE genes (e.g., UCHL1, NCAM1, SYP, and CHGA) or SCLC lineage-specific genes (e.g., ASCL1, NEUROD1, etc.) in the CTC population and non-CTC populations. Validation of CTC identification within a patient liquid biopsy by positive expression of epithelial, NE and SCLC genes.
Extended Data Figure 6.
Emergence of a mesenchymal cell cluster following cisplatin-treatment. Violin plot of VIM (a) and EXPCAM (b) expression in the clusters of MDA-SC68s vehicle and cisplatin-treated CDXs. MDA-SC68 vehicle: n=733, 704, 563 cells for clusters 1–3; MDA-SC68 cisplatin: n=635, 489, 71, 467, 338 cells for clusters 1–5. Each dot represents one cell and the violin curve represent the density of the cells at different expression levels.
Figure 1.
Figure 1.
SCLC CDXs mimic patient disease at the single-cell transcriptional level and by platinum-response. a, Representation of patient clinical course including the time point at which blood was collected for CDX generation (red circles). Arrows indicate treatment and are drawn to scale. b, Histological images of leptomeningeal disease detected in MDA-SC39, including characterization of standard SCLC markers. The presence of leptomeningeal disease was detected in one of five mice whose brains were examined. Scale bars = 1mm, 100 μm, or 10 μm. c, Waterfall plot of maximal baseline change from treatment of CDXs with cisplatin. MDA-SC4s, MDA-SC39s, MDA-SC68s and HCI-008s are platinum-sensitive, while MDA-SC16r, MDA-SC49r, MDA-SC55r, and MDA-SC75r are platinum-resistant. d, Schematic describing method for performing single-cell RNAseq on CDXs. e, Cells from each CDX are more similar to themselves than to other models. t-SNE analysis of eight CDXs. f, Violin plots indicating range of expression of NCAM1, SYP, CHGA, and NKX2–1 (TTF1) in single cells from each CDX. Each dot represents one cell and the violin curve represent the density of the cells at different expression levels. g, Expression pattern of ASCL1/NEUROD1/POU2F3/YAP1 genes within each CDX. h, t-SNE feature plots showing heterogeneity of expression of MYC, MYCL, and MYCN in all CDXs. In e, f, and g n=2,000 cells.
Figure 2.
Figure 2.
Platinum-resistant disease is associated with increased ITH. a, Platinum-resistant CDXs exhibit a higher ITH score than platinum-sensitive CDXs, as determined by two-sided Wilcoxon rank sum test. No adjustments were made for multiple comparisons (P<2.2e-16; n=2,000 cells per CDX). b, Gene expression dispersion for platinum-sensitive and platinum-resistant CDXs by two-sided Wilcoxon rank sum test (P=0.05; n=8 CDX models). c, t-SNE visualization of cell subpopulations from individual CDXs (n=2,000 per CDX. d, Expression heatmap of common and model specific differential genes for ASCL1-driven sensitive CDXs (MDA-SC4s, MDA-SC39s, MDA-SC68s) and resistant CDXs (MDA-SC16r, MDA-SC55r, MDA-SC75r). The differential genes were identified by intersection of up-regulated genes in resistant CDX compared with each sensitive CDXs. Genes were identified that were commonly upregulated in at least two resistant CDXs (GRP, TCF4, HES6), or specifically in MDA-SC16r (CDKN2A, NKX2–1, STAT1, TOP2A, NFIB, NEAT1), MDA-SC55r (ASCL2, KDM1A, MALAT1), or MDA-SC75r (PGAM2, NBL1). The statistical cutoffs are set to adjusted p-value <0.05 (two-sided Wilcoxon rank sum test) and log2 fold change > 0.7 (n=6 CDX models). e, Gene set enrichment analysis with NES and FDR q-values for hallmark gene sets associated with clusters in all eight CDXs. No statistical method was used to predetermine sample size. GSEA Kolmogorov-Smirnov test. P-values were adjusted for multiple comparisons. In a, b center lines show the medians; box limits indicate the 25th and 75th percentiles; whiskers extend 1.5 times the interquartile range from the 25th and 75th percentiles.
Figure 3.
Figure 3.
Platinum-resistance is associated with heterogeneous expression of therapeutic targets or EMT-related genes within specific clusters. a, Expression of specific therapeutic targets, EMT-related genes, or EMT score in the clusters from all eight CDXs. Little variation was detected in clusters from platinum-sensitive CDXs. b, Violin plots of expression of several therapeutic targets (AURKA, AURKB and DLL3) within clusters from three platinum resistant CDXs (MDA-SC16r, MDA-SC55r and MDA-SC75r). MDA-SC16r: n=438, 557, 554, 451 cells for clusters 1–4; MDA-SC55r: n=271, 216, 360, 365, 384, 190, 148, 66 cells for clusters 1–8; MDA-SC75r: n=109, 69, 228, 453, 233, 187, 296, 207, 218 cells for clusters 1–9. c, Violin plots of VIM and NFIB expression within individual clusters from MDA-SC49r. Each dot represents one cell and the violin curve represent the density of the cells at different expression levels. MDA-SC49r: n=683, 317, 652, 348 cells for clusters 1–4. d, Schematic indicating that changes in gene expression in the platinum-sensitive cells gives rise to variation in either therapeutic targets or EMT-related genes.
Figure 4.
Figure 4.
Serial single-cell RNAseq analysis of patient CTCs revealed similar transcriptional heterogeneity to a paired CDX. a, Representation of patient MDA-SC55 clinical course at the time blood was collected for CTC analysis and CDX generation. Patient MDA-SC55 body scans performed at the time blood was collected (red indicates lung primary tumor; yellow indicates liver metastases) and CTC numbers at the time of collection. These samples were collected from one patient along the course of treatment and represent an isolated collection at a specific time point. b, t-SNE plot of pooled MDA-SC55 cells at diagnosis, responding and relapsed time points revealed eight separate clusters, cluster 2 and 7 were identified as CTCs (circled). c, t-SNE plot of cells expressing NE genes to identify CTCs. d, t-SNE plots of all CTCs by time point (at diagnosis [green], and at relapse [brown]; left) and t-SNE visualization of CTC cell clusters from all time points (n=712 cells). e, Contribution of cells from the diagnosis or relapsed time points within each of the CTC clusters. f, CTCs and CDX cells from the relapsed time point have a higher ITH score by Kruskal–Wallis test than CTCs collected at diagnosis (diagnosis CTCs vs. relapsed CTCs and diagnosis CTCs vs. relapsed CDX, P=3.0e-17; diagnosis CTCs: n=84 cells). Center lines show the medians; box limits indicate the 25th and 75th percentiles; whiskers extend 1.5 times the interquartile range from the 25th and 75th percentiles. g, Violin plots of CHGA and ASCL1 expression in the relapsed CTCs and CDX cells. h, Violin plots depicting decreased expression of MYCL and NFIB in the CDX cells compared to CTCs at relapse by two-sided Wilcoxon rank-sum test (P<2.2e-16 for both). Each dot represents one cell and the violin curve represent the density of the cells at different expression levels. i, Expression patterns of therapeutic targets in clusters from the CTCs and CDX following relapse. CTCs were normalized separately from CDX cells. In b and c, n=2,719 cells. In f, g and h relapsed CTCs: n=627 cells, relapsed CDX: n=2,000 cells.
Figure 5.
Figure 5.
Increased ITH and emergence of cell populations with EMT signatures occur following cisplatin relapse. a, Tumor growth for MDA-SC68s vehicle or cisplatin-treated mice (n=1 per treatment). Tumors were collected when tumor volume reached approximately 1,000 mm2. b, Pooled t-SNE plot of the MDA-SC68s vehicle and cisplatin-treated tumors in combination with the seven other CDXs. c, t-SNE visualization of the MDA-SC68s vehicle and cisplatin-treated CDXs. d, t-SNE plot of cell clusters in cisplatin-relapsed MDA-SC68s cells. e, Cisplatin-treated cells have an increased ITH score compared to vehicle cells by two-sided Wilcoxon rank sum test (P<2.2e-16). Center lines show the medians; box limits indicate the 25th and 75th percentiles; whiskers extend 1.5 times the interquartile range from the 25th and 75th percentiles. f, Expression of specific therapeutic targets and EMT-related genes the clusters from vehicle or cisplatin-relapsed MDA-SC68s cells. g, Left panel: principal component analysis of MDA-SC68s cisplatin-treated cells identified the first component to be associated with EMT score in MDA-SC68s cisplatin-treated cells, but not in vehicle-treated cells. Violin plot of the EMT score of individual cells within each cluster indicate that cells with the highest EMT score were located in cluster 3 of the MDA-SC68s cisplatin-treated tumor. MDA-SC68 vehicle: n=733, 704, 563 cells for clusters 1–3; MDA-SC68 cisplatin: n=635, 489, 71, 467, 338 cells for clusters 1–5. h, Right panel: Violin plots of ASCL1, NEUROD1, and DLL3 expressions within the clusters from MDA-SC68s vehicle and cisplatin-treated tumors. ASCL1 and DLL3 were expressed at lower levels in the cisplatin-treated sample (P<0.0001 for each). MDA-SC68 vehicle: n=733, 704, 563 cells for clusters 1–3; MDA-SC68 cisplatin: n=635, 489, 71, 467, 338 cells for clusters 1–5. Each dot represents one cell and the violin curve represent the density of the cells at different expression levels. i, t-SNE visualization of DLL3 expression in vehicle and cisplatin-treated cells. In b, c, d, e, and i, n=2,000 cells each.
Figure 6.
Figure 6.
Treatment-resistance to DNA damaging targeted therapies resulted in the emergence of new, therapy-specific clusters. a, Tumor growth for MDA-SC4s vehicle, PARPi-treated (talazoparib), and CHKi-treated (prexasertib) mice (n=3 mice per treatment). Tumors were collected when tumor volume doubled from onset of treatment. b, Pooled t-SNE plot of the MDA-SC4 vehicle, PARPi-relapsed and CHKi-relapsed cells in combination with all seven other CDXs (MDA-SC39s, MDA-SC68s, HCI-008s, MDA-SC16r, MDA-SC49r, MDA-SC55r and MDA-SC75r; n=2,000 cells each). Emergence of unique clusters were detected following relapse to PARPi or CHKi. t-SNE visualization of cell populations from MDA-SC4 vehicle, PARPi- and CHKi-relapsed tumors form three clusters. c, Percentage of cells from MDA-SC4 vehicle, PARPi-relapsed and CHKi-relapsed samples within the clusters. d, ITH score was higher in CHKi-relapsed (P=4.4e-65) or PARPi-relapsed (P=7.5e-132) samples compared to vehicle samples by two-sided Wilcoxon rank sum test (n=2,000 cells each). Center lines show the medians; box limits indicate the 25th and 75th percentiles; whiskers extend 1.5 times the interquartile range from the 25th and 75th percentiles.

Comment in

Similar articles

Cited by

References

    1. Horn L et al. First-Line Atezolizumab plus Chemotherapy in Extensive-Stage Small-Cell Lung Cancer. N Engl J Med 379, 2220–2229, doi:10.1056/NEJMoa1809064 (2018). - DOI - PubMed
    1. in H. R. 733 (ed Senate and House of Representatives of the United States of America in Congress assembled) (2012).
    1. Hodgkinson CL et al. Tumorigenicity and genetic profiling of circulating tumor cells in small-cell lung cancer. Nature medicine 20, 897–903, doi:10.1038/nm.3600 (2014). - DOI - PubMed
    1. Drapkin BJ et al. Genomic and Functional Fidelity of Small Cell Lung Cancer Patient-Derived Xenografts. Cancer discovery, doi:10.1158/2159-8290.CD-17-0935 (2018). - DOI - PMC - PubMed
    1. Chalishazar MD et al. MYC-Driven Small-Cell Lung Cancer is Metabolically Distinct and Vulnerable to Arginine Depletion. Clinical cancer research : an official journal of the American Association for Cancer Research, doi:10.1158/1078-0432.CCR-18-4140 (2019). - DOI - PMC - PubMed

Publication types

MeSH terms