. 2021 Jan 19;2(1):100188.
doi: 10.1016/j.xcrm.2020.100188.

Targeted brachyury degradation disrupts a highly specific autoregulatory program controlling chordoma cell identity

Affiliations

Targeted brachyury degradation disrupts a highly specific autoregulatory program controlling chordoma cell identity

Hadley E Sheppard et al. Cell Rep Med. .

Abstract

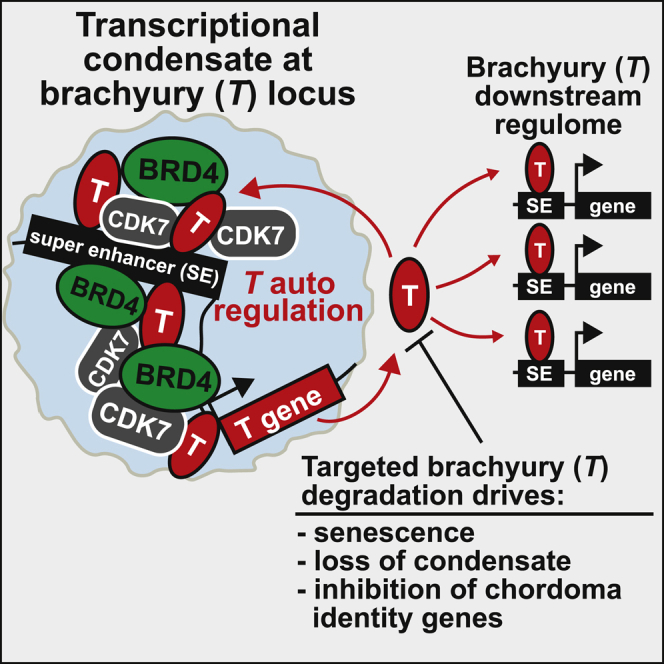
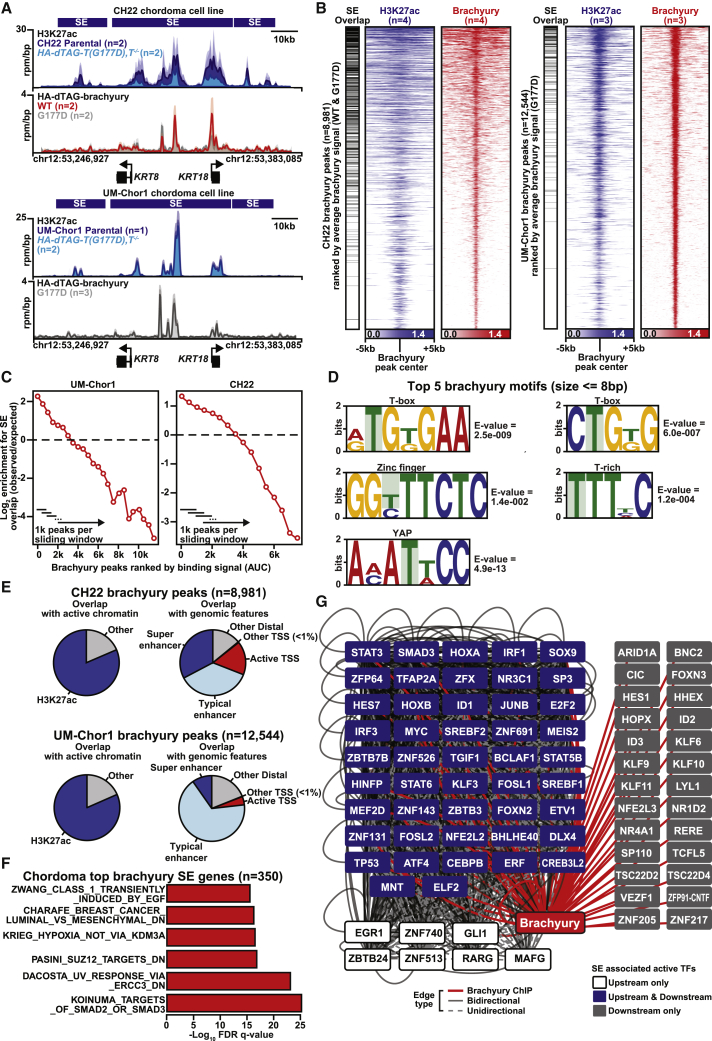
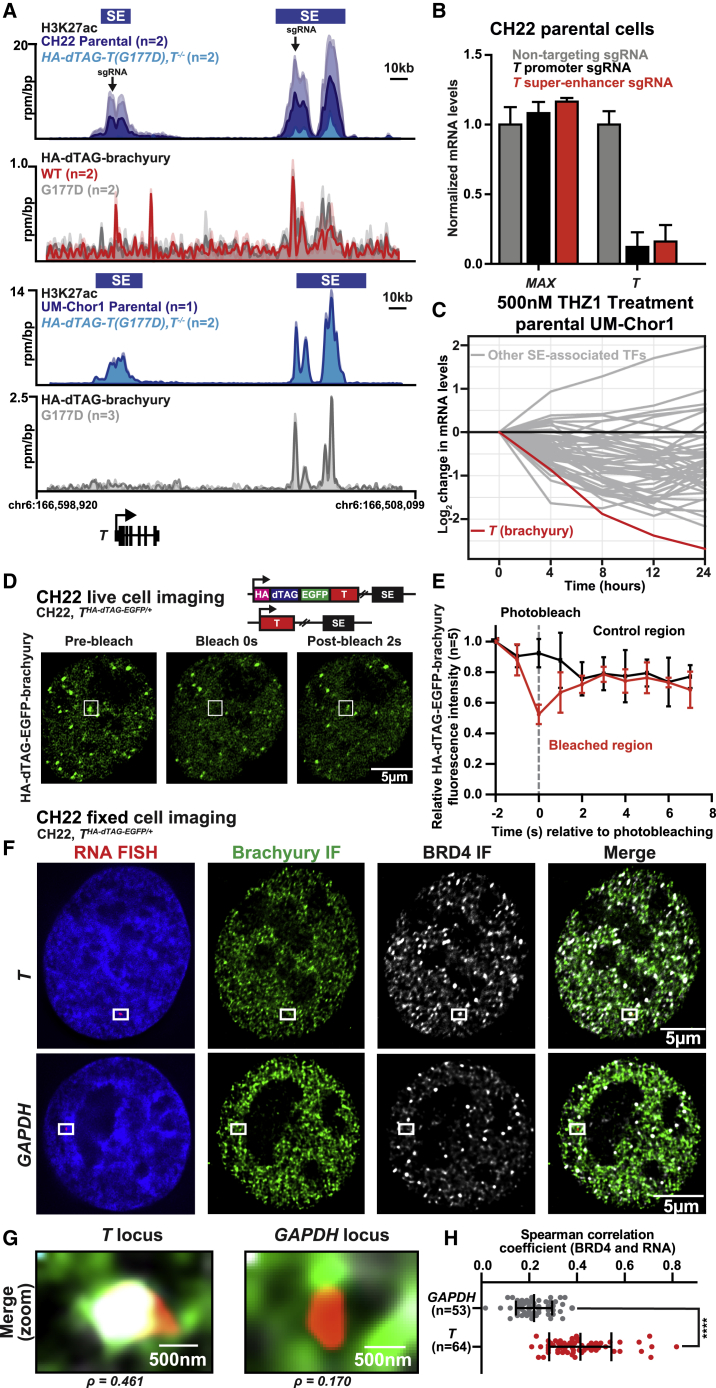
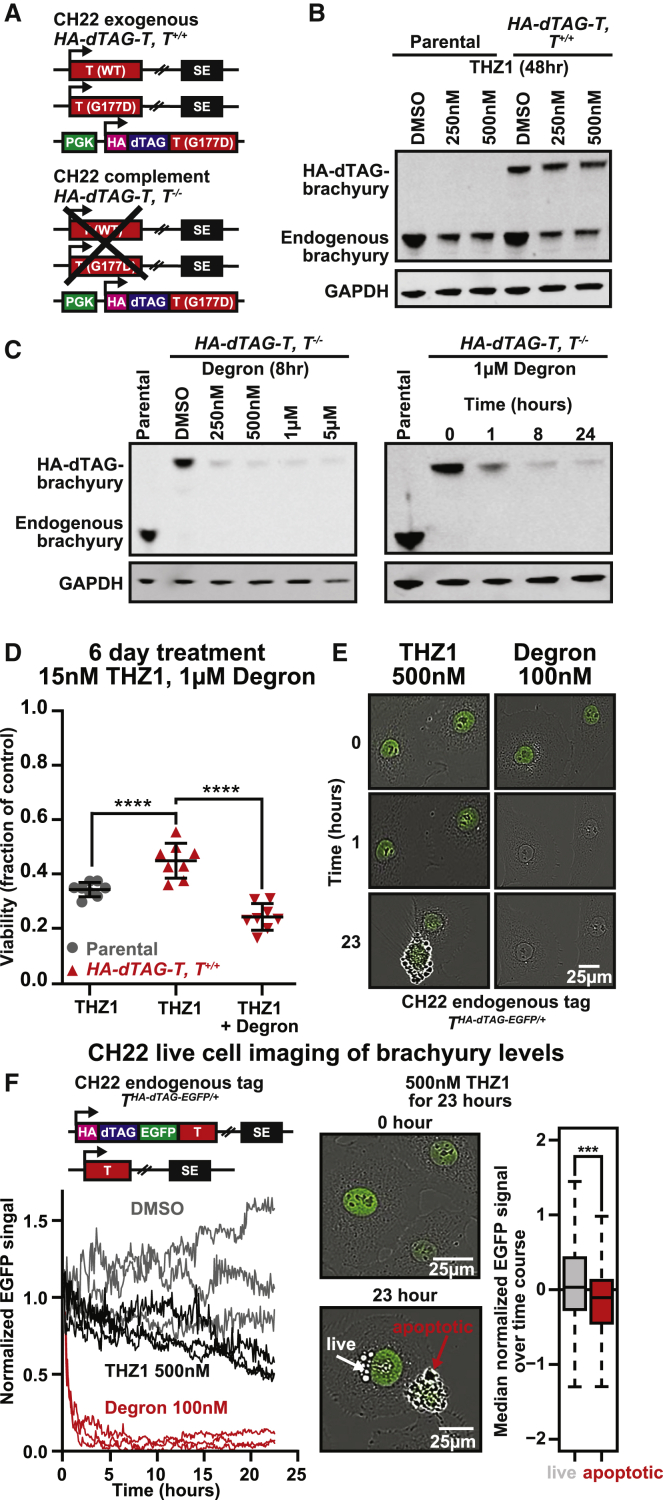
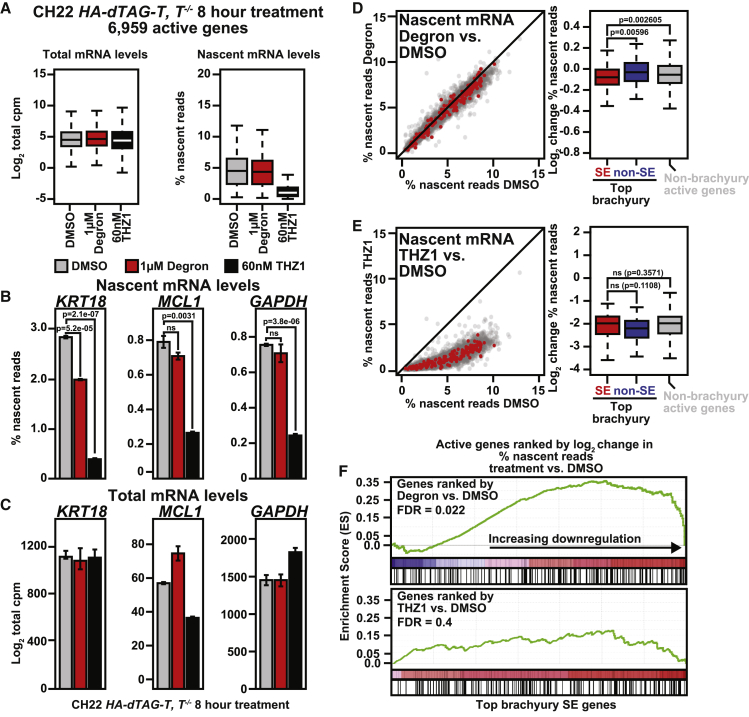
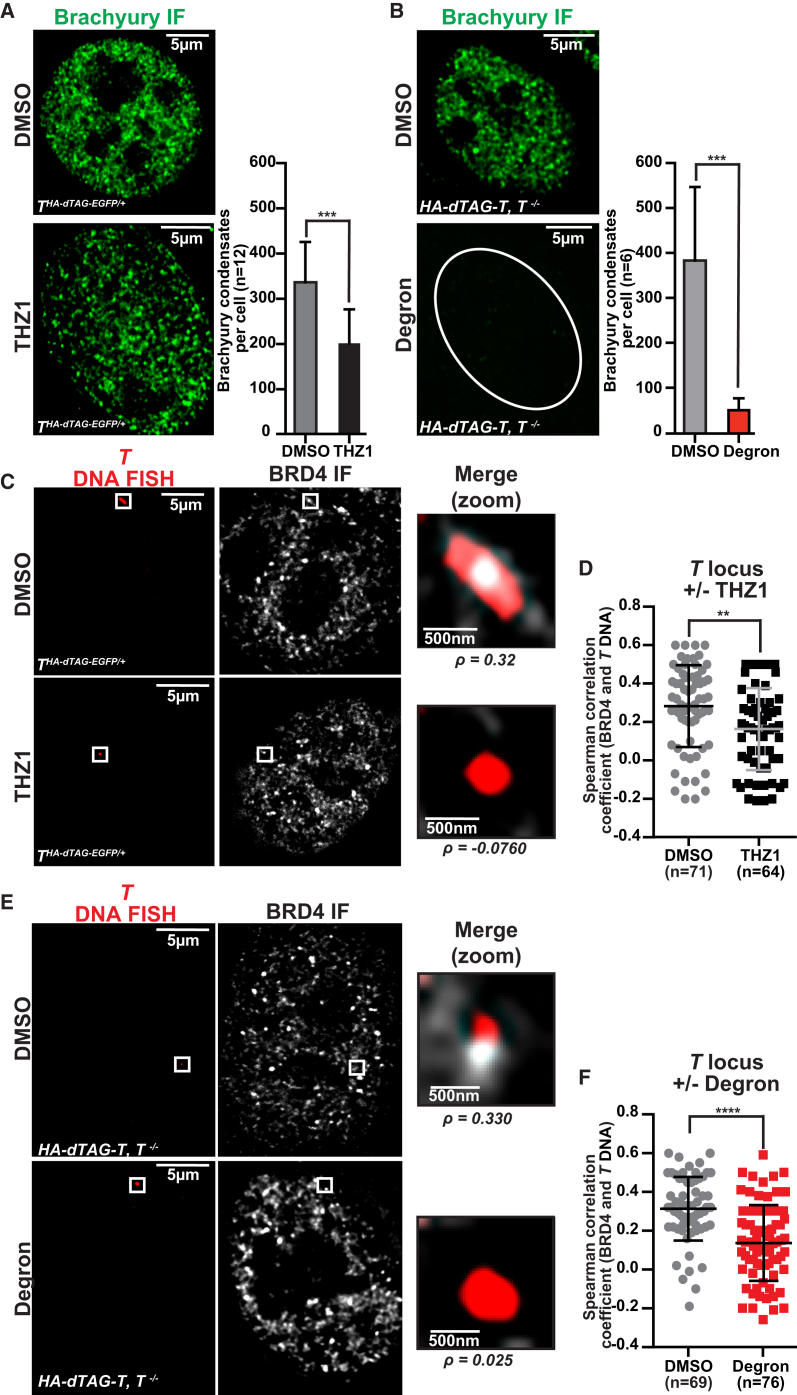
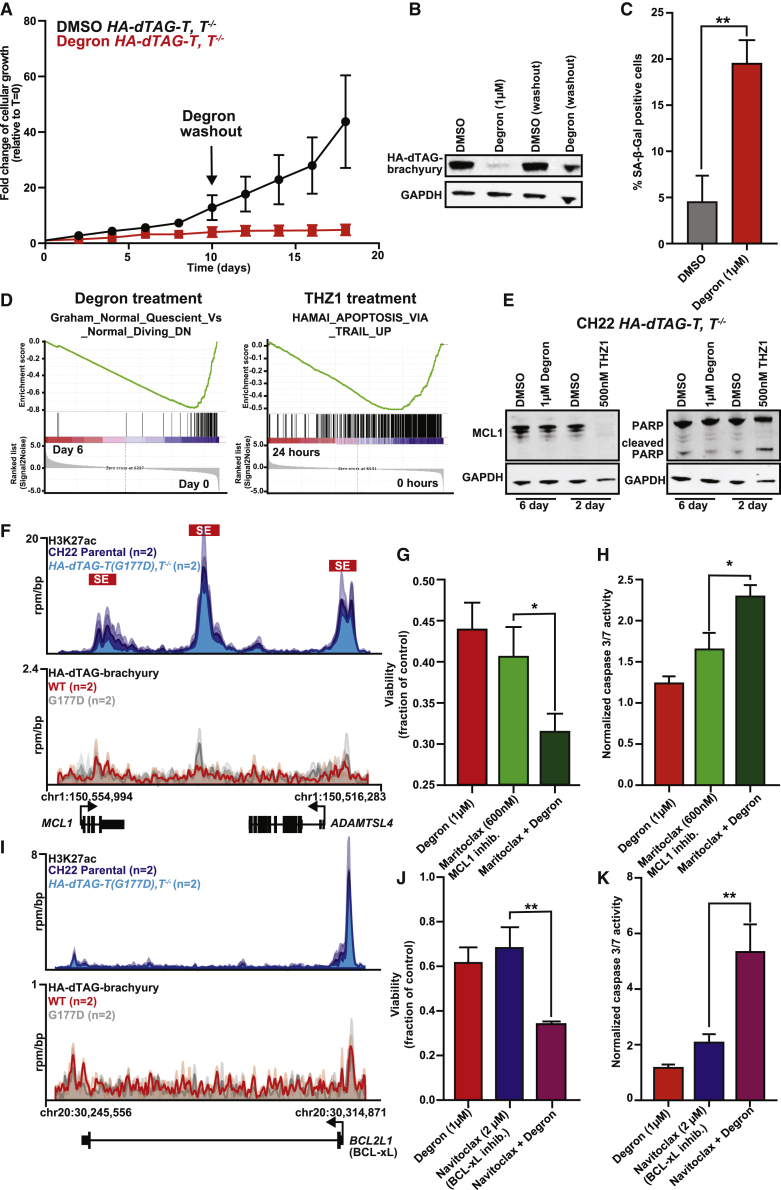
Chordomas are rare spinal tumors addicted to expression of the developmental transcription factor brachyury. In chordomas, brachyury is super-enhancer associated and preferentially downregulated by pharmacologic transcriptional CDK inhibition, leading to cell death. To understand the underlying basis of this sensitivity, we dissect the brachyury transcription regulatory network and compare the consequences of brachyury degradation with transcriptional CDK inhibition. Brachyury defines the chordoma super-enhancer landscape and autoregulates through binding its super-enhancer, and its locus forms a transcriptional condensate. Transcriptional CDK inhibition and brachyury degradation disrupt brachyury autoregulation, leading to loss of its transcriptional condensate and transcriptional program. Compared with transcriptional CDK inhibition, which globally downregulates transcription, leading to cell death, brachyury degradation is much more selective, inducing senescence and sensitizing cells to anti-apoptotic inhibition. These data suggest that brachyury downregulation is a core tenet of transcriptional CDK inhibition and motivates developing strategies to target brachyury and its autoregulatory feedback loop.

Keywords: brachyury; chordoma; cyclin-dependent kinase; phase separation; super-enhancer; targeted degradation; transcription; transcription factor; transcriptional condensate; transcriptional inhibition.


Conflict of interest statement

C.Y.L. is an inventor of intellectual property licensed to Syros Pharmaceuticals, and is the Vice President of Biology and a shareholder of Kronos Bio, Inc. S.L.S. is a shareholder and serves on the Board of Directors of Jnana Therapeutics; is a shareholder of Forma Therapeutics and Decibel Therapeutics; is a shareholder and advises Kojin Therapeutics, Kisbee Therapeutics, Exo Therapeutics, and Eikonizo Therapeutics; serves on the Scientific Advisory Boards of Eisai Co., Ltd., Ono Pharma Foundation, Biogen, Inc., and F-Prime Capital Partners and the Board of Advisers of the Genomics Institute of the Novartis Research Foundation; and is a Novartis Faculty Scholar. M.J.W. is an employee and equity holder of Kojin Therapeutics. P.A.C. is an advisor to Pfizer, Inc. and nference, Inc. R.A.Y. is a founder and shareholder of Syros Pharmaceuticals, Camp4 Therapeutics, Omega Therapeutics, and Dewpoint Therapeutics. P.W. is a current employee of The Institute of Cancer Research, which has a Rewards to Inventors scheme and has a commercial interest in development of inhibitors of the WNT pathway, CDK8/19, and other CDKs, with intellectual property licensed to Merck and Cyclacel Pharmaceuticals. P.W. is also a consultant for Astex Pharmaceuticals, CV6 Therapeutics, Nextechinvest, Nuevolution, Black Diamond, and STORM Therapeutics and holds equity in Chroma Therapeutics, Nextech, Black Diamond, and STORM. B.N. is an inventor on patent applications related to the dTAG system (WO/2017/024318, WO/2017/024319, WO/2018/148443, and WO/2018/148440). N.S.G. is a Scientific Founder, member of the Scientific Advisory Board (SAB), and equity holder in C4 Therapeutics, Syros, Soltego (board member), B2S, Allorion, and Inception. The Gray lab receives or has received research funding from Novartis, Takeda, Astellas, Taiho, Janssen, Kinogen, Voroni, Arbella, Deerfield, and Sanofi.

Figures

None
Graphical abstract
Figure 1
Figure 1
Brachyury is a master transcriptional regulator that defines the chordoma SE landscape (A) Gene tracks of H3K27ac and HA-dTAG-brachyury in CH22 and UM-Chor1 parental and HA-dTAG-T, T−/− cells at the KRT8/KRT18 loci (units of reads per million per base pair). The SEs are denoted by blue boxes. For CH22, n = 4 biological replicates for H3K27ac and HA-dTAG-brachyury, respectively. For UM-Chor1, n = 3 biological replicates for H3K27ac and HA-dTAG-brachyury, respectively. (B) Heatmaps showing brachyury (WT and G177D) (red) and H3K27ac (blue) in CH22 and UM-Chor1 parental and HA-dTAG-T, T−/− cells. Each row shows the ± 5 kb centered on the brachyury peak center ranked by average HA-dTAG-brachyury/H3K27ac signal. Color-scaled intensities are in units of reads per million (rpm) per base pair. Brachyury peak overlaps with SEs are noted in black. (C) Sliding window plot of log2 enrichment for SEs versus HA-dTAG-brachyury peaks ranked by binding (area under curve [AUC]) in CH22 and UM-Chor1 parental and HA-dTAG-T, T−/− cells. Each window is 1,000 brachyury peaks, and each step size is 500 peaks. (D) De novo motif analysis of brachyury binding from combined analysis of CH22 and UM-Chor1 HA-dTAG-T, T−/− cells. (E) Pie charts showing genomic distributions of brachyury peaks with active chromatin or genomic features in UM-Chor1 and CH22 parental and HA-dTAG-T, T−/− cells. (F) Pathway analysis for the combined top CH22- and UM-Chor1 SE-associated genes regulated by brachyury. (G) Network depiction of the brachyury regulome from combined analysis of CH22 and UM-Chor1 parental and HA-dTAG-T, T−/− cells. Nodes represent SE-associated TFs that regulate or are regulated by brachyury. Edges are bi-directional (solid line) or unidirectional (dotted line). Red edges represent chromatin immunoprecipitation (ChIP)-verified brachyury binding. White nodes show TFs that are upstream regulators of brachyury, blue nodes are upstream and downstream, and gray nodes are downstream only.
Figure 2
Figure 2
Brachyury autoregulates through a SE transcriptional condensate (A) Gene tracks of H3K27ac and HA-dTAG-brachyury (units of reads per million per base pair) at the T locus in UM-Chor1 and CH22 parental and HA-dTAG-T, T−/− cells. The SEs are denoted by blue boxes. The location of sgRNAs used to target dCas9-KRAB are indicated by arrows. For CH22, n = 4 biological replicates for H3K27ac and HA-dTAG-brachyury, respectively. For UM-Chor1, n = 3 biological replicates for H3K27ac and HA-dTAG-brachyury, respectively. (B) Bar plots depicting T or MAX mRNA levels in CH22 parental cells transduced with a nontargeting sgRNA or sgRNAs targeting the T promoter or the T SE and dCas9-KRAB. Data are expressed as the mean mRNA levels normalized to GAPDH. Error bars denote ± SD (n = 3 technical replicates). (C) Line graph showing the log2 fold change of SE-associated TF mRNA levels in parental UM-Chor1 cells with THZ1 (n = 3 biological replicates per time point). T is denoted in red. (D) Representative FRAP images of HA-EGFP-dTAG-brachyury puncta. The white box indicates the bleached punctum. (E) Quantification of FRAP data targeting HA-EGFP-dTAG-brachyury. Bleaching occurs at t = 0 s. For the bleached area and unbleached control, fluorescence intensities are plotted relative to a prebleach time point (t = −2 s). Data are plotted as means ± SD (n = 5 cells). (F) Top: colocalization between BRD4 and T nascent RNA by immunofluorescence (IF) and nascent RNA fluorescence in situ hybridization (FISH), respectively, in fixed CH22, THA-dTAG-EGFP/+. Bottom: colocalization between BRD4 and GAPDH nascent RNA by IF and nascent RNA FISH in fixed CH22, THA-dTAG-EGFP/+. Separate images of the indicated IF and FISH are shown, along with a merged image. (G) Zoomed image showing (F) with the calculated Spearman correlation coefficient for BRD4 protein and T or GAPDH nascent RNA colocalization. (H) Quantification of T nascent RNA and BRD4 protein colocalization compared with GAPDH nascent RNA and BRD4 protein colocalization. Cells from two biological populations were prepared and imaged in parallel. Spearman correlation coefficients between T or GAPDH nascent RNA and with BRD4 protein signal are plotted. ∗∗∗∗p < 0.0001, derived from a two-tailed, unpaired t test.
Figure 3
Figure 3
Transcriptional CDK inhibition-induced apoptosis is associated with brachyury downregulation (A) Schematic depicting engineered chordoma cell lines. (B) Immunoblot of brachyury protein levels in CH22 parental and HA-dTAG-T, T+/+ cells with THZ1 (n = 2, one experiment is shown). (C) Immunoblots of HA-dTAG-brachyury expression in CH22 HA-dTAG-T, T−/− cells with concentrations of degron for 8 h (left) and 1 μM degron over time (right) (n = 1). (D) Cell viability of HA-dTAG-T, T+/+ or parental cells treated with 15 nM THZ1 or 1 μM degron + 15nM THZ1 for 6 days. Data are plotted as the mean fraction of cell viability relative to DMSO (n = 8 biological replicates). Error bars denote± SD. ∗∗∗∗p < 0.0001, derived from a two-tailed, unpaired t test. (E) Representative images of CH22, THA-dTAG-EGFP/+ with degron or THZ1. (F) Left: quantification of live-cell imaging of CH22, THA-dTAG-EGFP/+ with DMSO, THZ1 or degron (n = 3 biological replicate populations per treatment). The integral EGFP signal is normalized to t = 0. Right: boxplots comparing median EGFP levels in apoptotic and nonapoptotic individual cells (n = 21). ∗∗∗p < 0.001, derived from a two-tailed, unpaired t test.
Figure 4
Figure 4
Brachyury is a highly selective transcriptional regulator (A) Boxplots depicting log2 fold changes in steady state mRNA (left) or mean percentage of nascent mRNA reads (right) in CH22 HA-dTAG-T, T−/− cells with DMSO, degron, or THZ1 (n = 3 biological replicates per treatment). (B) Bar plots depicting mean nascent mRNA levels for KRT18, MCL1, or GAPDH in CH22 HA-dTAG-T, T−/− cells with DMSO, degron, or THZ1. Error bars denote ± SD (n = 3 biological replicates per treatment). The p values were derived from a two-tailed, unpaired t test. (C) Bar plots showing mean total mRNA levels for KRT18, MCL1, or GAPDH in CH22 HA-dTAG-T, T−/− cells with DMSO, degron, or THZ1. Error bars denote ± SD (n = 3 biological replicates per treatment). (D) Left: scatterplot of percent nascent mRNA reads for all active genes with degron versus DMSO in CH22 HA-dTAG-T, T−/− cells (n = 3 biological replicates per treatment). The top brachyury-bound, SE-associated genes are shown in red. Right: boxplot comparing the log2 fold change in nascent mRNA for the top brachyury-bound SE-associated genes (red); the top brachyury-bound, non-SE-associated genes (blue); and other, non-brachyury-bound, active genes (gray) with degron. The p values were derived from a two-tailed, unpaired t test. (E) Left: scatterplot of percent nascent mRNA reads for all active genes with THZ1 versus DMSO in CH22 HA-dTAG-T, T−/− cells (n = 3 biological replicates per treatment). The top brachyury-bound, SE-associated genes are shown in red. Right: boxplot comparing the log2 fold change in nascent mRNA for the top brachyury-bound SE-associated genes (red); the top brachyury-bound, non-SE-associated genes (blue); and all other, non-brachyury-regulated, active genes (gray) with THZ1. The p values were derived from a two-tailed, unpaired t test. (F) GSEA plots of the top, brachyury-bound SE-associated genes with THZ1 or degron defined by leading edge analysis in CH22 HA-dTAG-T, T−/− cells. Genes are ranked from left to right by the log2 fold change in nascent transcription.
Figure 5
Figure 5
THZ1 and brachyury degradation converge on disrupting the T transcriptional condensate (A) Left: brachyury IF in CH22, THA-dTAG-EGFP/+ with 500 nM THZ1 or DMSO. Right: quantification of brachyury condensates per nucleus. Error bars represent ± SD. ∗∗∗p < 0.001, derived from a two-tailed, unpaired t test (n = 1 biological replicate). (B) Left: brachyury IF in CH22 HA-dTAG-T, T−/− cells with 1 μM degron or DMSO. Right: quantification of brachyury condensates per nucleus. Error bars represent ± SD. ∗∗∗p < 0.001, derived from a two-tailed, unpaired t test (n = 1 biological replicate). (C) Colocalization between BRD4 and the T DNA locus by IF and DNA FISH, respectively, in fixed CH22, THA-dTAG-EGFP/+ with 500 nM THZ1 or DMSO (24 h). Separate images of the indicated IF and FISH are shown, along with an image showing the merged channels and the Spearman correlation coefficient for BRD4 protein and T colocalization. (D) Quantification of the colocalization of T DNA FISH with BRD4 protein with DMSO or 500 nM THZ1 (24 h) in CH22, THA-dTAG-EGFP/+. Spearman correlation coefficients between the T DNA FISH signal with the BRD4 protein signal are plotted. Three biological replicates were treated and imaged in parallel. ∗∗p < 0.01, derived from a two-tailed, unpaired t test. (E) Colocalization between BRD4 and the T DNA locus by IF and DNA-FISH, respectively, in fixed CH22 HA-dTAG-T, T−/− cells with 1 μM degron or DMSO (24 h). Separate images of the indicated IF and FISH are shown, along with an image showing the merged channels and the Spearman correlation coefficient BRD4 protein and T colocalization. (F) Quantification of the colocalization of T DNA FISH with BRD4 protein with DMSO or 1 μM degron (24 h) in CH22 HA-dTAG-T, T−/−. Spearman correlation coefficients between the T DNA FISH signal with the BRD4 protein signal are plotted. Three biological replicates were treated and imaged in parallel. ∗∗∗∗p < 0.0001, derived from a two-tailed, unpaired t test.
Figure 6
Figure 6
Brachyury degradation induces senescence and sensitizes chordoma cells to anti-apoptotic inhibitors (A) Fold change (relative to t = 0) of cell growth with DMSO or 1 μM degron in CH22 HA-dTAG-T, T−/− cells. At t = 10 days, degron- and DMSO-treated media were replaced with normal medium. Error bars denote ± SD (n = 3 biological replicates). (B) Immunoblot of brachyury levels in CH22 HA-dTAG-T, T−/− cells with DMSO (t = 0), 1 μM degron (t = 0), DMSO washout (t = 18), and degron washout (t = 18) (n = 1). (C) Percentage of SA-β-galactosidase (β-gal)-positive CH22 HA-dTAG-T, T−/− cells treated with DMSO or degron for 6 days. ∗∗p < 0.00, derived from a two-tailed, unpaired t test (n = 3 biological replicates). (D) Gene set enrichment analysis (GSEA) in CH22 HA-dTAG-T, T−/− cells with 1 μM degron or CH22 parental cells with 60 nM THZ1 (n = 3 biological replicates each). Gene sets are from the Molecular Signatures Database. (E) Immunoblots validating MCL1 levels and cleaved PARP levels in CH22 HA-dTAG-T, T−/− cells with THZ1 or degron (n = 2 biological replicates, one experiment shown). (F) Gene tracks of H3K27ac and HA-dTAG-brachyury (units of reads per million per base pair) at the MCL1 locus in CH22 parental and HA-dTAG-T, T−/− cells (n = 4 biological replicates for H3K27ac and HA-dTAG-brachyury, respectively). (G) Cell viability of CH22 HA-dTAG-T, T−/− cells with maritoclax, degron, or maritoclax + degron for 6 days. Data are plotted as the mean fraction of cell viability relative to DMSO-treated cells (n = 5 biological replicates). Error bars denote ± SD. ∗p < 0.05, derived from a two-tailed, unpaired t test. (H) Caspase-3/7 levels in CH22 HA-dTAG-T, T−/− cells with maritoclax, degron, or maritoclax + degron for 3 days. Caspase-3/7 levels and cell viability were measured in parallel. Data are plotted as the normalized mean caspase-3/7 levels relative to DMSO-treated cells, normalized again to cell viability for each treatment. Error bars denote ± SD (n = 5 biological replicates). ∗p < 0.05, derived from a two-tailed, unpaired t test. (I) Gene tracks of H3K27ac and HA-dTAG-brachyury (units of reads per million per base pair) at the BCL-xL locus in CH22 parental and HA-dTAG-T, T−/− cells (n = 4 biological replicates for H3K27ac and HA-dTAG-brachyury, respectively). (J) Cell viability of CH22 HA-dTAG-T, T−/− cells with navitoclax, degron, or navitoclax + degron for 6 days. Data are plotted as the mean fraction of cell viability relative to DMSO-treated cells. (n = 5 biological replicates). Error bars denote ± SD. ∗∗p < 0.01, derived from a two-tailed, unpaired t test. (K) Caspase-3/7 levels in CH22 HA-dTAG-T, T−/− cells with navitoclax, degron, or navitoclax + degron for 3 days. Caspase-3/7 levels and cell viability were measured in parallel. Data are plotted as the normalized mean caspase-3/7 level relative to DMSO-treated cells, normalized again to the cell viability for each treatment (n = 5 biological replicates). Error bars denote ± SD. ∗∗p < 0.01, derived from a two-tailed, unpaired t test.

References

    1. Gonda T.J., Ramsay R.G. Directly targeting transcriptional dysregulation in cancer. Nat. Rev. Cancer. 2015;15:686–694. - PubMed
    1. Bradner J.E., Hnisz D., Young R.A. Transcriptional Addiction in Cancer. Cell. 2017;168:629–643. - PMC - PubMed
    1. McEvoy J., Flores-Otero J., Zhang J., Nemeth K., Brennan R., Bradley C., Krafcik F., Rodriguez-Galindo C., Wilson M., Xiong S. Coexpression of normally incompatible developmental pathways in retinoblastoma genesis. Cancer Cell. 2011;20:260–275. - PMC - PubMed
    1. Stewart E., McEvoy J., Wang H., Chen X., Honnell V., Ocarz M., Gordon B., Dapper J., Blankenship K., Yang Y., St. Jude Children’s Research Hospital – Washington University Pediatric Cancer Genome Project Identification of Therapeutic Targets in Rhabdomyosarcoma through Integrated Genomic, Epigenomic, and Proteomic Analyses. Cancer Cell. 2018;34:411–426.e19. - PMC - PubMed
    1. Sanda T., Lawton L.N., Barrasa M.I., Fan Z.P., Kohlhammer H., Gutierrez A., Ma W., Tatarek J., Ahn Y., Kelliher M.A. Core transcriptional regulatory circuit controlled by the TAL1 complex in human T cell acute lymphoblastic leukemia. Cancer Cell. 2012;22:209–221. - PMC - PubMed

Publication types

MeSH terms