. 2021 Feb;2(2):e60-e69.
doi: 10.1016/S2666-5247(20)30197-X. Epub 2020 Dec 21.

Multiplex assays for the identification of serological signatures of SARS-CoV-2 infection: an antibody-based diagnostic and machine learning study

Affiliations

Multiplex assays for the identification of serological signatures of SARS-CoV-2 infection: an antibody-based diagnostic and machine learning study

Jason Rosado et al. Lancet Microbe. 2021 Feb.

Abstract

Background: Infection with severe acute respiratory syndrome coronavirus 2 (SARS-CoV-2) induces an antibody response targeting multiple antigens that changes over time. This study aims to take advantage of this complexity to develop more accurate serological diagnostics.

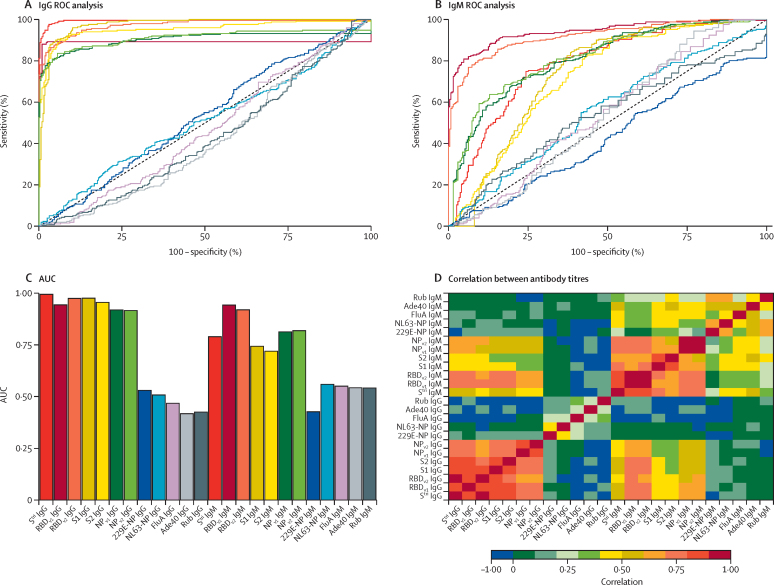
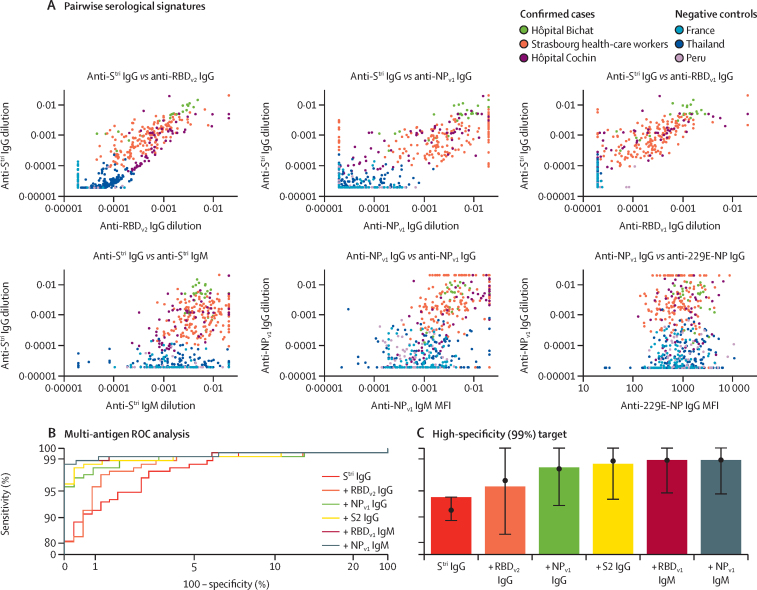
Methods: A multiplex serological assay was developed to measure IgG and IgM antibody responses to seven SARS-CoV-2 spike or nucleoprotein antigens, two antigens for the nucleoproteins of the 229E and NL63 seasonal coronaviruses, and three non-coronavirus antigens. Antibodies were measured in serum samples collected up to 39 days after symptom onset from 215 adults in four French hospitals (53 patients and 162 health-care workers) with quantitative RT-PCR-confirmed SARS-CoV-2 infection, and negative control serum samples collected from healthy adult blood donors before the start of the SARS-CoV-2 epidemic (335 samples from France, Thailand, and Peru). Machine learning classifiers were trained with the multiplex data to classify individuals with previous SARS-CoV-2 infection, with the best classification performance displayed by a random forests algorithm. A Bayesian mathematical model of antibody kinetics informed by prior information from other coronaviruses was used to estimate time-varying antibody responses and assess the sensitivity and classification performance of serological diagnostics during the first year following symptom onset. A statistical estimator is presented that can provide estimates of seroprevalence in very low-transmission settings.

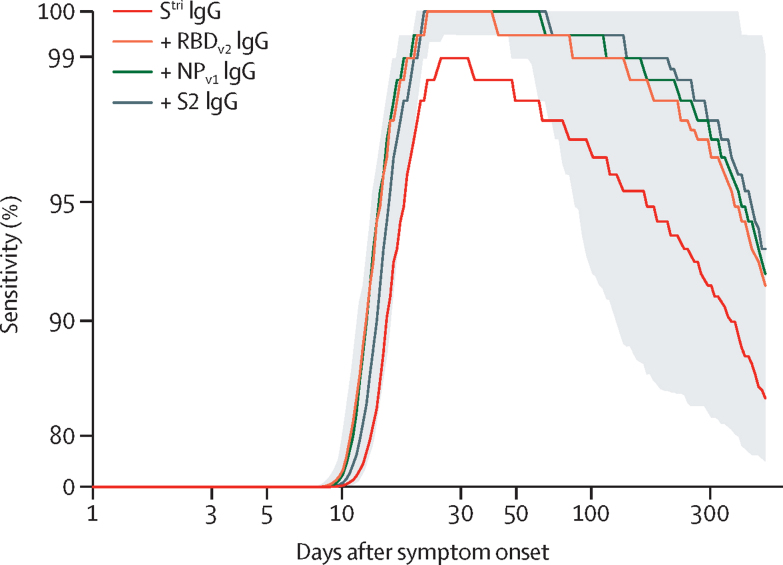
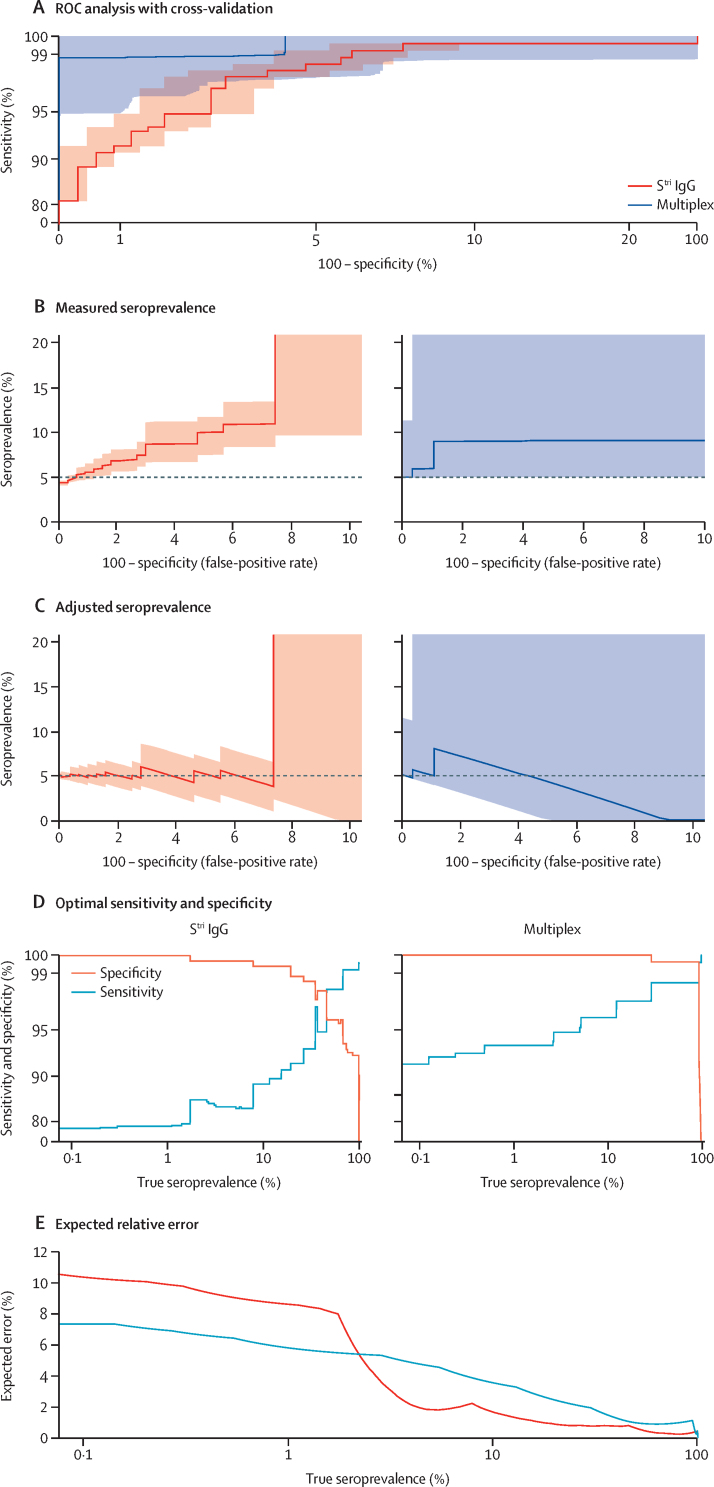
Findings: IgG antibody responses to trimeric spike protein (Stri) identified individuals with previous SARS-CoV-2 infection with 91·6% (95% CI 87·5-94·5) sensitivity and 99·1% (97·4-99·7) specificity. Using a serological signature of IgG and IgM to multiple antigens, it was possible to identify infected individuals with 98·8% (96·5-99·6) sensitivity and 99·3% (97·6-99·8) specificity. Informed by existing data from other coronaviruses, we estimate that 1 year after infection, a monoplex assay with optimal anti-Stri IgG cutoff has 88·7% (95% credible interval 63·4-97·4) sensitivity and that a four-antigen multiplex assay can increase sensitivity to 96·4% (80·9-100·0). When applied to population-level serological surveys, statistical analysis of multiplex data allows estimation of seroprevalence levels less than 2%, below the false-positivity rate of many other assays.

Interpretation: Serological signatures based on antibody responses to multiple antigens can provide accurate and robust serological classification of individuals with previous SARS-CoV-2 infection. This provides potential solutions to two pressing challenges for SARS-CoV-2 serological surveillance: classifying individuals who were infected more than 6 months ago and measuring seroprevalence in serological surveys in very low-transmission settings.

Funding: European Research Council. Fondation pour la Recherche Médicale. Institut Pasteur Task Force COVID-19.


Figures

Figure 1
Figure 1
Anti-SARS-CoV-2 antibody responses ROC curves for IgG antibodies (A) and IgM antibodies (B) obtained by varying the cutoff for seropositivity. Colours correspond to antibodies against different antigens, as shown in panel C. (C) AUC for individual biomarkers. (D) Spearman's correlation between measured antibody responses. Ade40=adenovirus type 40 hexon (capsid). AUC=area under the ROC curve. FluA=influenza A virus (H1N1) haemagglutinin recombinant antigen. NL63-NP=human coronavirus NL63 NP. NP=SARS-CoV-2 nucleoprotein. ROC=receiver operating characteristic. RBD=SARS-CoV-2 spike glycoprotein receptor-binding domain. Rub=rubella virus-like particles (spike glycoprotein E1, spike glycoprotein E2, and capsid protein). SARS-CoV-2=severe acute respiratory syndrome coronavirus 2. Stri=SARS-CoV-2 trimeric spike protein. S1=SARS-CoV-2 spike glycoprotein (S1 domain). S2=SARS-CoV-2 spike glycoprotein (S2 domain). 229E-NP=human coronavirus 229E NP.
Figure 2
Figure 2
Serological signatures of SARS-CoV-2 infection (A) Pairwise combinations of antibody responses. Each point denotes a measured antibody response from a sample from Hôpital Bichat (n=34), health-care workers from Nouvel Hôpital Civil and Hôpital de Haute Pierre in Strasbourg (n=162), and Hôpital Cochin (n=63). Negative control samples are included from Thailand (n=68), Peru (n=90), and French blood donors (n=177). (B) ROC curves for multiple biomarker classifiers generated using a random forests algorithm. Biomarkers are added sequentially. The axes have been rescaled to better differentiate between high values of sensitivity and specificity. (C) For a high specificity target (>99%), sensitivity increases with additional biomarkers, added sequentially. Sensitivity was estimated using a random forests classifier. Points and whiskers denote the median and 95% CIs from repeat cross-validation. MFI= median fluorescent intensity. NP=SARS-CoV-2 nucleoprotein. RBD=SARS-CoV-2 spike glycoprotein receptor-binding domain. ROC=receiver operating characteristic. SARS-CoV-2=severe acute respiratory syndrome coronavirus 2. Stri=SARS-CoV-2 trimeric spike protein. S2=SARS-CoV-2 spike glycoprotein (S2 domain). 229E-NP=human coronavirus 229E NP.
Figure 3
Figure 3
Model-predicted sensitivity over time Proportion of 215 individuals (patients and health-care workers) with RT-qPCR-confirmed SARS-CoV-2 infection testing seropositive over time. A random forests algorithm was used for classification of multiple antigen multiplex data, with antigens added sequentially. The grey shaded region shows the 95% credible interval for the four-antigen multiplex classifier (black line). The x-axis is on a log scale and the y-axis has been rescaled to better differentiate between high values of sensitivity. NP=SARS-CoV-2 nucleoprotein. RBD=SARS-CoV-2 spike glycoprotein receptor-binding domain. RT-qPCR=quantitative RT-PCR. SARS-CoV-2=severe acute respiratory syndrome coronavirus 2. Stri=SARS-CoV-2 trimeric spike protein. S2=SARS-CoV-2 spike glycoprotein (S2 domain).
Figure 4
Figure 4
Implementation of seroprevalence surveys using monoplex (Stri IgG) and six-biomarker multiplex assays (A) ROC analysis with cross-validated uncertainty. Solid lines represent median ROC curves and shaded regions represent 95% uncertainty intervals for specificity. The axes have been rescaled to better differentiate between high values of sensitivity and specificity. (B) In a scenario with true seroprevalence of 5%, the measured seroprevalence depends on the false-positive rate. (C) In a scenario with true seroprevalence of 5%, adjusted seroprevalence estimates are obtained by accounting for assay sensitivity and specificity. (D) Across a range of true seroprevalence values, optimal values of sensitivity and specificity can be selected to minimise the expected relative error in seroprevalence surveys. The y-axis has been rescaled to better differentiate between high values of sensitivity and specificity. (E) The expected relative error for optimal values of sensitivity and specificity. ROC=receiver operating characteristic. SARS-CoV-2=severe acute respiratory syndrome coronavirus 2. Stri=SARS-CoV-2 trimeric spike protein.

References

    1. To KK, Tsang OT, Leung WS. Temporal profiles of viral load in posterior oropharyngeal saliva samples and serum antibody responses during infection by SARS-CoV-2: an observational cohort study. Lancet Infect Dis. 2020;20:565–574. - PMC - PubMed
    1. Siordia JA., Jr Epidemiology and clinical features of COVID-19: a review of current literature. J Clin Virol. 2020;127 - PMC - PubMed
    1. The Foundation for Innovative New Diagnostics SARS-CoV-2 diagnostics: performance data. https://www.finddx.org/covid-19/dx-data
    1. Borremans B, Gamble A, Prager KC. Quantifying antibody kinetics and RNA detection during early-phase SARS-CoV-2 infection by time since symptom onset. eLife. 2020;9 - PMC - PubMed
    1. White MT, Griffin JT, Akpogheneta O. Dynamics of the antibody response to Plasmodium falciparum infection in African children. J Infect Dis. 2014;210:1115–1122. - PubMed

Publication types