. 2021 Mar 12;2(3):243-262.e8.
doi: 10.1016/j.medj.2020.12.006. Epub 2020 Dec 16.

A booster dose enhances immunogenicity of the COVID-19 vaccine candidate ChAdOx1 nCoV-19 in aged mice

Affiliations

A booster dose enhances immunogenicity of the COVID-19 vaccine candidate ChAdOx1 nCoV-19 in aged mice

Alyssa Silva-Cayetano et al. Med. .

Abstract

Background: The spread of SARS-CoV-2 has caused a worldwide pandemic that has affected almost every aspect of human life. The development of an effective COVID-19 vaccine could limit the morbidity and mortality caused by infection and may enable the relaxation of social-distancing measures. Age is one of the most significant risk factors for poor health outcomes after SARS-CoV-2 infection; therefore, it is desirable that any new vaccine candidates elicit a robust immune response in older adults.

Methods: Here, we use in-depth immunophenotyping to characterize the innate and adaptive immune response induced upon intramuscular administration of the adenoviral vectored ChAdOx1 nCoV-19 (AZD-1222) COVID-19 vaccine candidate in mice.

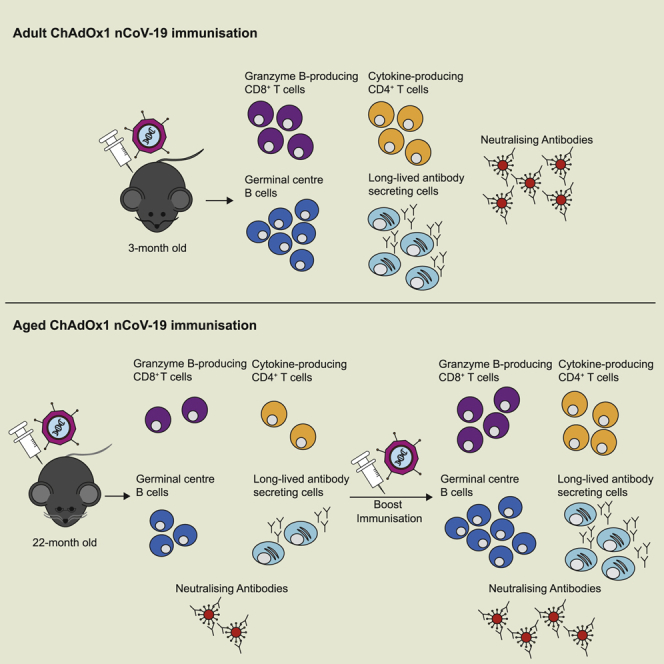
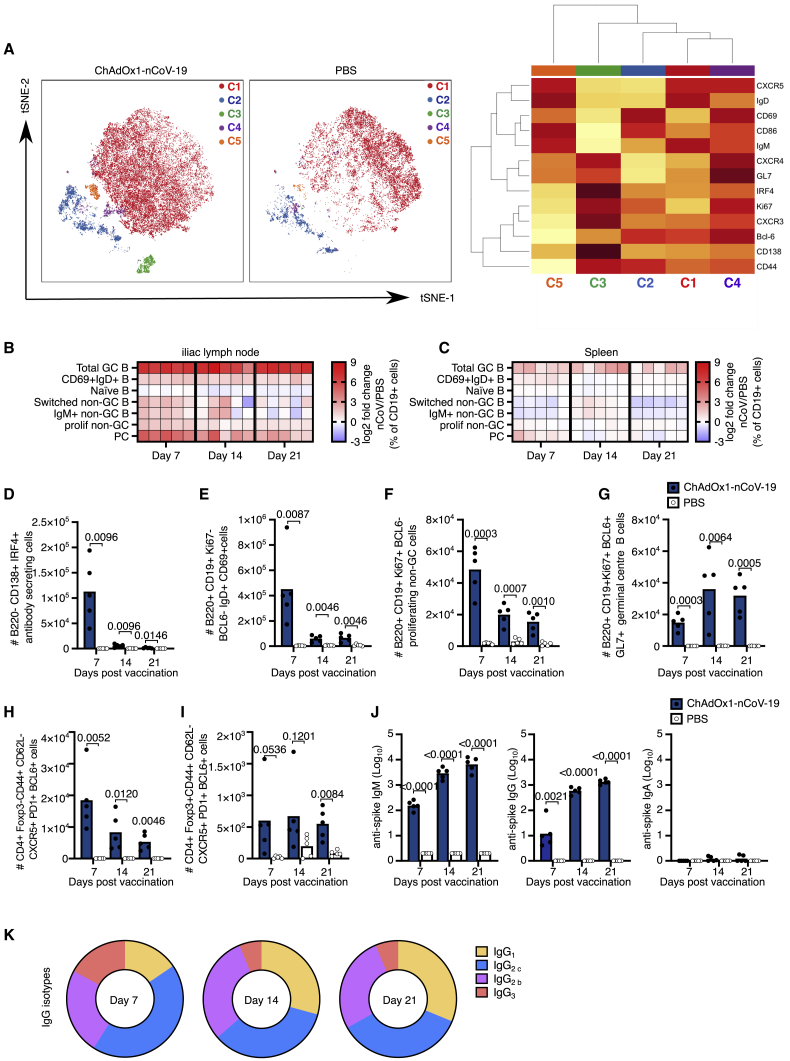
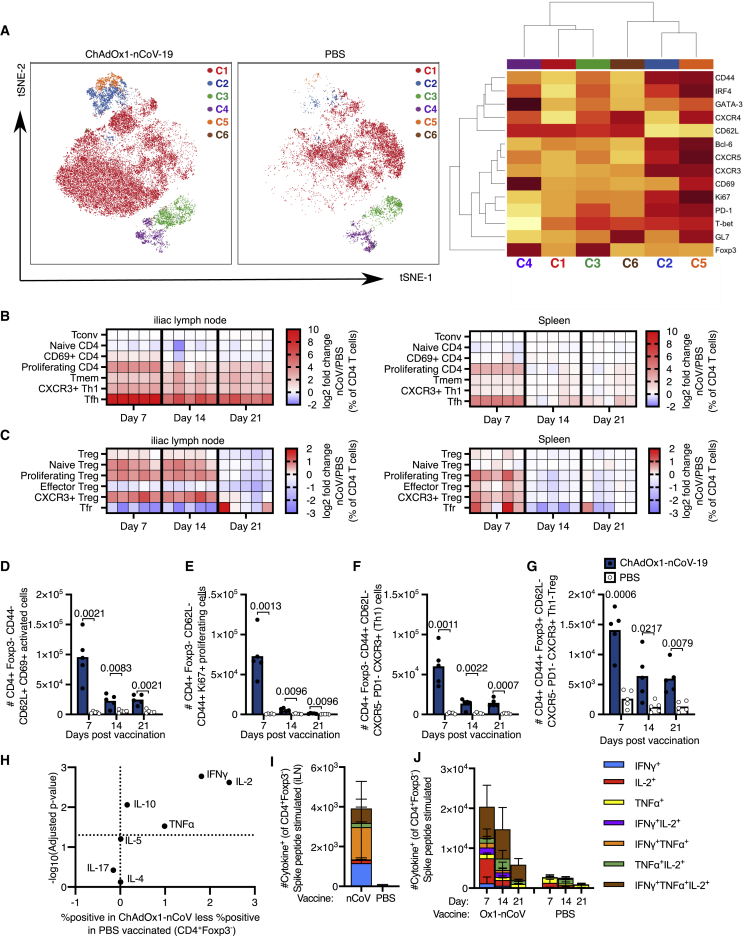
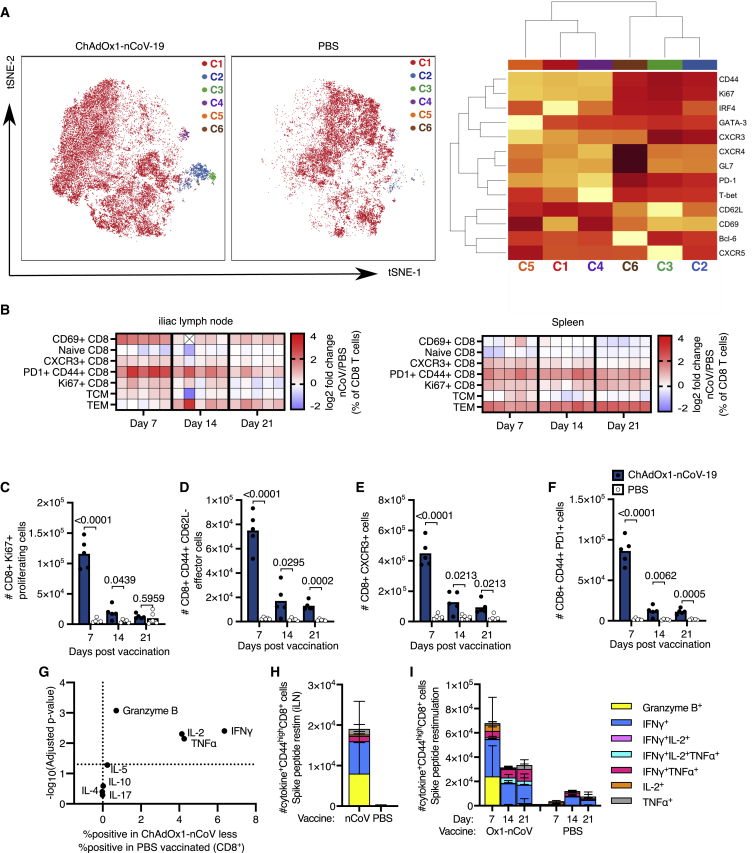
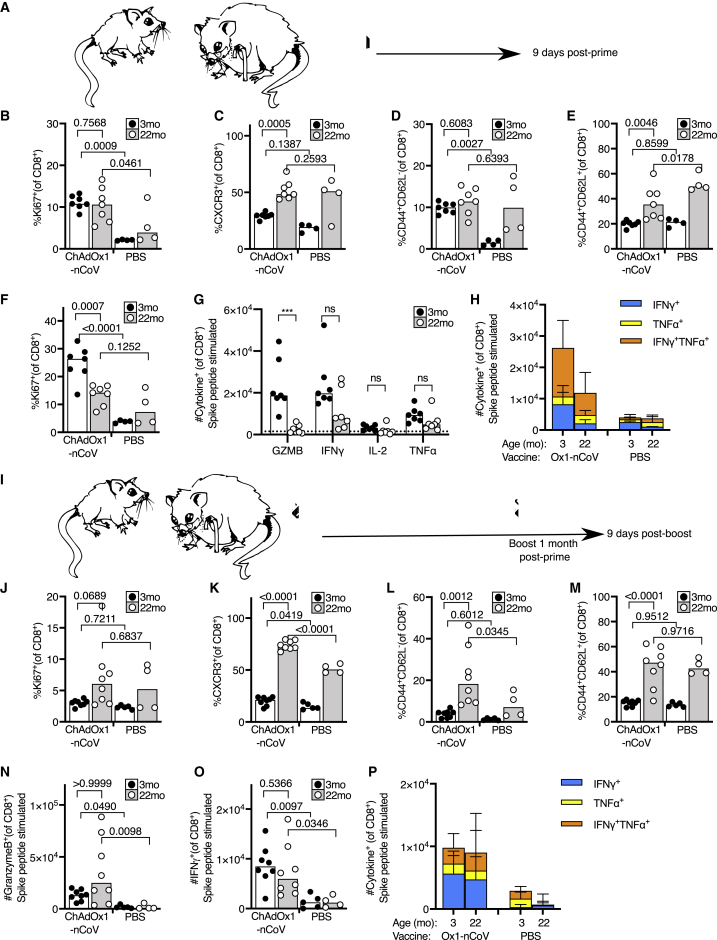
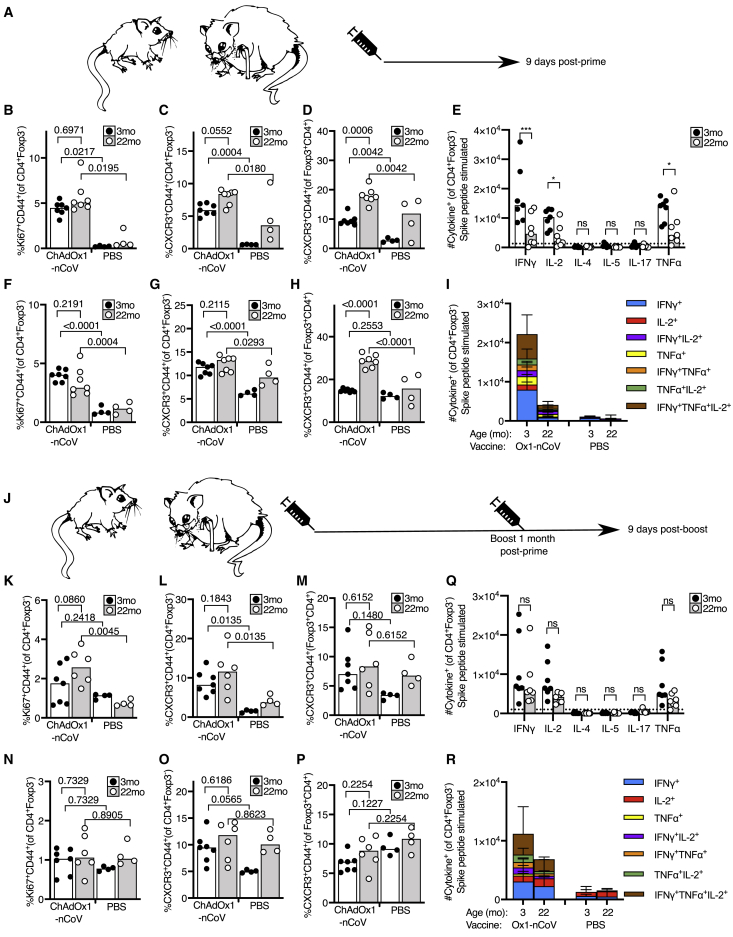
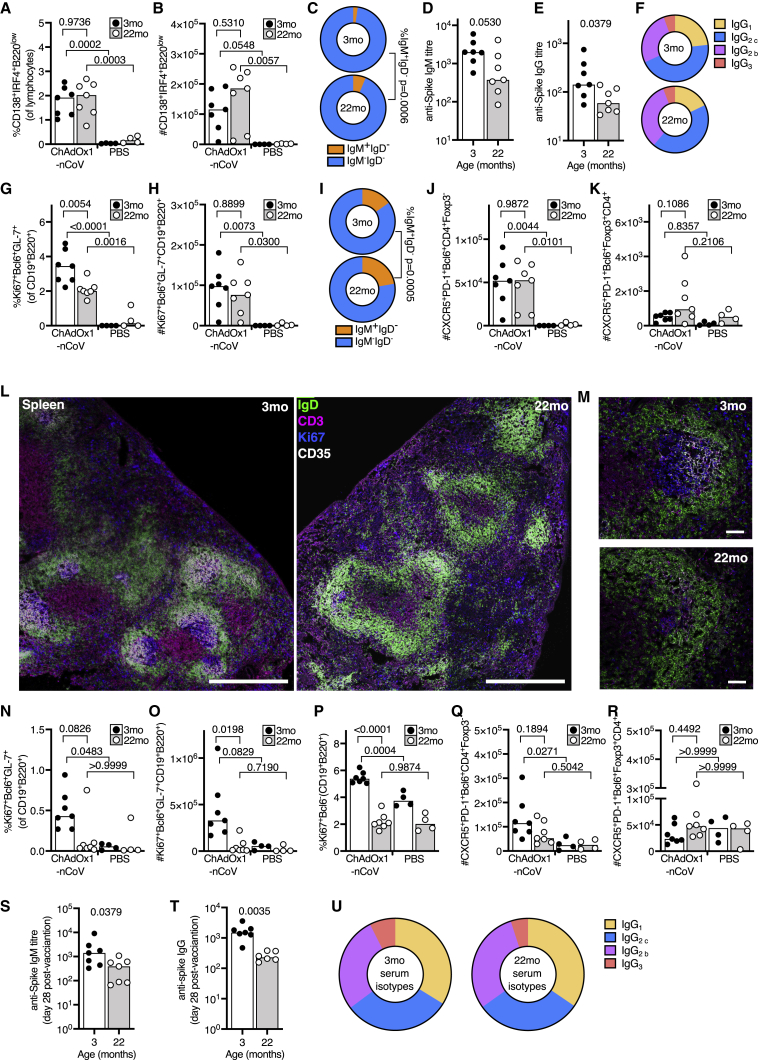
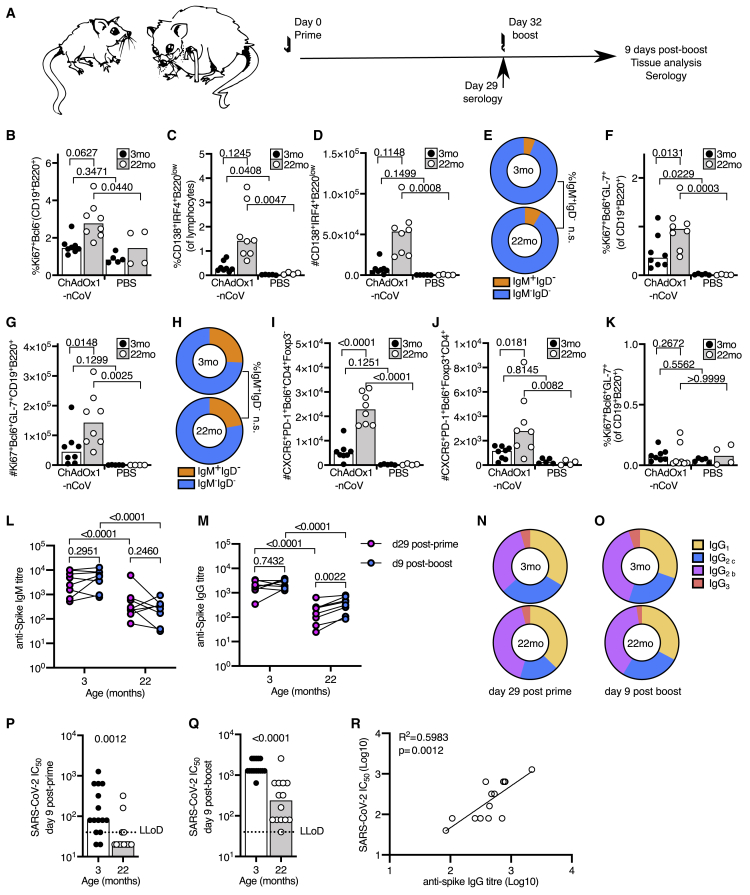
Findings: A single vaccination generates spike-specific Th1 cells, Th1-like Foxp3+ regulatory T cells, polyfunctional spike-specific CD8+ T cells. and granzyme-B-producing CD8 effectors. Spike-specific IgG and IgM are generated from both the early extrafollicular antibody response and the T follicular helper cell-supported germinal center reaction, which is associated with the production of virus-neutralizing antibodies. A single dose of this vaccine generated a similar type of immune response in aged mice but of a reduced magnitude than in younger mice. We report that a second dose enhances the immune response to this vaccine in aged mice.

Conclusions: This study shows that ChAdOx1 nCoV-19 induces both cellular and humoral immunity in adult and aged mice and suggests a prime-boost strategy is a rational approach to enhance immunogenicity in older persons.

Funding: This study was supported by BBSRC, Lister institute of Preventative Medicine, EPSRC VaxHub, and Innovate UK.

Keywords: CD8+ T cells; COVID-19; T follicular helper cells; Th1 cells; aging; antibodies; germinal center; immunogenicity; vaccination.


Conflict of interest statement

S.C.G. and T.L. are named on a patent application covering ChAdOx1 nCoV-19. The remaining authors declare no competing interests. The funders played no role in the conceptualization, design, data collection, analysis, decision to publish, or preparation of the manuscript.

Figures

None
Graphical abstract
Figure 1
Figure 1
ChAdOx1 nCoV-19 induces a plasma cell and germinal center B cell response (A) tSNE/FlowSOM analyses of CD19+ B cells from 3-month-old (3mo) mice 7 days after immunization with ChAdOx1 nCoV-19 or PBS; on the heatmap, red indicates high expression, and yellow indicates low expression. (B and C) Heatmaps of the manually gated B cell populations indicated at 7, 14, and 21 days after immunization in the iliac lymph node (B) and spleen (C); the gating strategy for these populations is shown in Figure S2. Here, the frequency of each cell subset in each ChAdOx1 nCoV-19-immunized mouse has been expressed as the log2 fold change over the average frequency in PBS-immunized mice (n = 5). (D–J) Bar charts showing the total number of plasma cells (D), CD69+IgD+ B cells (E), proliferating non-germinal center B cells (F) and germinal center B cells (G) at the indicated time points after immunization. Number of T follicular helper (H) and T follicular regulatory cells (I) at the indicated time points post-immunization. Serum anti-spike IgM, IgG, and IgA (J) antibodies 7, 14, and 21 days after immunization. (K) Pie charts indicating the mean abundance of each IgG antibody subclass in the serum at the indicated time points after immunization. In (D)–(J), the bar height corresponds to the mean and each circle represents one biological replicate. p values are calculated using a Student’s t test with Holm-Sidak multiple testing correction; for ELISA, data analyses were done on log transformed values.
Figure 2
Figure 2
ChAdOx1 nCoV-19 induces a Th1-dominated CD4 cell response (A) tSNE/FlowSOM analyses of CD4+ T cells from 3-month-old (3mo) mice 7 days after immunization with ChAdOx1 nCoV-19 or PBS; on the heatmap, red indicates high expression, and yellow indicates low expression. (B and C) Heatmaps of the manually gated CD4+Foxp3 (B) and Foxp3+CD4+ (C) T cell populations indicated at 7, 14, and 21 days after immunization in the iliac lymph node (right) and spleen (left), the gating strategy for these populations is shown in Figure S2. Here, the frequency of each cell subset in each ChAdOx1 nCoV-19-immunized mouse has been expressed as the log2 fold change over the average frequency in PBS-immunized mice (n = 5). (D–G) Bar charts showing the number of CD69+CD62L+CD44CD4+Foxp3 (D), Ki67+CD4+Foxp3 (E) CXCR3+ non-Tfh cells (F) and CXCR3+ Th1-like Treg cells (G) CD4+ cells in the iliac lymph node of ChAdOx1 nCoV-19 or PBS-immunized mice, at the indicated time points post-immunization. (H) Analysis of cytokine production 6 h after PdBu/ionomycin stimulation of iliac lymph node cells from 3-month-old mice 7 days after immunization with ChAdOx1 nCoV-19 or PBS. (I and J) Stacked bar plots show the number of CD4+Foxp3 cells singly or co-producing IFN-γ, IL-2, or TNF-α in the iLN 7 days after immunization (I) or spleen at the days post-immunization (J); 6 h after restimulation with SARS-CoV-2 peptide pools, each bar segment represents the mean and the error bars the standard deviation. In (D)–(G), the bar height corresponds to the mean and each circle represents one biological replicate. p values are calculated using a Student’s t test with Holm-Sidak multiple testing correction.
Figure 3
Figure 3
ChAdOx1 nCoV-19 induces a CD8 T cell response (A) tSNE/FlowSOM analyses of CD8+ T cells from 3-month-old (3mo) mice 7 days after immunization with ChAdOx1 nCoV-19 or PBS; on the heatmap red indicates high expression, and yellow indicates low expression. (B) Heatmap of the manually gated CD8 T cell populations indicated at 7, 14, and 21 days after immunization in the iliac lymph node and spleen; the gating strategy for these populations is shown in Figure S2. The frequency of each cell subset in each ChAdOx1 nCoV-19-immunized mouse has been expressed as the log2 fold change over the average frequency in PBS-immunized mice (n = 5). Crossed boxes indicate that there were none of that cell type for that mouse. (C–F) Bar charts showing the number of Ki67+ (C), antigen-experienced CD44+CD62L (D), CXCR3+ (E), and PD-1+CD44+ (F) CD8 cells in the iliac lymph node of ChAdOx1 nCoV-19 or PBS-immunized mice, at the indicated time points post-immunization. (G) Analysis of cytokine production 6 h after PdBu/ionomycin stimulation of iliac lymph node cells from 3-month-old mice 7 days after immunization with ChAdOx1 nCoV-19 or PBS. (H and I) Stacked bar plots show the number of CD8+ cells singly or co-producing Granzyme B, IFN-γ, IL-2, or TNF-α 6 h after restimulation with SARS-CoV-2 peptide pools, in the iLN 7 days after immunization (H) or spleen 7, 14, and 21 days after immunization (I); each bar segment represents the mean and the error bars the standard deviation. In (C)–(F), the bar height corresponds to the mean, and each circle represents one biological replicate. p values are calculated using a Student’s t test with Holm-Sidak multiple testing correction.
Figure 4
Figure 4
A prime-boost strategy enhances the CD8 T cell response to ChAdOx1 nCoV-19 in aged mice (A) Cartoon of prime immunization strategy. (B–E) Percentage of Ki67+ (B), CXCR3+ (C), antigen-experienced CD44+CD62L (D), and central memory CD44+CD62L+ (E) CD8+ T cells in the draining iliac lymph node from 3-month-old (3mo) or 22-month-old (22mo) mice 9 days after immunization with ChAdOx1 nCoV-19 or PBS. (F) Percentage of proliferating Ki67+ splenic CD8+ T cells in 3-month-old (3mo) or 22-month-old (22mo) mice 9 days after immunization with ChAdOx1 nCoV-19 or PBS. (G and H) Number of CD8+ T cells producing granzyme B (GZMB), IFN-γ, IL-2, or TNF-α 6 h after restimulation with SARS-CoV-2 peptide pools in (G), and the number of single and double cytokine-producing CD8+ T cells are represented in stacked bar charts. Spleen cells are taken from 3-month-old (3mo) or 22-month-old (22mo) mice 9 days after immunization with ChAdOx1 nCoV-19 or PBS. (I) Cartoon of prime-boost immunization strategy. (J–M) Percentage of Ki67+ (J), CXCR3+ (K), antigen-experienced CD44+CD62L (L), and central memory CD44+CD62L+ (M) CD8+ T cells in the draining iliac lymph node from 3-month-old or 22-month-old mice 9 days after immunization with ChAdOx1 nCoV-19 or PBS. (N–P) Percentage of proliferating Ki67+ splenic CD8+ T cells in 3-month-old or 22-month-old mice 9 days after immunization with ChAdOx1 nCoV-19 or PBS. Number of CD8+ cells producing Granzyme B (N) or IFN-γ (O) 6 h after restimulation with SARS-CoV-2 peptide pools in (P), and the number of single and double cytokine-producing CD8+ T cells are represented in stacked bar charts. Spleen cells are taken from 3-month-old or 22-month-old mice 9 days after immunization with ChAdOx1 nCoV-19 or PBS. The bar height in B-G, J-O corresponds to the median and each circle represents one biological replicate. In (H), (P), each bar segment represents the mean and the error bars the standard deviation. The Shapiro-Wilk normality test was used to determine whether the data are consistent with a normal distribution, followed by either an ordinary one-way ANOVA test for data with a normal distribution or a Kruskal-Wallis test for non-normally distributed data alongside a multiple comparisons test. Data are representative of two independent experiments (n = 4-8 per group/experiment).
Figure 5
Figure 5
The CD4 cell response to ChAdOx1 nCoV-19 in aged mice (A) Cartoon of prime immunization strategy. (B–G) Percentage of proliferating Ki67+ (B), CXCR3+CD44+ CD4 T cells (C) and CXCR3+CD44+Foxp3+ Treg cells (D) in the draining iliac lymph node. Percentage of proliferating Ki67+ (E), CXCR3+CD44+ CD4 T cells (F) and CXCR3+CD44+Foxp3+ Treg cells (G) in the spleen of 3-month-old or 22-month-old mice 9 days after immunization with ChAdOx1 nCoV-19 or PBS. (H and I) Number of CD4+Foxp3 cells producing IFN-γ, IL-2, IL-4, IL-5, IL-17, or TNF-α 6 h after restimulation with SARS-CoV-2 peptide pools in (I), and the number of single and multiple cytokine-producing CD4+ T cells are represented in stacked bar charts. (J) Cartoon of prime-boost immunization strategy. (K–M) Percentage of proliferating Ki67+ (K), CXCR3+CD44+ CD4 T cells (L), and CXCR3+CD44+Foxp3+ Treg cells (M) in the draining iliac lymph node. (N–P) Percentage of Ki67+ CD44+ (N), CXCR3+CD44+ CD4+Foxp3 T cells (O), and CXCR3+CD44+Foxp3+ Treg cells (P) in the spleen of 3-month-old or 22-month-old mice 9 days after immunization with ChAdOx1 nCoV-19 or PBS. (Q and R) Number of CD4+Foxp3 T cells producing IFN-γ, IL-2, IL-4, IL-5, IL-17, or TNF-α 6 h after restimulation with SARS-CoV-2 peptide pools in (R), and the number of single and multiple cytokine-producing CD4+ T cells are represented in stacked bar charts. In (B–H) and (K–P), the bar height corresponds to the median, and each circle represents one biological replicate. In (I) and (R), each bar segment represents the mean and the error bars the standard deviation. The Shapiro-Wilk normality test was used to determine whether the data are consistent with a normal distribution, followed by either an ordinary one-way ANOVA test for data with a normal distribution or a Kruskal-Wallis test for non-normally distributed data alongside a multiple comparisons test. Data are representative of two independent experiments (n = 4–8 per group/experiment).
Figure 6
Figure 6
Impaired B cell responses after ChAdOx1 nCoV-19 immunization of aged mice (A and B) B cell response in 3-month-old (3mo) or 22-month-old (22mo) mice 9 days after immunization with ChAdOx1 nCoV-19 or PBS. Flow cytometric evaluation of the percentage (A) and number (B) of plasma cells in the iliac lymph node. (C) Pie charts showing the proportion of IgM+IgD (orange) and switched IgMIgD (blue) plasma cells from (A) and (B). (D and E) Serum IgM (D) and IgG (E) anti-spike antibodies 9 days after immunization. (F) Pie charts showing the proportion of anti-spike IgG of the indicated subclasses in the serum 9 days after immunization. (G and H) Percentage (G) and number (H) of germinal center B cells in the iliac lymph node. (I) Pie charts showing the proportion of IgM+IgD (orange) and switched IgMIgD (blue) germinal center cells from (G) and (H). (J–M) Number of T follicular helper (J) and T follicular regulatory (K) cells in the draining lymph node. Confocal images of the spleen of ChAdOx1 nCoV-19-immunized mice of the indicated ages; in (L), the scale bars represent 500 μm; in (M), the scale bars represent 50 μm. IgD+ B cell follicle are in green, CD3+ T cells in magenta, Ki67+ cells in blue, and CD35+ follicular dendritic cells in white. (N and O) Percentage (N) and number (O) of splenic germinal center B cells. (P) Percentage of Ki67+ B cells in the spleen. (Q and R) Number of splenic T follicular helper (Q) and T follicular regulatory (R) cells. Serum IgM (S) and IgG (T) anti-spike antibodies and IgG subclasses (U) 28 days after immunization. For all bar graphs, the bar height corresponds to the median and each circle represents one biological replicate. The Shapiro-Wilk normality test was used to determine whether the data are consistent with a normal distribution, followed by either an ordinary one-way ANOVA test for data with a normal distribution or a Kruskal-Wallis test for non-normally distributed data alongside a multiple comparisons test, for ELISA data analyses were done on log transformed values. Data are representative of two independent experiments (n = 4–8 per group/experiment).
Figure 7
Figure 7
A booster immunization enhances the B cell response to ChAdOx1 nCoV-19 immunization in aged mice (A) Scheme of the prime-boost immunization protocol. (B) Percentage of Ki67+ B cells in the draining lymph node. (C and D) Percentage (C) and number (D) plasma cells in the iliac lymph node. (E) Pie charts showing the proportion of IgM+IgD (orange) and switched IgMIgD (blue) plasma cells from (B) and (C). (F and G) Percentage (F) and number (G) of germinal center B cells in the iliac lymph node. (H) Pie charts showing the proportion of IgM+IgD (orange) and switched IgMIgD (blue) germinal center cells from (F) and (G). (I and J) Number of T follicular helper (I) and T follicular regulatory (J) cells in the draining lymph node. (K) Percentage (K) of splenic germinal center B cells. (L–O) Serum anti-spike IgM (L), IgG (M), and IgG subclasses (N and O) prior to boost (day 29) and 9 days after boost immunization. (P and Q) SARS-CoV-2 neutralizing antibody titers in sera were determined by micro neutralization test, expressed as reciprocal serum dilution to inhibit pseudotyped virus entry by 50% (IC50). Samples below the lower limit of detection (LLoD) are shown as half of the LLoD. (R) Linear regression of serum dilution to inhibit pseudotyped virus entry by 50% (IC50 Log10) and serum anti-spike ELISA titer (Log10) in 22-month-old mice, 9 days post-boost. For all bar graphs, the bar height corresponds to the median and each circle represents one biological replicate. The Shapiro-Wilk normality test was used to determine whether the data are consistent with a normal distribution, followed by either an ordinary one-way ANOVA test for data with a normal distribution or a Kruskal-Wallis test for non-normally distributed data alongside a multiple comparisons test. For ELISA, data analyses were done on log transformed values. In (B)–(O), data are shown from one of two independent experiments (n = 4–8 per group/experiment); in (P)–(R), the data are pooled from two experiments.

References

    1. Zhu N., Zhang D., Wang W., Li X., Yang B., Song J., Zhao X., Huang B., Shi W., Lu R., China Novel Coronavirus Investigating and Research Team A Novel Coronavirus from Patients with Pneumonia in China, 2019. N. Engl. J. Med. 2020;382:727–733. - PMC - PubMed
    1. Wu F., Zhao S., Yu B., Chen Y.M., Wang W., Song Z.G., Hu Y., Tao Z.W., Tian J.H., Pei Y.Y. A new coronavirus associated with human respiratory disease in China. Nature. 2020;579:265–269. - PMC - PubMed
    1. Hoffmann M., Kleine-Weber H., Schroeder S., Kruger N., Herrler T., Erichsen S., Schiergens T.S., Herrler G., Wu N.H., Nitsche A. SARS-CoV-2 Cell Entry Depends on ACE2 and TMPRSS2 and Is Blocked by a Clinically Proven Protease Inhibitor. Cell. 2020;181:271–280. - PMC - PubMed
    1. Wu Z., McGoogan J.M. Characteristics of and Important Lessons From the Coronavirus Disease 2019 (COVID-19) Outbreak in China: Summary of a Report of 72314 Cases From the Chinese Center for Disease Control and Prevention. JAMA. 2020;323:1239–1242. - PubMed
    1. Wu C., Chen X., Cai Y., Xia J., Zhou X., Xu S., Huang H., Zhang L., Zhou X., Du C. Risk Factors Associated with Acute Respiratory Distress Syndrome and Death in Patients With Coronavirus Disease 2019 Pneumonia in Wuhan, China. JAMA Intern Med. 2020;180:934–943. - PMC - PubMed

Publication types