

Variation in Target Attainment of Beta-Lactam Antibiotic Dosing Between International Pediatric Formularies
- PMID: 33521971
- PMCID: PMC8358626
- DOI: 10.1002/cpt.2180
Variation in Target Attainment of Beta-Lactam Antibiotic Dosing Between International Pediatric Formularies
Abstract
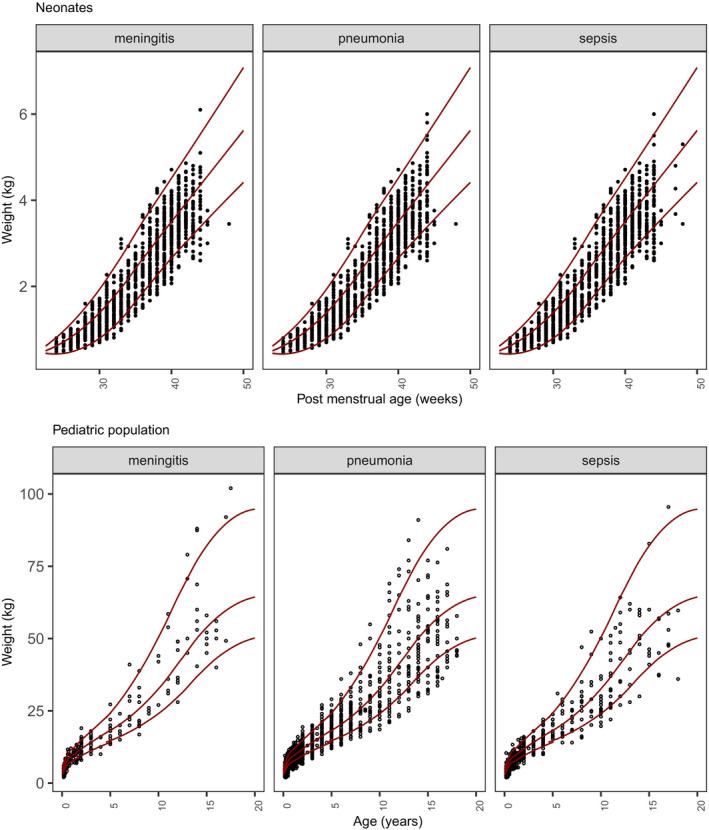
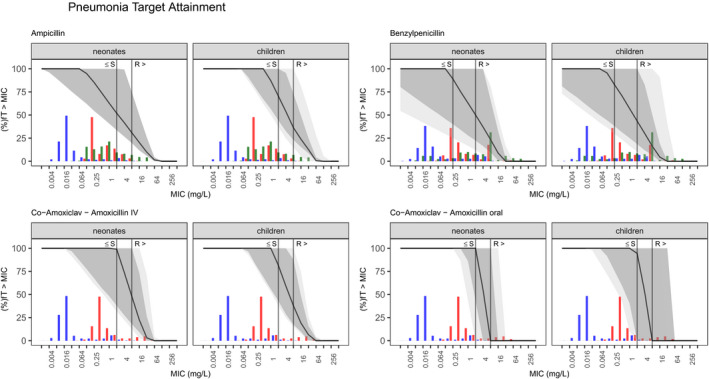
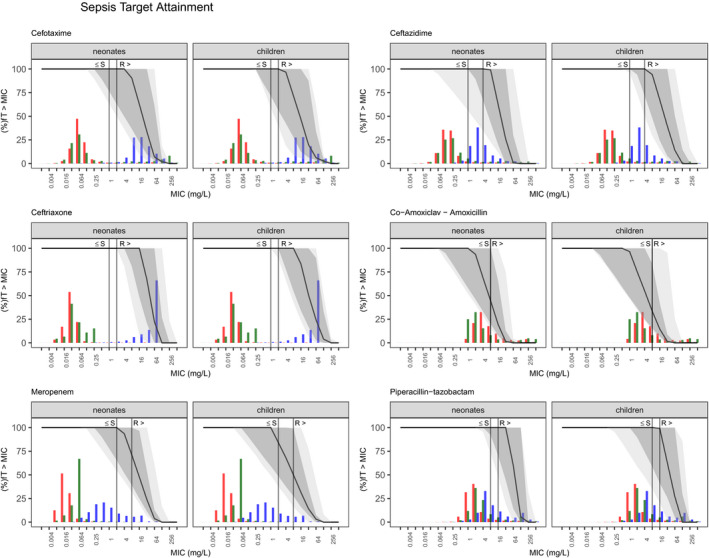
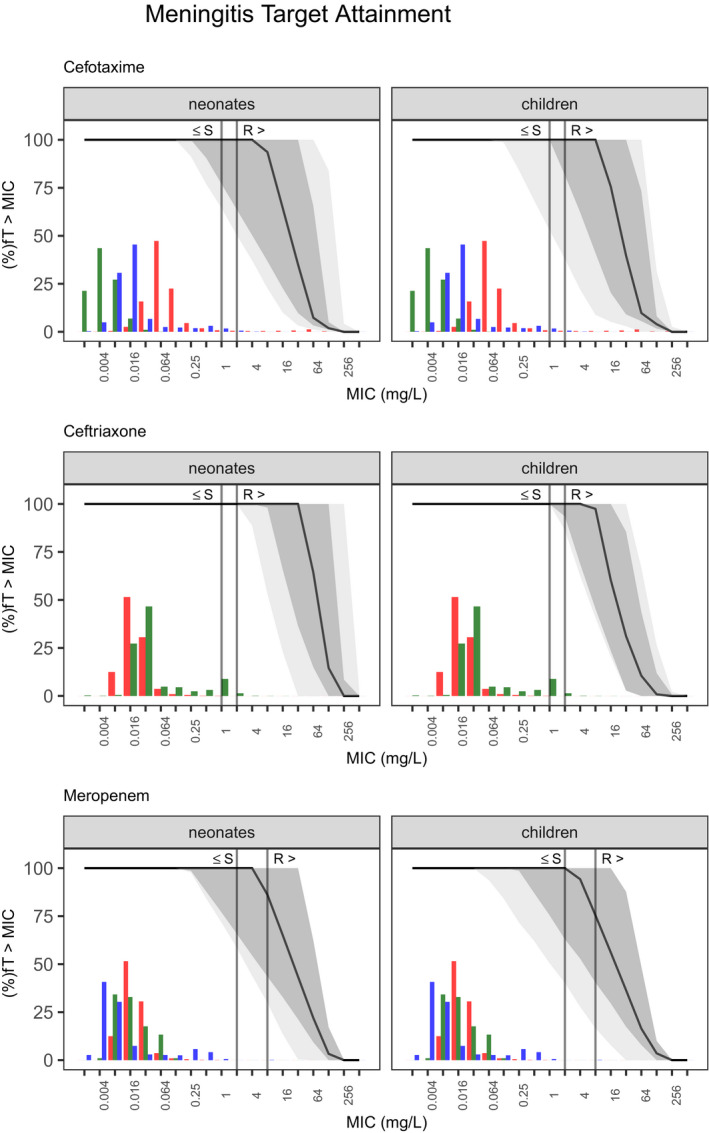
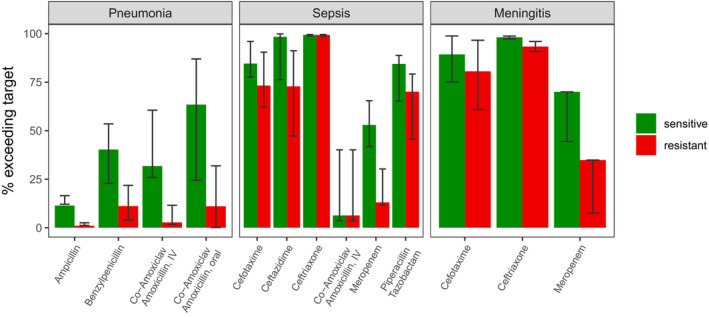
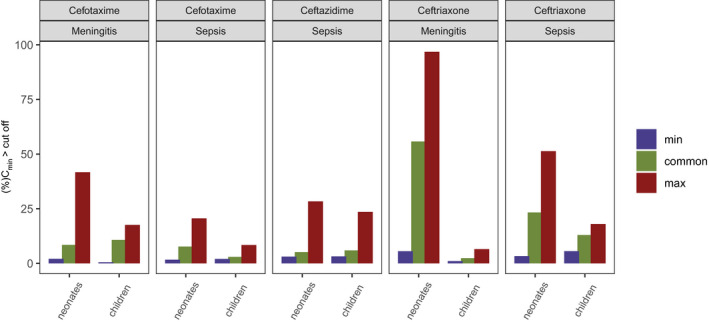
As antimicrobial susceptibility of common bacterial pathogens decreases, ensuring optimal dosing may preserve the use of older antibiotics in order to limit the spread of resistance to newer agents. Beta-lactams represent the most widely prescribed antibiotic class, yet most were licensed prior to legislation changes mandating their study in children. As a result, significant heterogeneity persists in the pediatric doses used globally, along with quality of evidence used to inform dosing. This review summarizes dosing recommendations from the major pediatric reference sources and tries to answer the questions: Does beta-lactam dose heterogeneity matter? Does it impact pharmacodynamic target attainment? For three important severe clinical infections-pneumonia, sepsis, and meningitis-pharmacokinetic models were identified for common for beta-lactam antibiotics. Real-world demographics were derived from three multicenter point prevalence surveys. Simulation results were compared with minimum inhibitory concentration distributions to inform appropriateness of recommended doses in targeted and empiric treatment. While cephalosporin dosing regimens are largely adequate for target attainment, they also pose the most risk of neurotoxicity. Our review highlights aminopenicillin, piperacillin, and meropenem doses as potentially requiring review/optimization in order to preserve the use of these agents in future.
© 2021 The Authors. Clinical Pharmacology & Therapeutics published by Wiley Periodicals LLC on behalf of American Society for Clinical Pharmacology and Therapeutics.
Conflict of interest statement
The authors declared no competing interests for this work.
Figures
Similar articles
-
Population pharmacokinetic models of first choice beta-lactam antibiotics for severe infections treatment: What antibiotic regimen to prescribe in children?J Pharm Pharm Sci. 2020;23:470-485. doi: 10.18433/jpps30927. J Pharm Pharm Sci. 2020. PMID: 33227230 Review.
-
Optimising β -lactam Dosing in Neonates: A Review of Pharmacokinetics, Drug Exposure and Pathogens.Curr Pharm Des. 2017;23(38):5805-5838. doi: 10.2174/1381612823666170925162143. Curr Pharm Des. 2017. PMID: 28950814 Review.
-
Dose optimization of β-lactam antibiotics in children: from population pharmacokinetics to individualized therapy.Expert Opin Drug Metab Toxicol. 2024 Aug;20(8):787-804. doi: 10.1080/17425255.2024.2385403. Epub 2024 Aug 1. Expert Opin Drug Metab Toxicol. 2024. PMID: 39078238 Review.
-
Antibiotic Exposure Profiles in Trials Comparing Intensity of Continuous Renal Replacement Therapy.Crit Care Med. 2019 Nov;47(11):e863-e871. doi: 10.1097/CCM.0000000000003955. Crit Care Med. 2019. PMID: 31397714
-
Beta-Lactam Antibiotic Exposure During Pediatric Extracorporeal Membrane Oxygenation: Retrospective Cohort Analysis of Drug Levels Using Standard Dosing, 2018-2020.Pediatr Crit Care Med. 2024 Dec 1;25(12):1127-1137. doi: 10.1097/PCC.0000000000003605. Epub 2024 Oct 7. Pediatr Crit Care Med. 2024. PMID: 39630067
Cited by
-
The Neonatal and Paediatric Pharmacokinetics of Antimicrobials study (NAPPA): investigating amoxicillin, benzylpenicillin, flucloxacillin and piperacillin pharmacokinetics from birth to adolescence.J Antimicrob Chemother. 2023 Sep 5;78(9):2148-2161. doi: 10.1093/jac/dkad196. J Antimicrob Chemother. 2023. PMID: 37531085 Free PMC article.
-
Simultaneous pharmacokinetic/pharmacodynamic (PKPD) assessment of ampicillin and gentamicin in the treatment of neonatal sepsis.J Antimicrob Chemother. 2022 Feb 2;77(2):448-456. doi: 10.1093/jac/dkab413. J Antimicrob Chemother. 2022. PMID: 35107141 Free PMC article. Clinical Trial.
-
Evaluation of amoxicillin and benzylpenicillin therapy in early-onset neonatal sepsis: a pharmacometric external validation and simulation study.J Antimicrob Chemother. 2025 Aug 1;80(8):2214-2225. doi: 10.1093/jac/dkaf191. J Antimicrob Chemother. 2025. PMID: 40523064 Free PMC article.
-
A Validated UHPLC-MS/MS Method to Quantify Eight Antibiotics in Quantitative Dried Blood Spots in Support of Pharmacokinetic Studies in Neonates.Antibiotics (Basel). 2023 Jan 18;12(2):199. doi: 10.3390/antibiotics12020199. Antibiotics (Basel). 2023. PMID: 36830110 Free PMC article.
-
A Train-the-Trainer Simulation Program Implemented Between Two International Partners.ATS Sch. 2023 Dec 22;5(1):32-44. doi: 10.34197/ats-scholar.2023-0025PS. eCollection 2024 Mar. ATS Sch. 2023. PMID: 38585578 Free PMC article.
References
-
- UNICEF WHO World Bank Group and United Nations . Levels and trends in child mortality 2020: estimates developed by the UN Inter‐agency group for child mortality estimation <https://www.unicef.org/reports/levels‐and‐trends‐child‐mortality‐report‐...> (2020).
-
- Investigators of the Delhi Neonatal Infection Study (DeNIS) collaboration . Characterisation and antimicrobial resistance of sepsis pathogens in neonates born in tertiary care centres in Delhi, India: a cohort study. Lancet Glob. Health 4, e752–e760 (2016). - PubMed
Publication types
MeSH terms
Substances
Grants and funding
LinkOut - more resources
Full Text Sources
Other Literature Sources
Medical
Research Materials
