. 2021 Feb 1:10:e63364.
doi: 10.7554/eLife.63364.

The genetic landscape for amyloid beta fibril nucleation accurately discriminates familial Alzheimer's disease mutations

Affiliations

The genetic landscape for amyloid beta fibril nucleation accurately discriminates familial Alzheimer's disease mutations

Mireia Seuma et al. Elife. .

Abstract

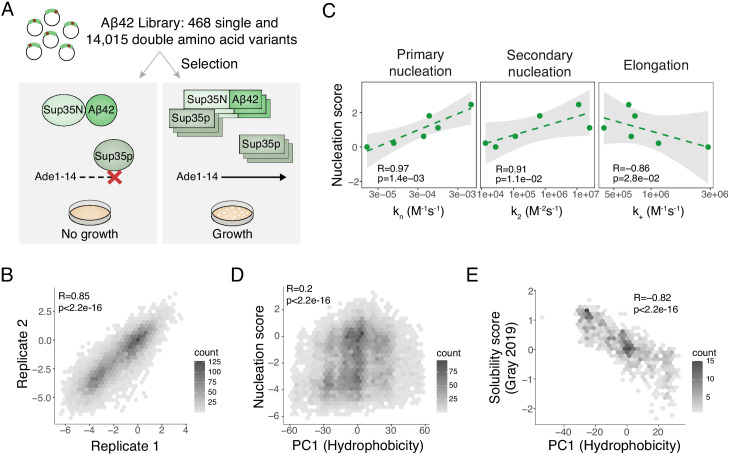
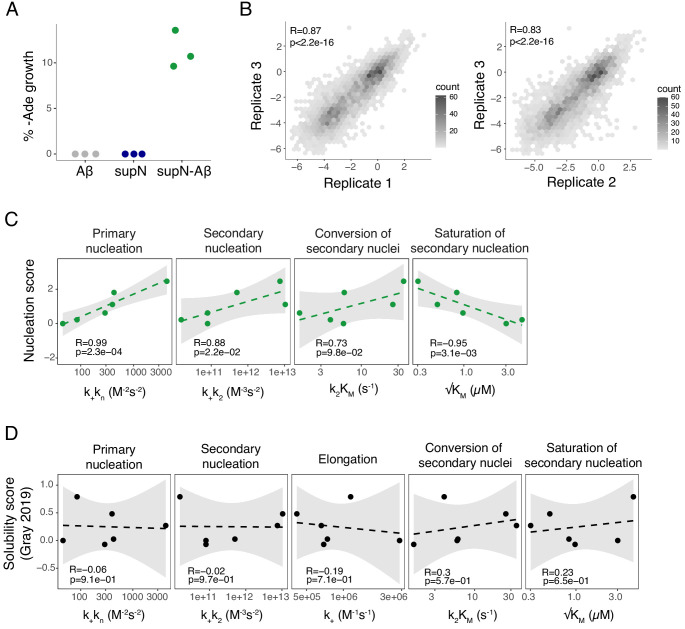
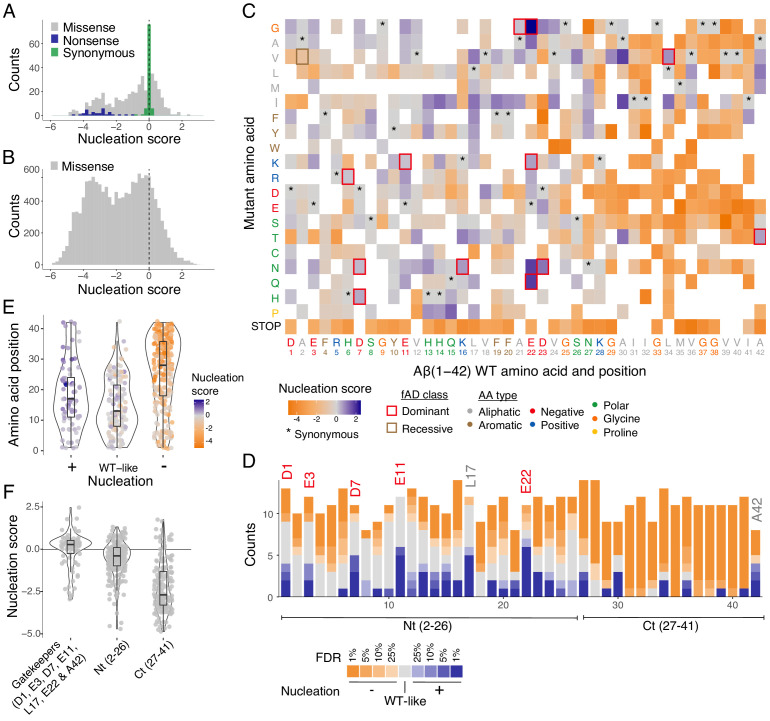
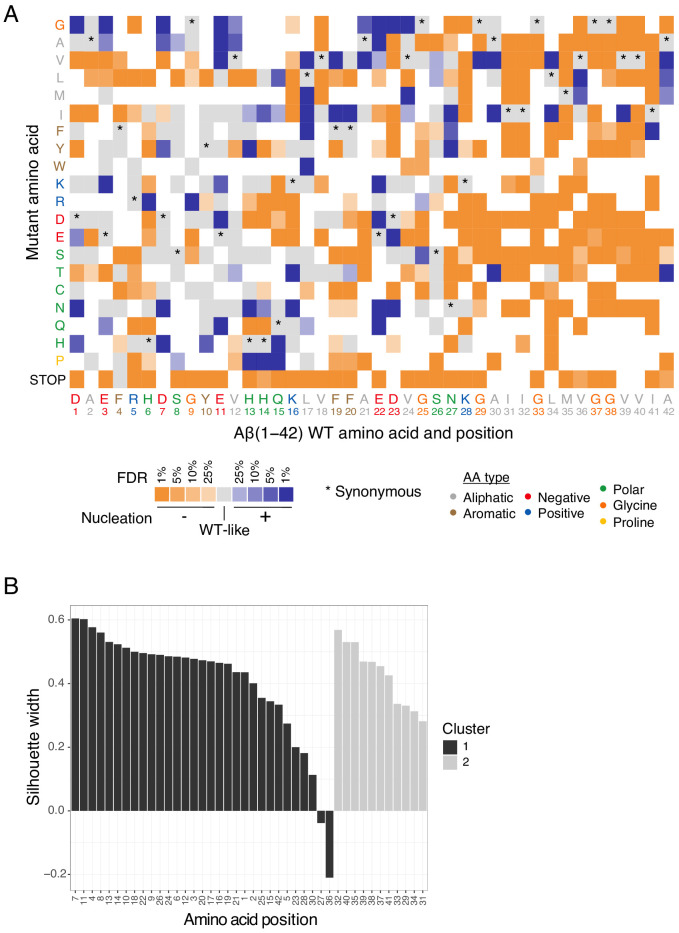
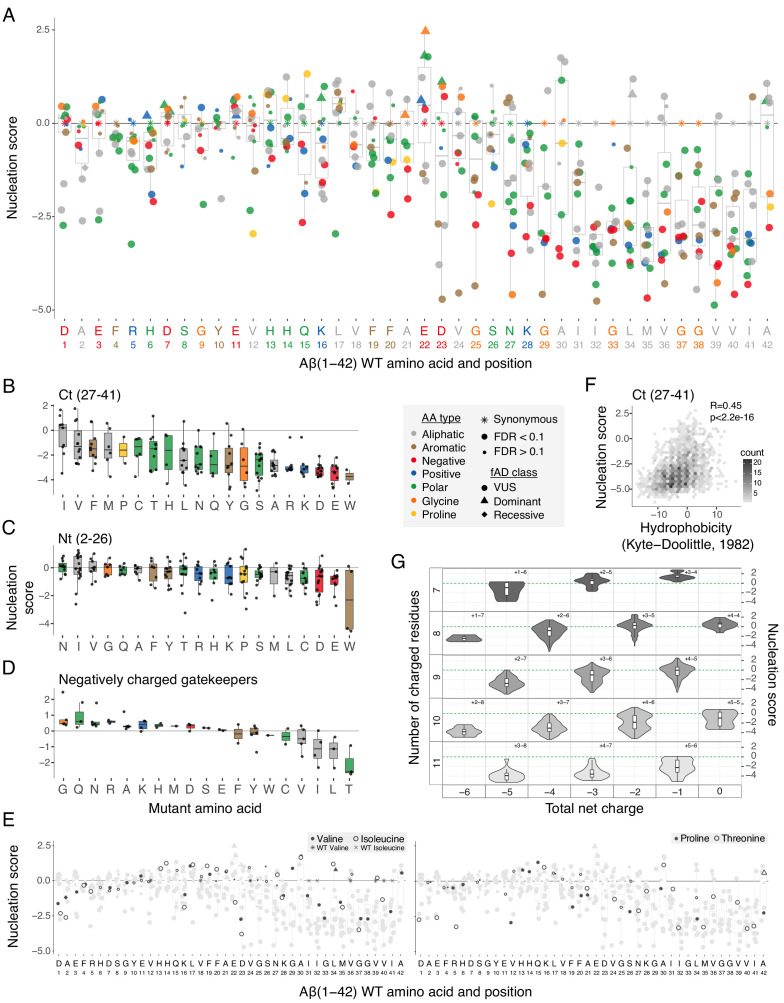
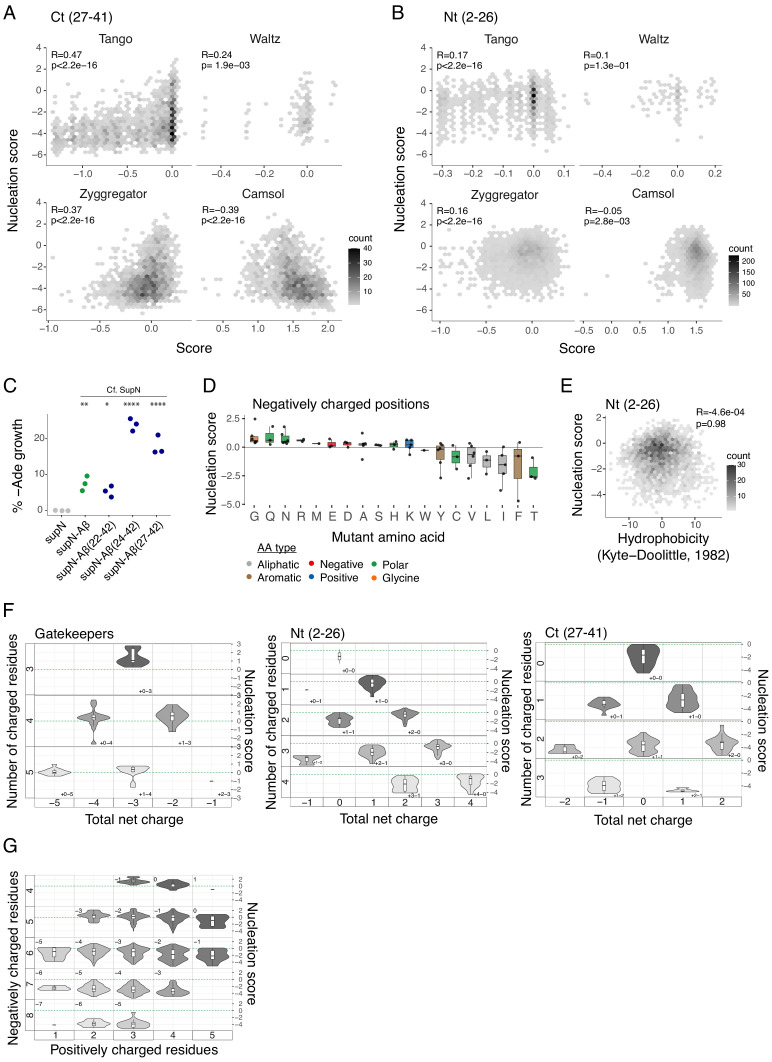
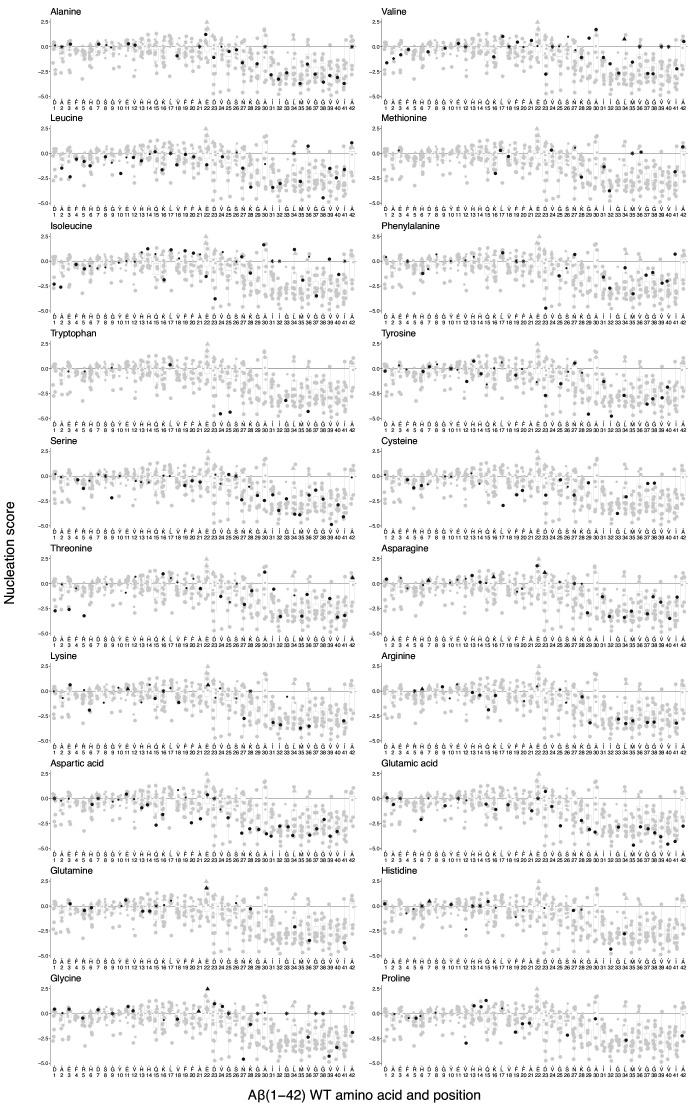
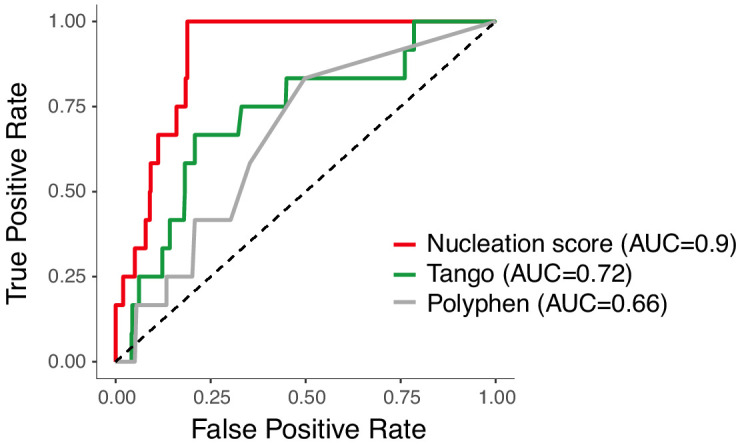
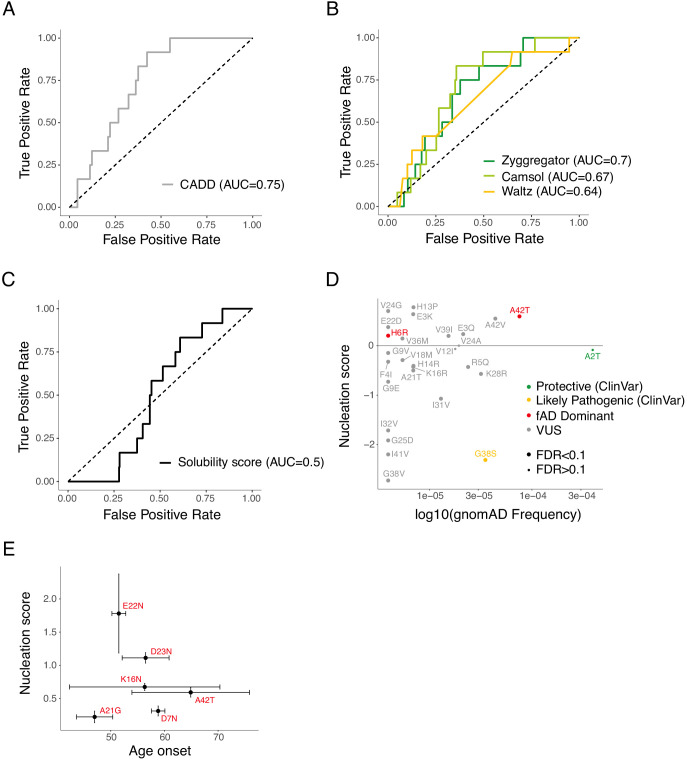
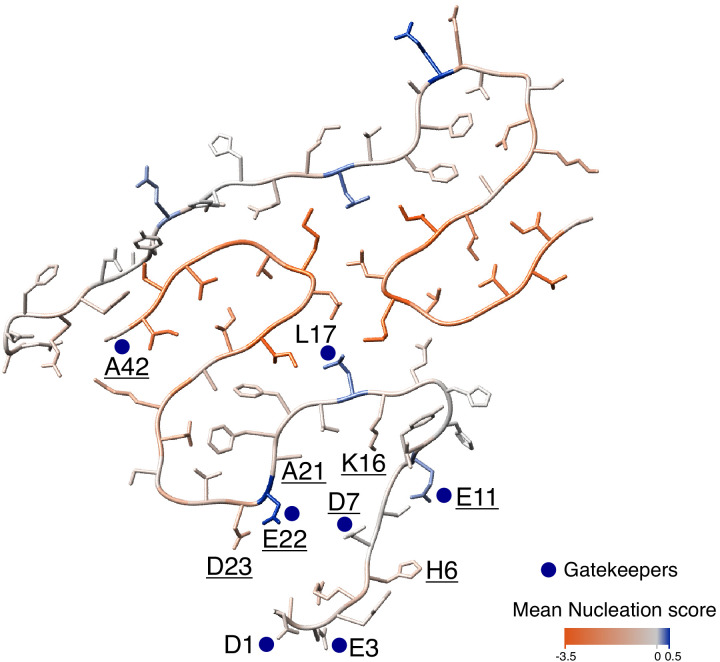
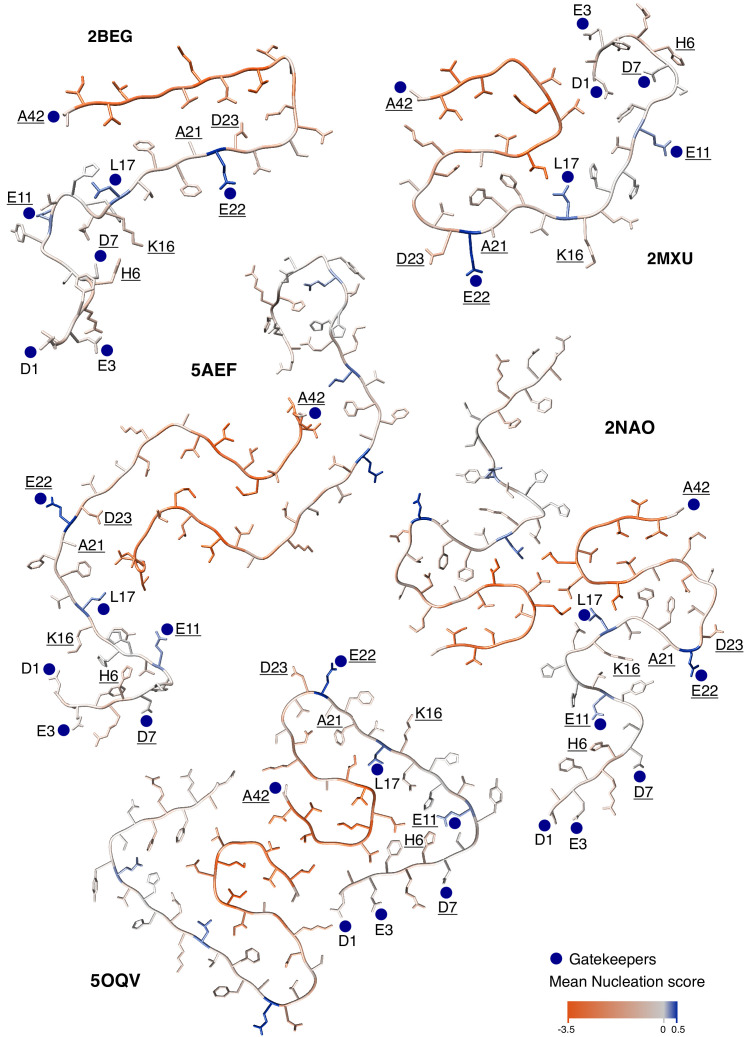
Plaques of the amyloid beta (Aß) peptide are a pathological hallmark of Alzheimer's disease (AD), the most common form of dementia. Mutations in Aß also cause familial forms of AD (fAD). Here, we use deep mutational scanning to quantify the effects of >14,000 mutations on the aggregation of Aß. The resulting genetic landscape reveals mechanistic insights into fibril nucleation, including the importance of charge and gatekeeper residues in the disordered region outside of the amyloid core in preventing nucleation. Strikingly, unlike computational predictors and previous measurements, the empirical nucleation scores accurately identify all known dominant fAD mutations in Aß, genetically validating that the mechanism of nucleation in a cell-based assay is likely to be very similar to the mechanism that causes the human disease. These results provide the first comprehensive atlas of how mutations alter the formation of any amyloid fibril and a resource for the interpretation of genetic variation in Aß.

Keywords: Alzheimer's; S. cerevisiae; aggregation; amyloid; computational biology; deep mutagenesis; genetics; genomics; nucleation; systems biology.

Plain language summary

Alzheimer’s disease is the most common form of dementia, affecting more than 50 million people worldwide. Despite more than 400 clinical trials, there are still no effective drugs that can prevent or treat the disease. A common target in Alzheimer’s disease trials is a small protein called amyloid beta. Amyloid beta proteins are ‘sticky’ molecules. In the brains of people with Alzheimer’s disease, they join to form first small aggregates and then long chains called fibrils, a process which is toxic to neurons. Specific mutations in the gene for amyloid beta are known to cause rare, aggressive forms of Alzheimer’s disease that typically affect people in their fifties or sixties. But these are not the only mutations that can occur in amyloid beta. In principle, any part of the protein could undergo mutation. And given the size of the human population, it is likely that each of these mutations exists in someone alive today. Seuma et al. reasoned that studying these mutations could help us understand the process by which amyloid beta forms new aggregates. Using an approach called deep mutational scanning, Seuma et al. mutated each point in the protein, one at a time. This produced more than 14,000 different versions of amyloid beta. Seuma et al. then measured how quickly these mutants were able to form aggregates by introducing them into yeast cells. All the mutations known to cause early-onset Alzheimer’s disease accelerated amyloid beta aggregation in the yeast. But the results also revealed previously unknown properties that control how fast aggregation occurs. In addition, they highlighted a number of positions in the amyloid beta sequence that act as ‘gatekeepers’. In healthy brains, these gatekeepers prevent amyloid beta proteins from sticking together. When mutated, they drive the protein to form aggregates. This comprehensive dataset will help researchers understand how proteins form toxic aggregates, which could in turn help them find ways to prevent this from happening. By providing an ‘atlas’ of all possible amyloid beta mutations, the dataset will also help clinicians interpret any new mutations they encounter in patients. By showing whether or not a mutation speeds up aggregation, the atlas will help clinicians predict whether that mutation increases the risk of Alzheimer’s disease.


Conflict of interest statement

MS, AF, MB, BL, BB No competing interests declared

Figures

Figure 1.
Figure 1.. Deep mutagenesis of amyloid beta (Aß) nucleation.
(A) In vivo Aß selection assay. Aß fused to the Sup35N domain seeds aggregation of endogenous Sup35p causing a read-through of a premature UGA in the Ade1-14 reporter, allowing the cells to grow in medium lacking adenine. (B) Correlation of nucleation scores for biological replicates 1 and 2 for single and double amino acid (aa) mutants. Pearson correlation coefficient and p-value are indicated (Figure 1—figure supplement 1B) n = 10,157 genotypes. (C) Correlation of nucleation scores with in vitro primary and secondary nucleation and elongation rate constants (Yang et al., 2018). Weighted Pearson correlation coefficient and p-value are indicated. (D) Nucleation scores as a function of principal component 1 (PC1) aa property changes (Bolognesi et al., 2019) for single and double aa mutants (n = 14,483 genotypes). Weighted Pearson correlation coefficient and p-value are indicated. (E) Solubility scores (Gray et al., 2019) as a function of PC1 changes (Bolognesi et al., 2019) for n = 895 single and double mutants. Pearson correlation coefficient and p-value are indicated.
Figure 1—figure supplement 1.
Figure 1—figure supplement 1.. Reproducibility of the assay and correlation with in vitro fibril nucleation.
(A) Percentage of yeast growth in medium lacking adenine for sup35N, amyloid beta (Aß) and sup35N-Aß constructions. (B) Correlation of nucleation scores for biological replicates 1 and 3 (n = 4,124 genotypes) and 2 and 3 (n = 4093) for single and double amino acid (aa) mutants. Pearson correlation coefficient and p-value are indicated. (C) Correlation of nucleation scores with in vitro combined rate constants for primary nucleation, secondary nucleation, conversion of secondary nuclei and saturation of secondary nucleation (Yang et al., 2018). Weighted Pearson correlation coefficient and p-value are indicated. (D) Correlation of solubility scores (Yang et al., 2018) with in vitro combined rate constants for primary nucleation, secondary nucleation, elongation, conversion of secondary nuclei, and saturation of secondary nucleation (Yang et al., 2018). Weighted Pearson correlation coefficient and p-value are indicated.
Figure 2.
Figure 2.. Modular organization of mutational effects in amyloid beta (Aß).
(A and B) Nucleation scores distribution for single (A) and double (B) amino acid (aa) mutants. n = 468 (missense), n = 31 (nonsense), n = 90 (synonymous) for singles, and n = 14,015 (missense) for doubles. Vertical dashed line indicates wild-type (WT) score (0). (C) Heatmap of nucleation scores for single aa mutants. The WT aa and position are indicated in the x-axis and the mutant aa is indicated on the y-axis, both coloured by aa class. Variants not present in the library are represented in white. Synonymous mutants are indicated with ‘*’ and familial Alzheimer’s disease (fAD) mutants with a box, coloured by fAD class. (D) Number of variants significantly increasing (blue) and decreasing (orange) nucleation at different false discovery rates (FDRs). Gatekeeper positions (D1, E3, D7, E11, L17, E22, and A42) are indicated on top of the corresponding bar and coloured on the basis of aa type. The N-terminal and C-terminal definitions are indicated on the x-axis. Gatekeeper positions are excluded from the N-terminal and C-terminal classes. (E) Aa position distributions for variants that increase (+), decrease (−), or have no effect on nucleation (WT-like) (FDR < 0.1). (F) Nucleation score distributions for the three clusters of positions defined on the basis of nucleation: Nt (2-26), Ct (27-41), and gatekeeper positions (clusters are mutually exclusive). Horizontal line indicates WT nucleation score (0). Nonsense (stop) mutants were only included in A and C. Boxplots represent median values and the lower and upper hinges correspond to the 25th and 75th percentiles, respectively. Whiskers extend from the hinge to the largest value no further than 1.5*IQR (interquartile range). Outliers are plotted individually or omitted when the boxplot is plotted together with individual data points or a violin plot.
Figure 2—figure supplement 1.
Figure 2—figure supplement 1.. Mutational effects in amyloid beta (Aß).
(A) Heatmap of nucleation score categories for single amino acid (aa) variants at different false discovery rates (FDR) (blue: increased nucleation, orange: decreased nucleation, grey: not different from wild-type [WT]). The WT aa and position are indicated on the x-axis and the mutant aa is indicated on the y-axis, both coloured on the basis of aa type class (see legend). Variants not present in the library are represented in white. Synonymous mutants are indicated with ‘*’. Nonsense mutations (stop) were included. (B) K-medoids clustering of single aa variant nucleation scores estimates by residue position. Silhouette widths for all positions with K = 2.
Figure 3.
Figure 3.. Determinants of amyloid beta (Aß) nucleation.
(A) Effect of single aa mutants on nucleation for each Aß position. The wild-type (WT) aa and position are indicated on the x-axis and coloured on the basis of aa type. The horizontal line indicates the WT nucleation score (0). (B to D) Effect of each mutant aa on nucleation for the Ct (27-41) (B), the Nt (2-26) (C), and the negatively charged gatekeeper positions (D1, E3, D7, E11, and E22) (D). The three position clusters are mutually exclusive. Colour code indicates aa type. The horizontal line is set at the WT nucleation score (0). (E) Effect on nucleation for single aa mutations to proline, threonine, valine, and isoleucine. Mutations to other aa are indicated in grey. The horizontal line indicates WT nucleation score (0). Point size and shape indicate false discovery rate (FDR) and familial Alzheimer’s disease (fAD) class, respectively (see legend). (F) Nucleation scores as a function of hydrophobicity changes (Kyte and Doolittle, 1982) for single and double aa mutants in the Ct (27-41) cluster. Only double mutants with both mutations in the indicated position-range were used. Weighted Pearson correlation coefficient and p-value are indicated. (G) Nucleation score distributions arranged by the number of charged residues (y-axis) and the total net charge (x-axis) for single and double aa mutants in the full peptide (1-42). Only polar, charged, and glycine aa types were taken into account, for both WT and mutant residues. Colour gradient indicates the total number of charged residues. Numbers inside each cell indicate the number of positive and negative residues. The horizontal line indicates WT nucleation score (0). Boxplots represent median values and the lower and upper hinges correspond to the 25th and 75th percentiles, respectively. Whiskers extend from the hinge to the largest value no further than 1.5*IQR (interquartile range). Outliers are plotted individually or omitted when the boxplot is plotted together with individual data points or a violin plot.
Figure 3—figure supplement 1.
Figure 3—figure supplement 1.. Determinants of amyloid beta (Aß) nucleation.
(A and B) Nucleation scores as a function of aggregation predictors (Tango, Waltz, Zyggregator, and Camsol; Tartaglia and Vendruscolo, 2008; Fernandez-Escamilla et al., 2004; Oliveberg, 2010; Sormanni et al., 2015) for single and double aa mutants in the Ct (27-41) (A) and Nt (2-26) (B) clusters (gatekeeper positions are excluded from the N-terminal and C-terminal classes). Only double mutants with both mutations in the indicated position-range were used. Weighted Pearson correlation coefficient and p-value are indicated. (C) Percentage of yeast growth in medium lacking adenine for sup35N, supN-Aß, and supN-Aß C-terminal fragments 22-42, 24-42, and 27-42. One-way ANOVA with Dunnett’s multiple comparisons test. *p<0.05, **p<0.01, ***p<0.001, ****p<0.0001. (D) Effect of each mutant aa on nucleation for the six negatively charged positions (D1, E3, D7, E11, E22, and D23). Colour code indicates aa type (see legend). The horizontal line is set at the wild-type (WT) nucleation score (0). (E) Nucleation scores as a function of hydrophobicity changes (Kyte and Doolittle, 1982) for single and double aa mutants in the Nt (2-26) cluster. Only double mutants with both mutations in the indicated position-range were used. Weighted Pearson correlation coefficient and p-value are indicated. (F) Nucleation scores distributions arranged by the number of charged residues (y-axis) and the total net charge (x-axis) for single and double aa mutants in the Nt (2-26), Ct (27-41), and gatekeepers (D1, E3, D7, E11, L17, E22, and A42) clusters. Only double mutants with both mutations in the indicated position-range were used. Only polar, charged, and glycine aa types were taken into account, for both WT and mutant residues. Colour gradient indicates the total number of charged residues. Numbers inside each cell indicate the number of positive and negative residues. The horizontal line indicates WT nucleation score (0). (F) Nucleation score distributions arranged by the number of negatively charged residues (y-axis) and the number of positively charged (x-axis) for single and double aa mutants in the full peptide (1-42). Only polar, charged, and glycine aa types were taken into account, for both WT and mutant residues. Colour gradient indicates the total number of charged residues. Numbers inside each cell indicate the total net charge. The horizontal line indicates WT nucleation score (0). Boxplots represent median values and the lower and upper hinges correspond to the 25th and 75th percentiles, respectively. Whiskers extend from the hinge to the largest value no further than 1.5*IQR (interquartile range). Outliers are plotted individually or omitted when the boxplot is plotted together with individual data points or a violin plot.
Figure 3—figure supplement 2.
Figure 3—figure supplement 2.. Effect of mutations to each specific amino acid (aa) on amyloid beta (Aß) nucleation.
Mutations to other aa are indicated in grey. The wild-type (WT) AA is indicated with ‘*’. The horizontal line indicates WT nucleation score (0). Point size indicates false discovery rate (FDR) (big, FDR < 0.1; small, FDR > 0.1) and shape indicates familial Alzheimer’s disease (fAD) class (round, variants of uncertain significance [VUS]; triangle, dominant; rhombus, recessive). Boxplots represent median values and the lower and upper hinges correspond to the 25th and 75th percentiles, respectively. Whiskers extend from the hinge to the largest value no further than 1.5*IQR (interquartile range). Outliers are plotted individually or omitted when the boxplot is plotted together with individual data points or a violin plot.
Figure 4.
Figure 4.. Amyloid beta (Aß) nucleation accurately discriminates dominant familial Alzheimer’s disease (fAD) variants.
Receiver operating characteristic (ROC) curves for 12 fAD mutants versus all other single aa mutants in the dataset. Area under the curve (AUC) values are indicated in the legend. Diagonal dashed line indicates the performance of a random classifier. The nucleation scores and categories for all fAD variants are reported in Supplementary file 1.
Figure 4—figure supplement 1.
Figure 4—figure supplement 1.. Discrimination of familial Alzheimer’s disease (fAD) variants by aggregation and variant effect predictors.
(A and B) Receiver operating characteristic (ROC) curves built using 12 fAD mutants versus all other single amino acid (aa) mutants in the dataset for variant effect predictors (A) and aggregation predictors (B). Area under the curve (AUC) values are indicated in the legend. Diagonal dashed lines indicate the performance of a random classifier. (C) ROC curve built using 12 fAD mutants versus all other single aa mutants available in the referenced study (Gray et al., 2019). AUC value is indicated in the legend. Diagonal dashed line indicates the performance of a random classifier. (D) Comparison between nucleation scores (NS) and gnomAD (Karczewski, 2020) allele frequencies (https://gnomad.broadinstitute.org/). The horizontal line indicates wild-type (WT) NS (0). The classification of variants is based on Clinvar annotations (https://www.ncbi.nlm.nih.gov/clinvar/). (E) Relation between NS and clinical age-of-onset (Ryman et al., 2014). Vertical and horizontal error lines indicate estimated error associated to NS and standard deviation for age-of-onset, respectively.
Figure 5.
Figure 5.. Mutational landscape of the amyloid beta (Aß) amyloid fibril.
Average effect of mutations visualized on the cross-section of an Aß amyloid fibril (PDB accession 5KK3; Colvin et al., 2016). Nucleation gatekeeper residues and known familial Alzheimer’s disease (fAD) mutations positions are indicated by the wild-type (WT) aa identity on one of the two monomers; gatekeepers are indicated with blue dots and fAD are underlined. A single layer of the fibril is shown and the unstructured N-termini (aa 1-14) are shown with different random coil conformations for the two Aß monomers. See Figure 5—figure supplement 2 for alternative Aß42 amyloid polymorphs.
Figure 5—figure supplement 1.
Figure 5—figure supplement 1.. Modular organization of Aß42 and Aß40 polymorphs.
Linear organization of the Aß42 and Aß40 fibrils. Disordered/unstructured and structured residues are indicated.
Figure 5—figure supplement 2.
Figure 5—figure supplement 2.. Modular organization of mutational effects and gatekeepers visualized on Aß42 polymorphs.
Average effect of mutations visualized on the cross-section of various amyloid beta (Aß) amyloid polymorphs: PDB accession 2BEG (Lührs et al., 2005), 2MXU (Xiao et al., 2015), 5AEF (Schmidt et al., 2015), 2NAO (Wälti et al., 2016), and 5OQV (Gremer et al., 2017). Nucleation gatekeeper residues and known familial Alzheimer’s disease (fAD) mutations positions are indicated by the wild-type (WT) aa identity on one of the two monomers; gatekeepers are indicated with blue dots and fAD are underlined. A single layer of the fibril is shown and the unstructured N-termini are shown with different random coil conformations for the two Aß monomers.

Comment in

  • Exploring the origins of nucleation.
    Zoltowska KM, Chávez-Gutiérrez L. Zoltowska KM, et al. Elife. 2021 Mar 10;10:e67269. doi: 10.7554/eLife.67269. Elife. 2021. PMID: 33688830 Free PMC article.

References

    1. Adzhubei I, Jordan DM, Sunyaev SR. Predicting functional effect of human missense mutations using PolyPhen‐2. Current Protocols in Human Genetics. 2013;76:76. doi: 10.1002/0471142905.hg0720s76. - DOI - PMC - PubMed
    1. Aprile FA, Sormanni P, Perni M, Arosio P, Linse S, Knowles TPJ, Dobson CM, Vendruscolo M. Selective targeting of primary and secondary nucleation pathways in Aβ42 aggregation using a rational antibody scanning method. Science Advances. 2017;3:e1700488. doi: 10.1126/sciadv.1700488. - DOI - PMC - PubMed
    1. Ballard C, Gauthier S, Corbett A, Brayne C, Aarsland D, Jones E. Alzheimer's disease. The Lancet. 2011;377:1019–1031. doi: 10.1016/S0140-6736(10)61349-9. - DOI - PubMed
    1. Benilova I, Gallardo R, Ungureanu A-A, Castillo Cano V, Snellinx A, Ramakers M, Bartic C, Rousseau F, Schymkowitz J, De Strooper B. The Alzheimer disease protective mutation A2T modulates kinetic and thermodynamic properties of Amyloid-β (Aβ) Aggregation. Journal of Biological Chemistry. 2014;289:30977–30989. doi: 10.1074/jbc.M114.599027. - DOI - PMC - PubMed
    1. Bolognesi B, Kumita JR, Barros TP, Esbjorner EK, Luheshi LM, Crowther DC, Wilson MR, Dobson CM, Favrin G, Yerbury JJ. ANS binding reveals common features of cytotoxic amyloid species. ACS Chemical Biology. 2010;5:735–740. doi: 10.1021/cb1001203. - DOI - PubMed

Publication types

Associated data