

Machine learning techniques to detect and forecast the daily total COVID-19 infected and deaths cases under different lockdown types
- PMID: 33522669
- PMCID: PMC8014446
- DOI: 10.1002/jemt.23702
Machine learning techniques to detect and forecast the daily total COVID-19 infected and deaths cases under different lockdown types
Abstract
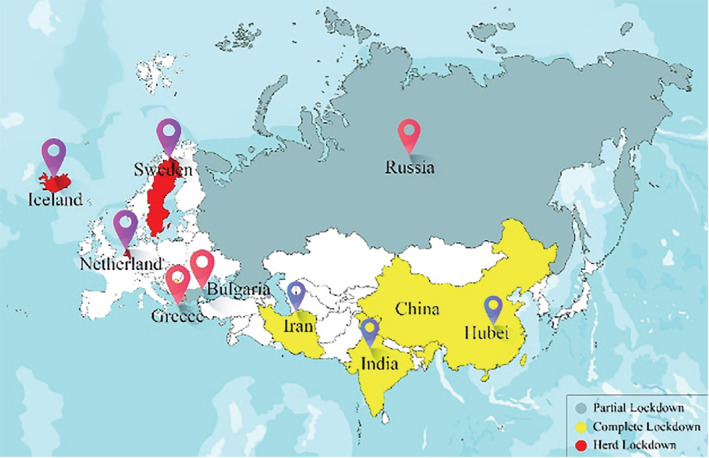
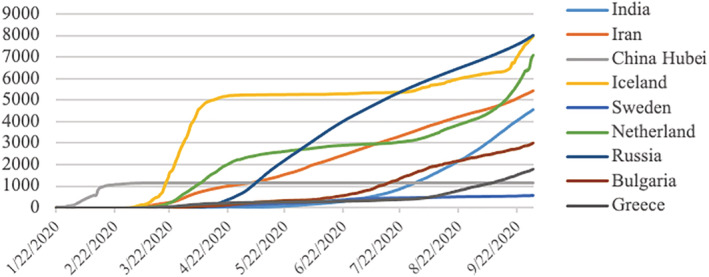
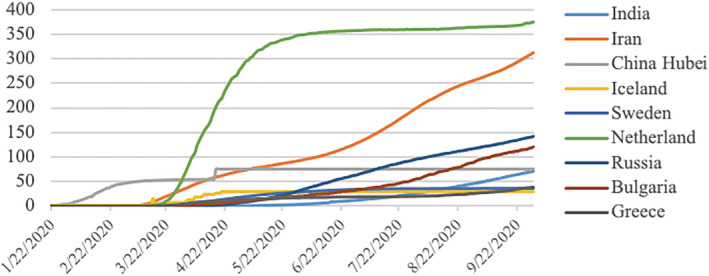
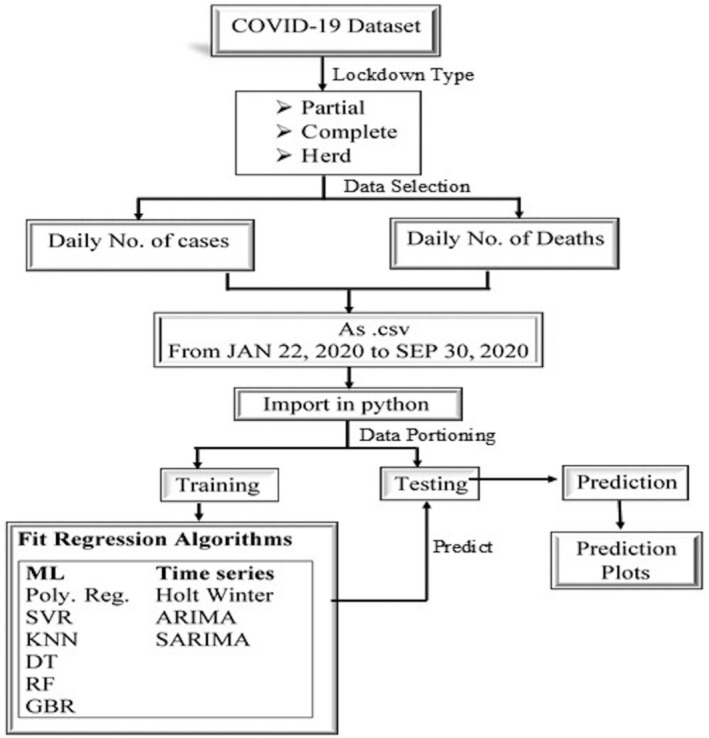
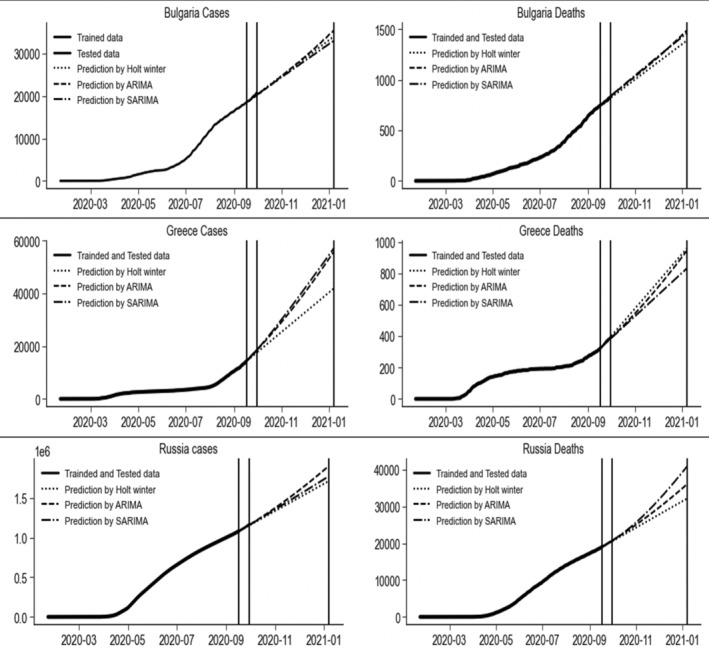
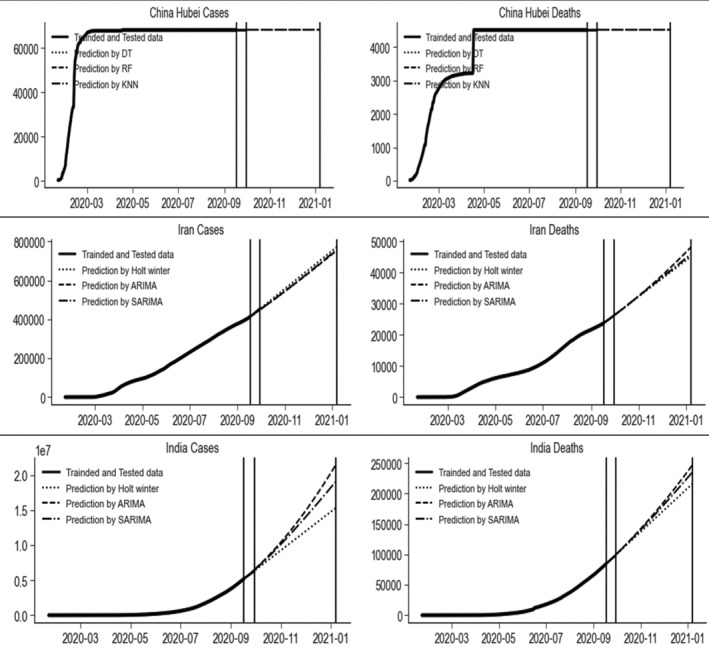
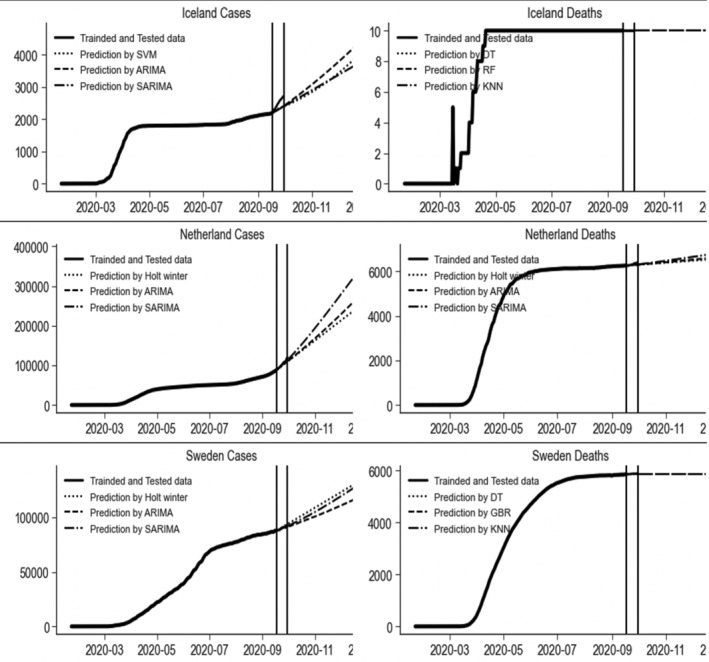
COVID-19 has impacted the world in many ways, including loss of lives, economic downturn and social isolation. COVID-19 was emerged due to the SARS-CoV-2 that is highly infectious pandemic. Every country tried to control the COVID-19 spread by imposing different types of lockdowns. Therefore, there is an urgent need to forecast the daily confirmed infected cases and deaths in different types of lockdown to select the most appropriate lockdown strategies to control the intensity of this pandemic and reduce the burden in hospitals. Currently are imposed three types of lockdown (partial, herd, complete) in different countries. In this study, three countries from every type of lockdown were studied by applying time-series and machine learning models, named as random forests, K-nearest neighbors, SVM, decision trees (DTs), polynomial regression, Holt winter, ARIMA, and SARIMA to forecast daily confirm infected cases and deaths due to COVID-19. The models' accuracy and effectiveness were evaluated by error based on three performance criteria. Actually, a single forecasting model could not capture all data sets' trends due to the varying nature of data sets and lockdown types. Three top-ranked models were used to predict the confirmed infected cases and deaths, the outperformed models were also adopted for the out-of-sample prediction and obtained very close results to the actual values of cumulative infected cases and deaths due to COVID-19. This study has proposed the auspicious models for forecasting and the best lockdown strategy to mitigate the causalities of COVID-19.
Keywords: COVID-19; healthcare; lockdown; lungs infection; machine learning models; public health; time series.
© 2021 Wiley Periodicals LLC.
Conflict of interest statement
Authors declare that they have no competing interests.
Figures
Similar articles
-
Association of lockdowns with the protective role of ultraviolet-B (UVB) radiation in reducing COVID-19 deaths.Sci Rep. 2021 Nov 24;11(1):22851. doi: 10.1038/s41598-021-01908-w. Sci Rep. 2021. PMID: 34819536 Free PMC article.
-
Measuring and Preventing COVID-19 Using the SIR Model and Machine Learning in Smart Health Care.J Healthc Eng. 2020 Oct 29;2020:8857346. doi: 10.1155/2020/8857346. eCollection 2020. J Healthc Eng. 2020. PMID: 33204404 Free PMC article.
-
Forecasting the dynamics of cumulative COVID-19 cases (confirmed, recovered and deaths) for top-16 countries using statistical machine learning models: Auto-Regressive Integrated Moving Average (ARIMA) and Seasonal Auto-Regressive Integrated Moving Average (SARIMA).Appl Soft Comput. 2021 May;103:107161. doi: 10.1016/j.asoc.2021.107161. Epub 2021 Feb 8. Appl Soft Comput. 2021. PMID: 33584158 Free PMC article.
-
Effect of national and local lockdowns on the control of COVID-19 pandemic: a rapid review.Epidemiol Prev. 2020 Sep-Dec;44(5-6 Suppl 2):60-68. doi: 10.19191/EP20.5-6.S2.104. Epidemiol Prev. 2020. PMID: 33412795 Review. English.
-
COVID-19 pandemic: A review of the global lockdown and its far-reaching effects.Sci Prog. 2021 Apr-Jun;104(2):368504211019854. doi: 10.1177/00368504211019854. Sci Prog. 2021. PMID: 34061685 Free PMC article. Review.
Cited by
-
Twitter conversations predict the daily confirmed COVID-19 cases.Appl Soft Comput. 2022 Nov;129:109603. doi: 10.1016/j.asoc.2022.109603. Epub 2022 Sep 5. Appl Soft Comput. 2022. PMID: 36092470 Free PMC article.
-
Microscopic segmentation and classification of COVID-19 infection with ensemble convolutional neural network.Microsc Res Tech. 2022 Jan;85(1):385-397. doi: 10.1002/jemt.23913. Epub 2021 Aug 26. Microsc Res Tech. 2022. PMID: 34435702 Free PMC article.
-
Impact of Post-Covid-19 on driver behaviour: A perspective towards pandemic-sustained transportation.J Transp Health. 2023 Jan;28:101563. doi: 10.1016/j.jth.2022.101563. Epub 2023 Jan 3. J Transp Health. 2023. PMID: 36619698 Free PMC article. Review.
-
Predicting the impact of the third wave of COVID-19 in India using hybrid statistical machine learning models: A time series forecasting and sentiment analysis approach.Comput Biol Med. 2022 May;144:105354. doi: 10.1016/j.compbiomed.2022.105354. Epub 2022 Feb 26. Comput Biol Med. 2022. PMID: 35240374 Free PMC article.
-
A novel bidirectional LSTM deep learning approach for COVID-19 forecasting.Sci Rep. 2023 Oct 20;13(1):17953. doi: 10.1038/s41598-023-44924-8. Sci Rep. 2023. PMID: 37863921 Free PMC article.
References
-
- Al‐Ameen, Z. , Sulong, G. , Rehman, A. , Al‐Dhelaan, A. , Saba, T. , & Al‐Rodhaan, M. (2015). An innovative technique for contrast enhancement of computed tomography images using normalized gamma‐corrected contrast‐limited adaptive histogram equalization. EURASIP Journal on Advances in Signal Processing, 2015, 32. 10.1186/s13634-015-0214-1 - DOI
-
- Bandyopadhyay, S. K. , & Dutta, S. (2020). Machine learning approach for confirmation of COVID‐19 cases: Positive, negative, death and release. medRxiv.
-
- Breiman, L. (2001). Random forests. Machine Learning, 45, 5–32.
-
- Chatfield, C. , & Yar, M. (1988). Holt‐winters forecasting: Some practical issues. Journal of the Royal Statistical Society Series D (The Statistician), 37, 129–140.
MeSH terms
Grants and funding
LinkOut - more resources
Full Text Sources
Other Literature Sources
Medical
Miscellaneous
