. 2021 Feb;40(2):349-358.
doi: 10.1377/hlthaff.2020.01786.

Variation In Telemedicine Use And Outpatient Care During The COVID-19 Pandemic In The United States

Affiliations

Variation In Telemedicine Use And Outpatient Care During The COVID-19 Pandemic In The United States

Sadiq Y Patel et al. Health Aff (Millwood). 2021 Feb.

Abstract

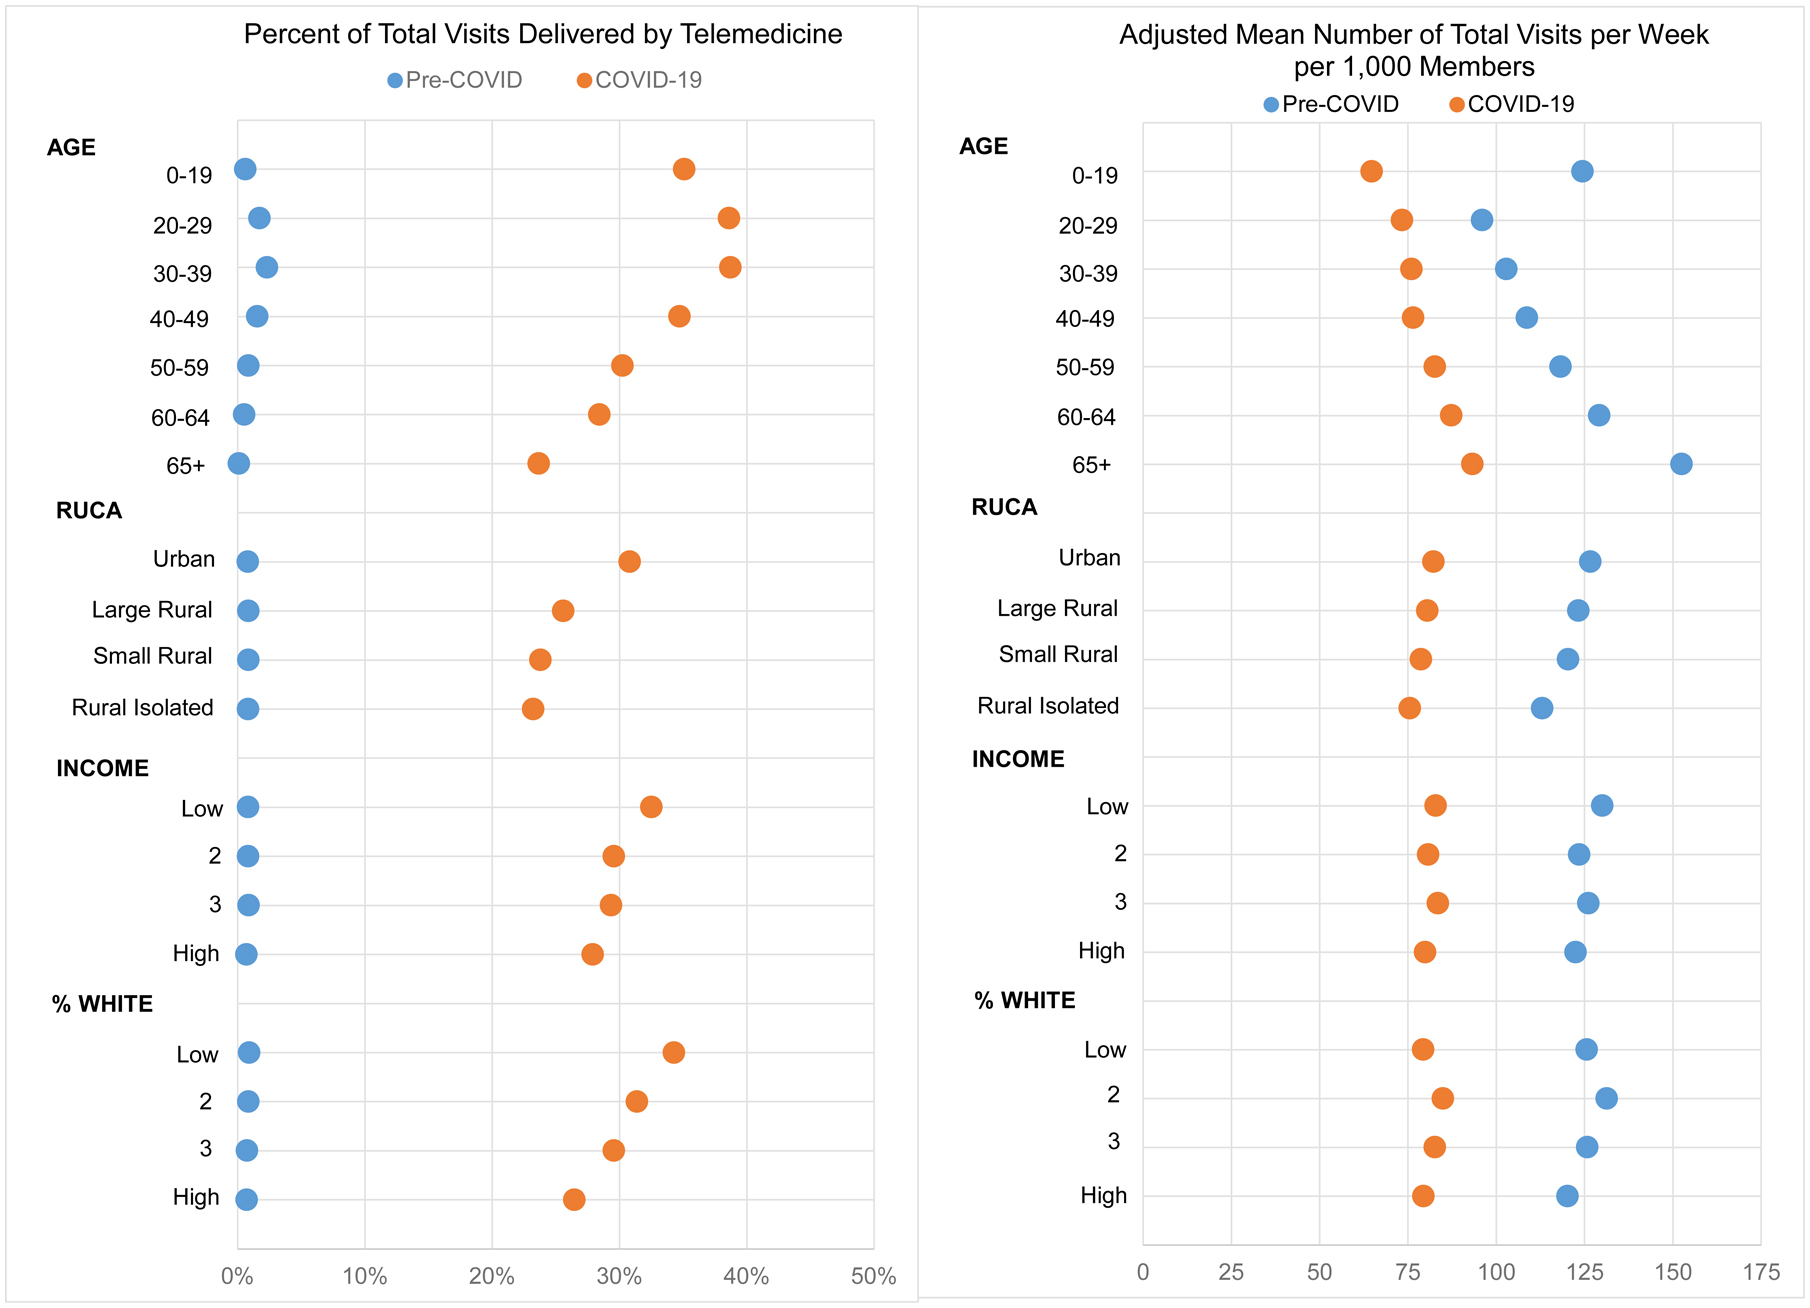
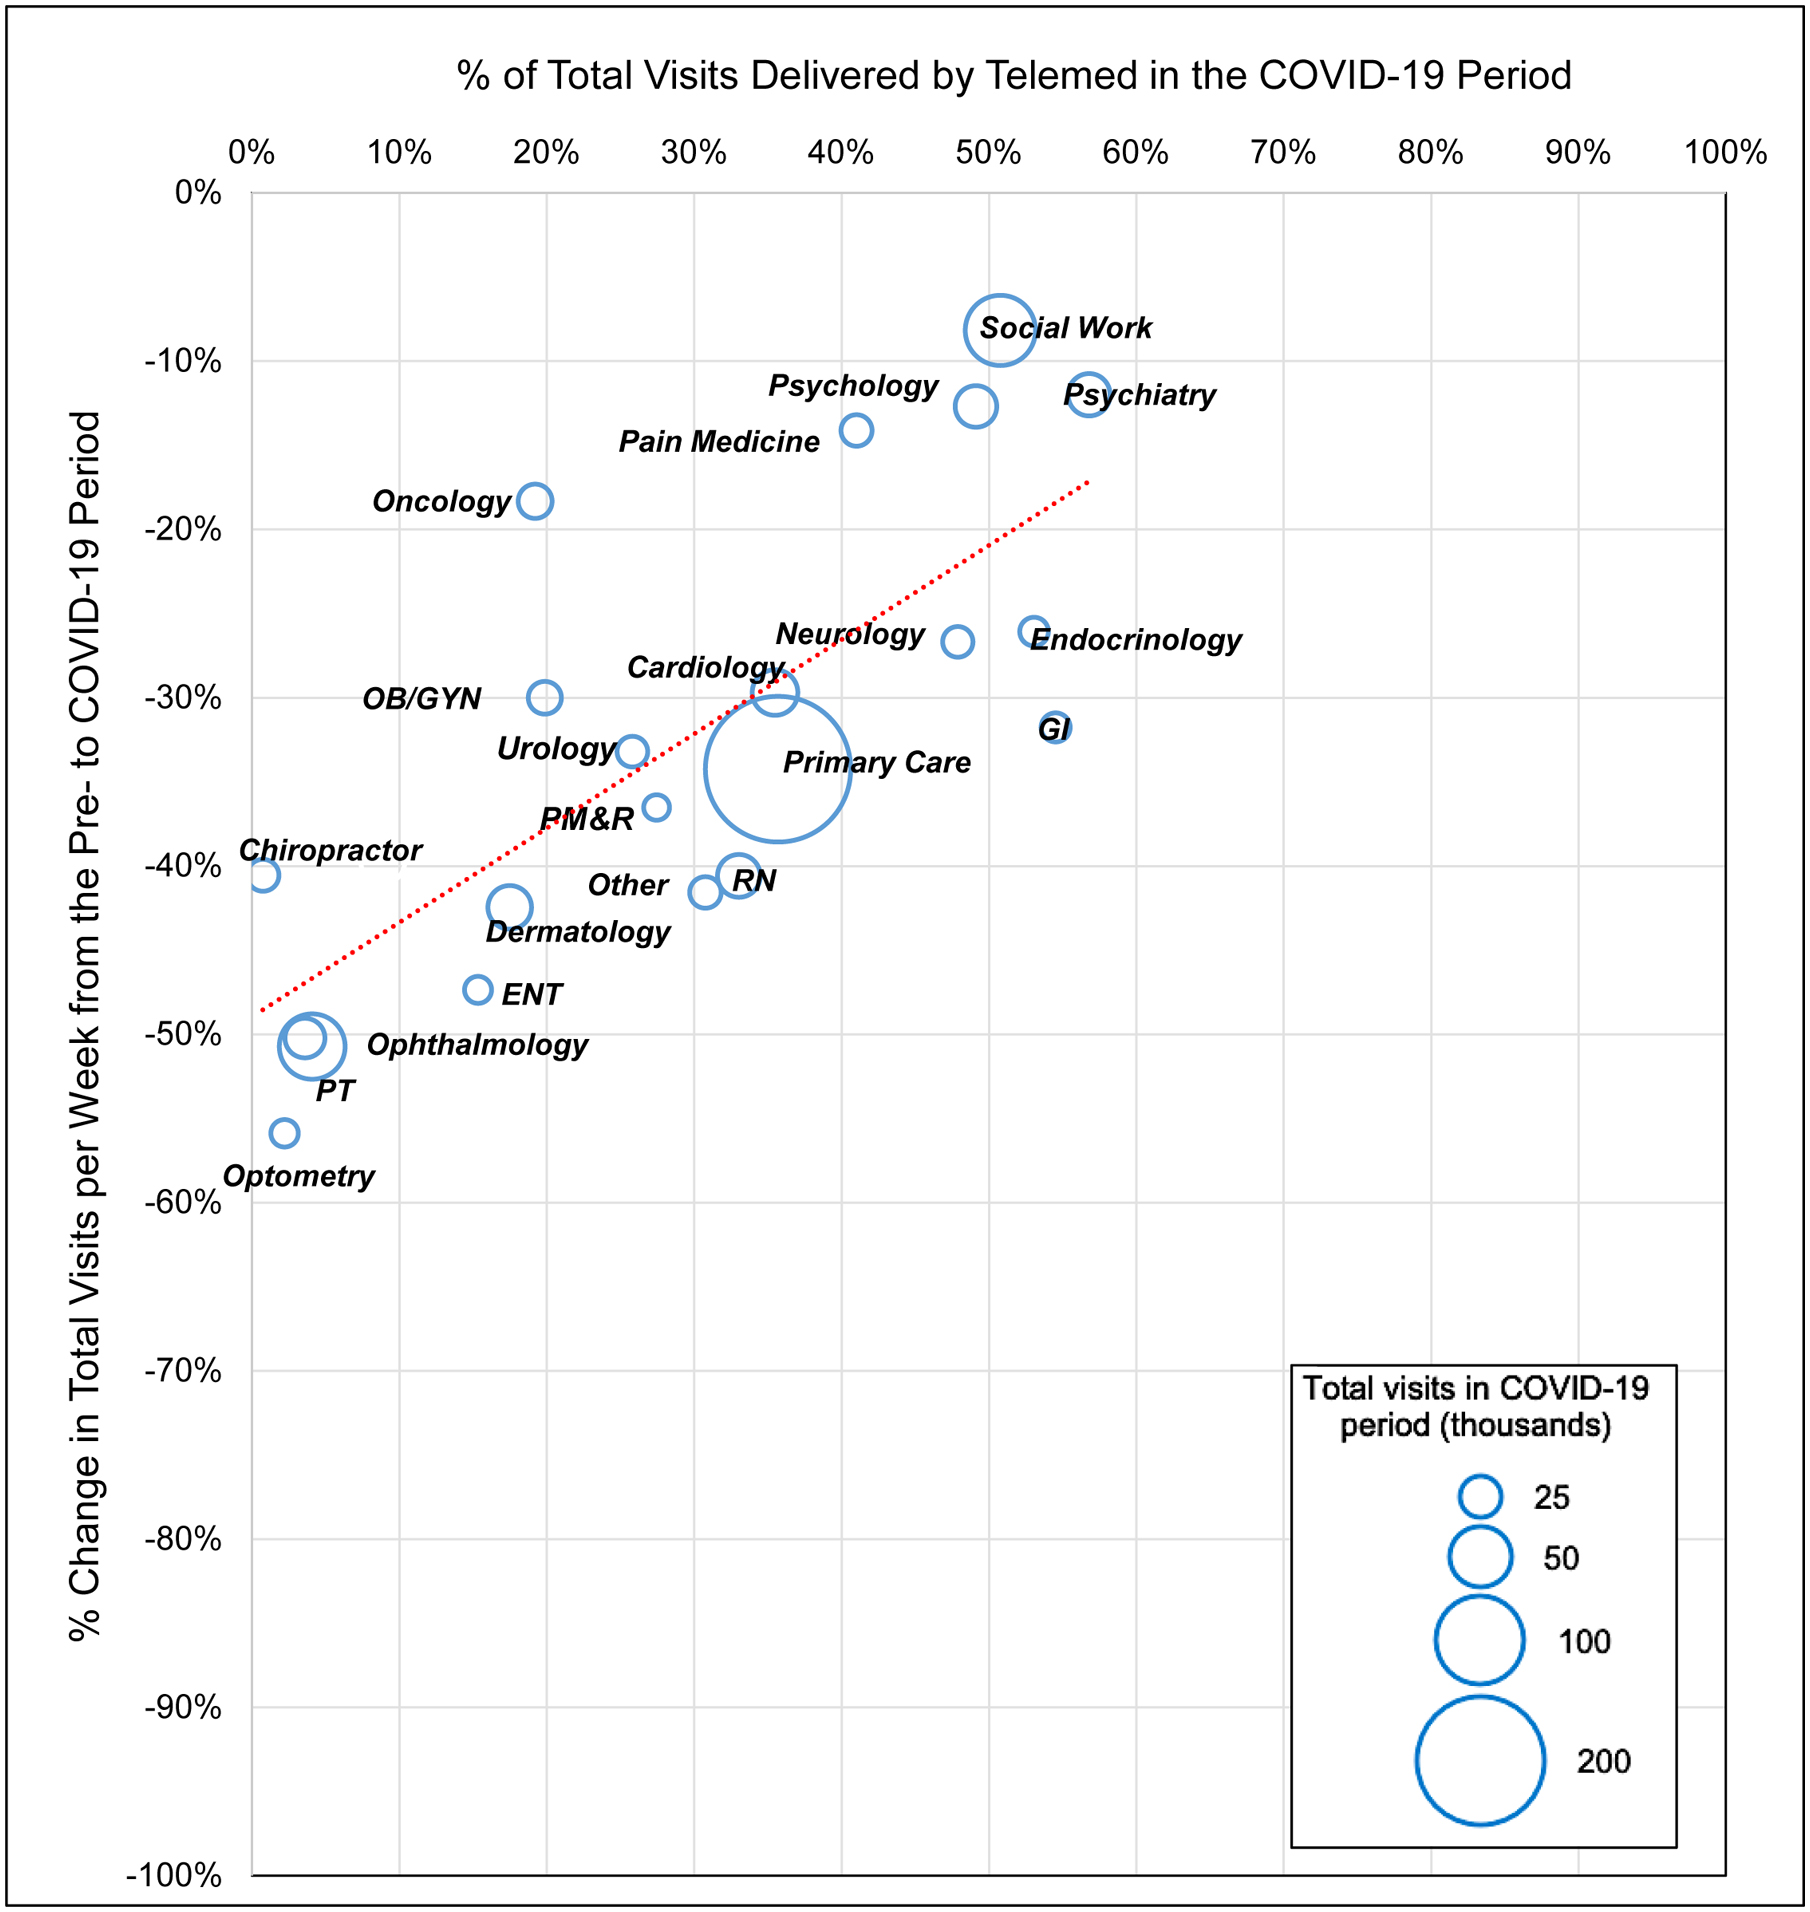
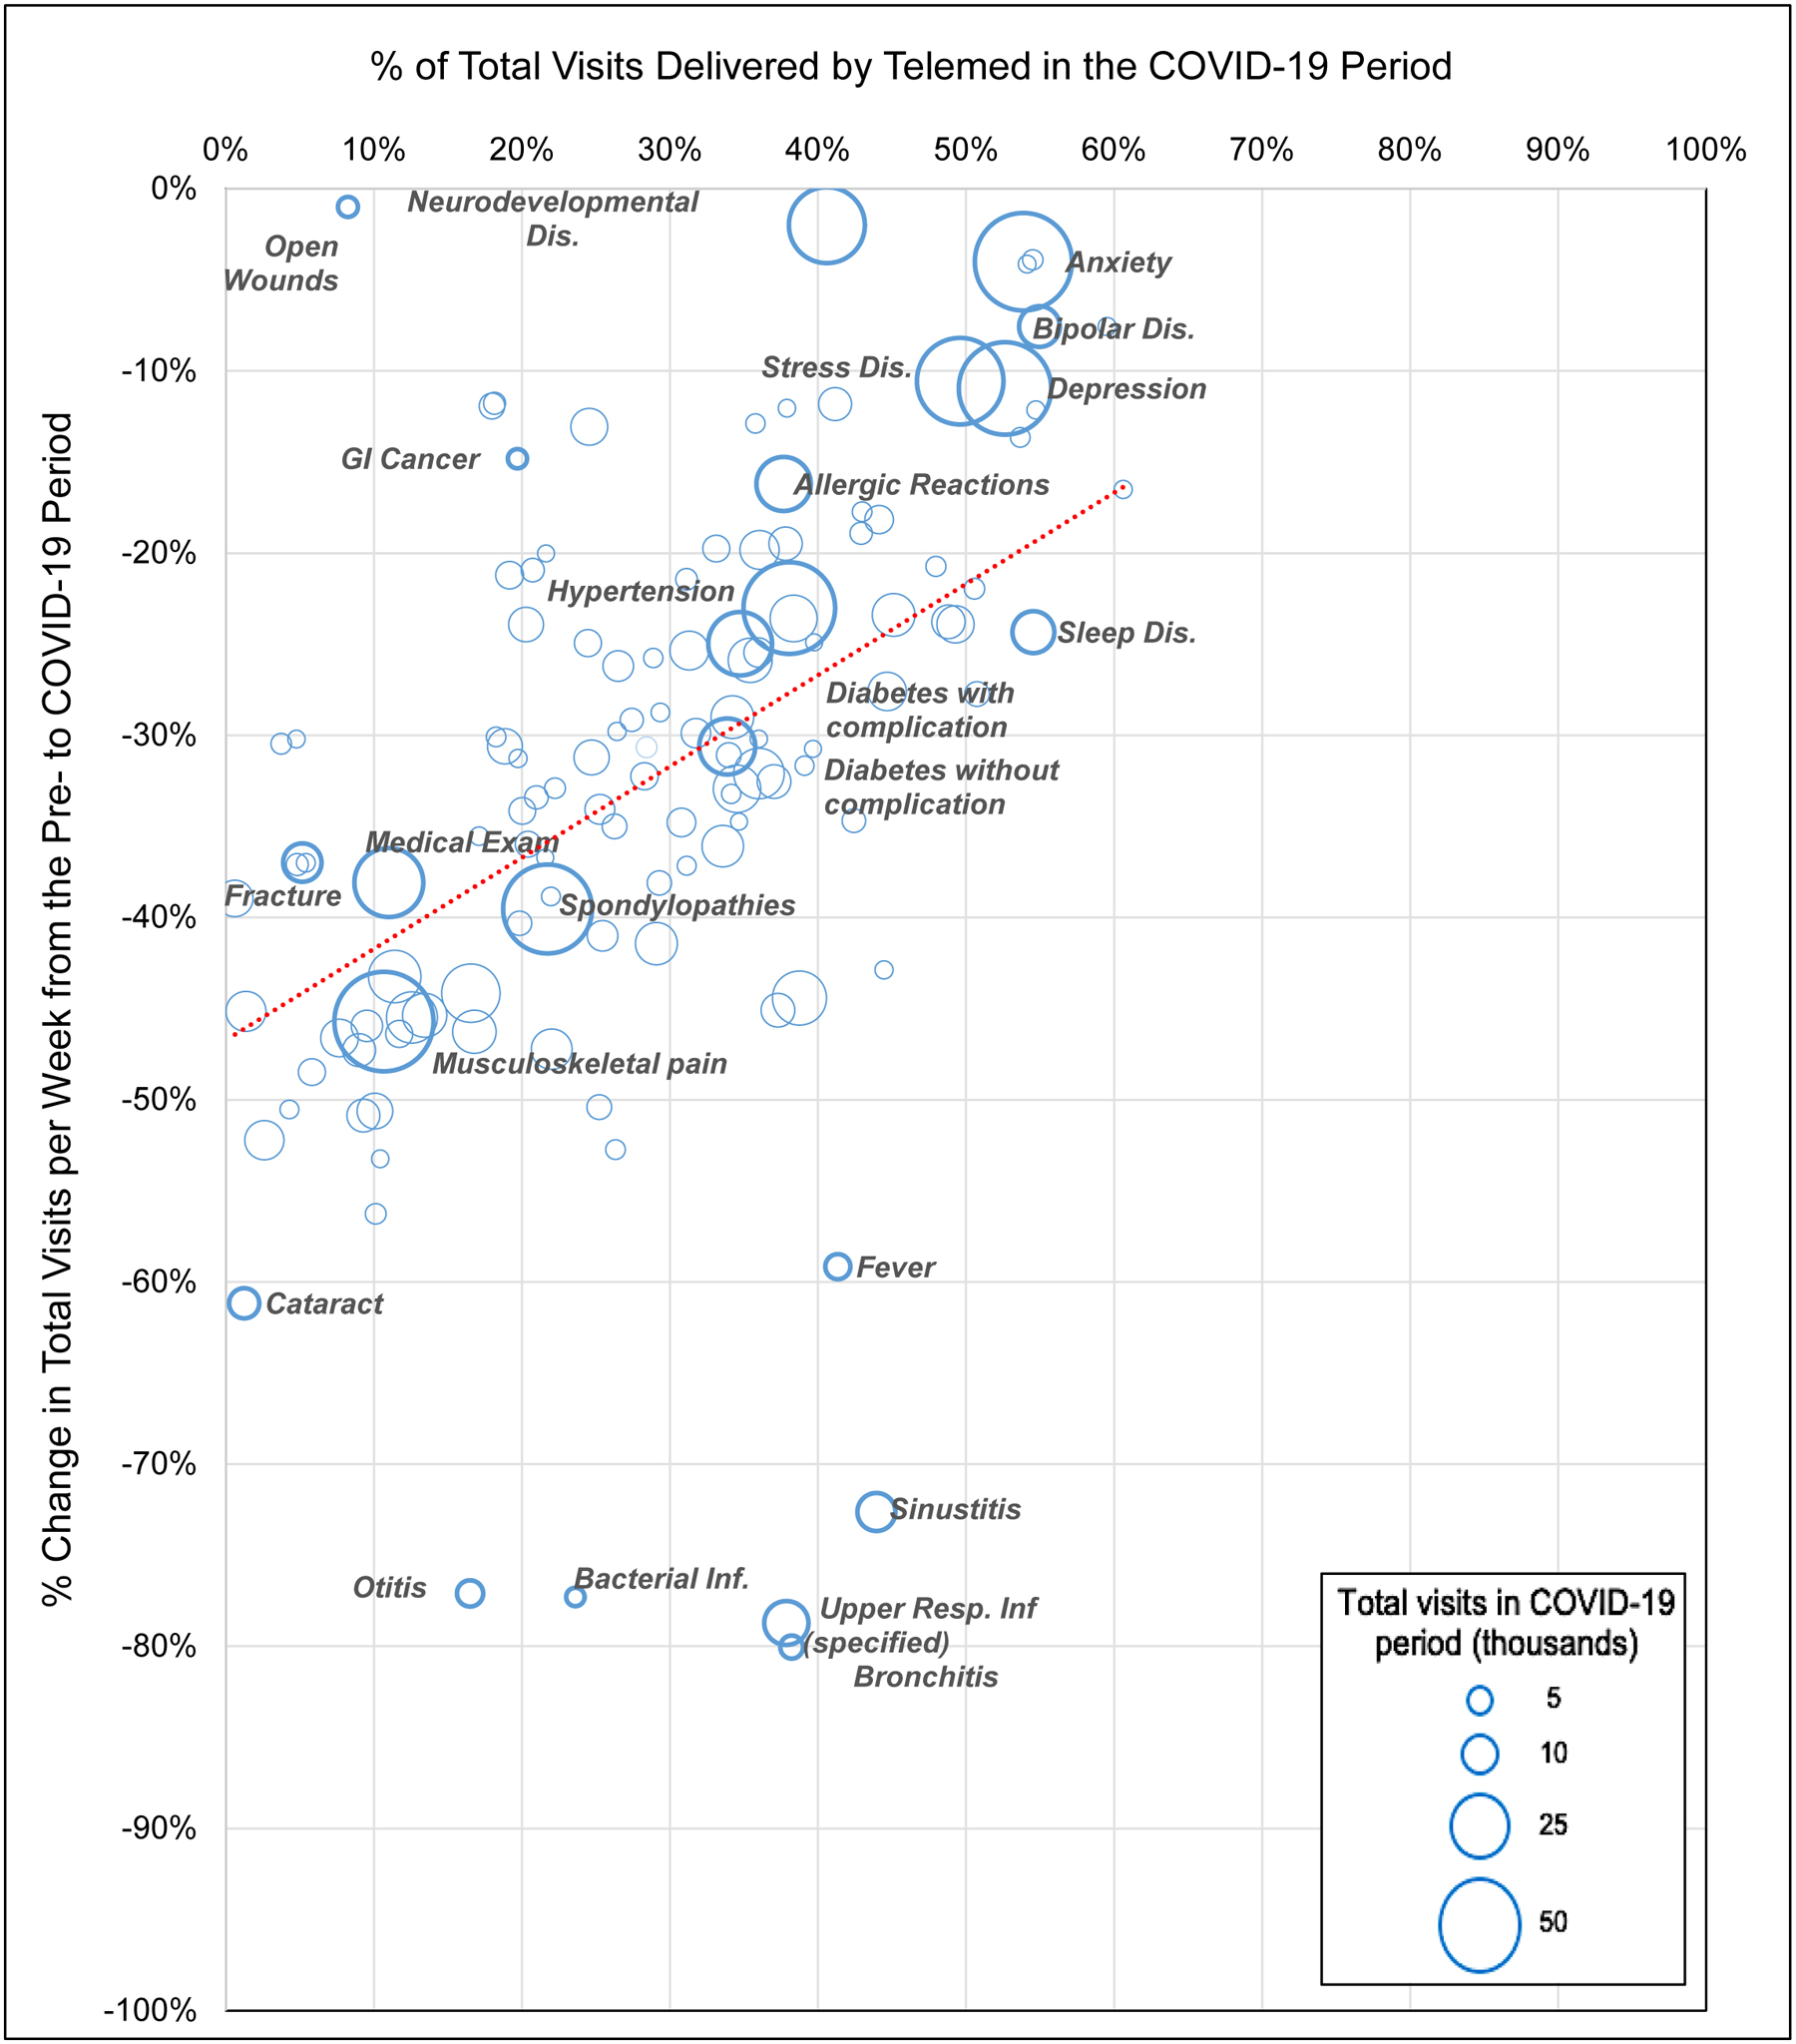
Coronavirus disease 2019 (COVID-19) spurred a rapid rise in telemedicine, but it is unclear how use has varied by clinical and patient factors during the pandemic. We examined the variation in total outpatient visits and telemedicine use across patient demographics, specialties, and conditions in a database of 16.7 million commercially insured and Medicare Advantage enrollees from January to June 2020. During the pandemic, 30.1 percent of all visits were provided via telemedicine, and the weekly number of visits increased twenty-three-fold compared with the prepandemic period. Telemedicine use was lower in communities with higher rates of poverty (31.9 percent versus 27.9 percent for the lowest and highest quartiles of poverty rate, respectively). Across specialties, the use of any telemedicine during the pandemic ranged from 68 percent of endocrinologists to 9 percent of ophthalmologists. Across common conditions, the percentage of visits provided during the pandemic via telemedicine ranged from 53 percent for depression to 3 percent for glaucoma. Higher rates of telemedicine use for common conditions were associated with smaller decreases in total weekly visits during the pandemic.


Figures

EXHIBIT 2
EXHIBIT 2
Percent of Weekly Total Visits Delivered by Telemedicine and Adjusted Mean Number of Weekly Total Visits per 1,000 Members in the Pre- to COVID-19 periods by Demographic Characteristic Authors’ analysis of data from OptumLabs Data Warehouse, January 1, 2020 – June 16, 2020. We measured quartiles of county-level median household income (INCOME) and percent of white individuals (% WHITE) using 2010 US Census data. Incidence rate ratios (IRRs) and average marginal effects (AMEs) for each demographic characteristic in the pre- and COVID-19 period were statistically significant at a p-value of 0.001 (Appendix Exhibits 2 and 3). Left panel presents the percent of total visits delivered by telemedicine in the pre- and COVID-19 period (measured by column 3 divided by column 6 for pre-COVID period and column 9 divided by column 12 for COVID-19 period in Appendix Exhibit 3). Right panel presents the AMEs for total visits for the pre- and COVID-19 period (columns 6 and 12 in Appendix Exhibit 3 for pre- and COVID-19 period, respectively)
EXHIBIT 3
EXHIBIT 3
Correlation of Change in Weekly Total Visits from the Pre- to COVID-19 periods and Weekly Total Visits Delivered by Telemedicine in the COVID-19 period, by Clinician Specialty Authors’ analysis of data from OptumLabs Data Warehouse Circle size indicates the proportion of total visits in the COVID-19 period by clinician specialty (see Appendix Exhibit 1 for full list). r=0.77 for correlation between the two measures. Abbreviations: physical medicine and rehabilitation (PM&R); obstetrics and gynecology (OB/GYN); otolaryngology (ENT); physical therapy (PT); gastroenterology (GI); registered nurse (RN)
EXHIBIT 4
EXHIBIT 4
Correlation of Change in Weekly Total Visits from the Pre- to COVID-19 periods and Weekly Total Visits Delivered by Telemedicine in the COVID-19 period by Diagnosis Category Authors’ analysis of data from OptumLabs Data Warehouse Circle size indicates the proportion of total visits in the COVID-19 period by clinician specialty (see Appendix Exhibit 1 for full list). r=0.46 for correlation between the two measures. Abbreviations: Infections (Inf); Disorder (Dis)

References

    1. Jeffery MM, D’Onofrio G, Paek H, et al. Trends in emergency department visits and hospital admissions in health care systems in 5 states in the first months of the COVID-19 pandemic in the US. JAMA Intern Med. Published August 03, 2020. doi:10.1001/jamainternmed.2020.3288 - DOI - PMC - PubMed
    1. Kansagra AP, Goyal MS, Hamilton S, Albers GW. Collateral effect of Covid-19 on stroke evaluation in the United States. N Engl J Med. 2020;383(4):400–401. doi:10.1056/NEJMc2014816 - DOI - PMC - PubMed
    1. Vaduganathan M, van Meijgaard J, Mehra MR, Joseph J, O’Donnell CJ, Warraich HJ. Prescription fill patterns for commonly used drugs during the COVID-19 pandemic in the United States. JAMA. 2020;323(24):2524–2526. doi:10.1001/jama.2020.9184 - DOI - PMC - PubMed
    1. Baum A, Schwartz MD. Admissions to Veterans Affairs hospitals for emergency conditions during the COVID-19 pandemic. JAMA. 2020;324(1):96–99. doi:10.1001/jama.2020.9972 - DOI - PMC - PubMed
    1. Mehrotra A, Chernew M, Linetsky D, Hatch H, Cutler D. The impact of the COVID-19 pandemic on outpatient visits: practices are adapting to the new normal. Commonwealth Fund. Published June 25, 2020. Accessed July 15, 2020. doi: 10.26099/2v5t-9y63. - DOI

Publication types

LinkOut - more resources