. 2021 Jan 1;7(1):eaba7282.
doi: 10.1126/sciadv.aba7282. Print 2021 Jan.

Ocean forcing drives glacier retreat in Greenland

Affiliations

Ocean forcing drives glacier retreat in Greenland

Michael Wood et al. Sci Adv. .

Abstract

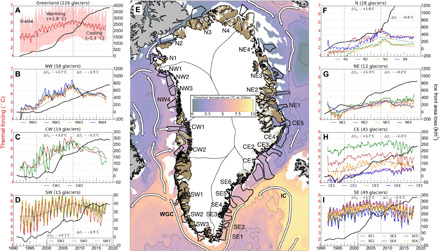
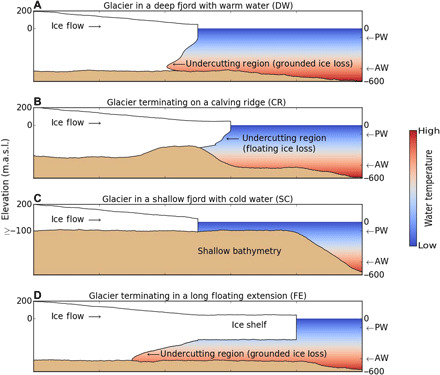
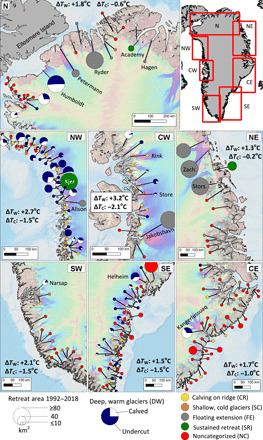
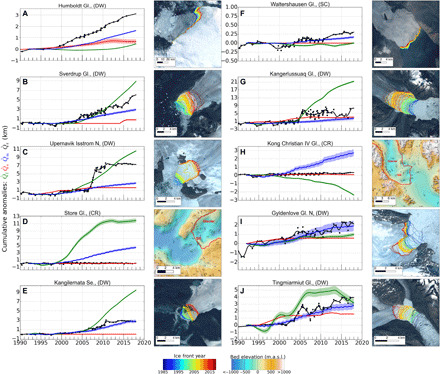
The retreat and acceleration of Greenland glaciers since the mid-1990s have been attributed to the enhanced intrusion of warm Atlantic Waters (AW) into fjords, but this assertion has not been quantitatively tested on a Greenland-wide basis or included in models. Here, we investigate how AW influenced retreat at 226 marine-terminating glaciers using ocean modeling, remote sensing, and in situ observations. We identify 74 glaciers in deep fjords with AW controlling 49% of the mass loss that retreated when warming increased undercutting by 48%. Conversely, 27 glaciers calving on shallow ridges and 24 in cold, shallow waters retreated little, contributing 15% of the loss, while 10 glaciers retreated substantially following the collapse of several ice shelves. The retreat mechanisms remain undiagnosed at 87 glaciers without ocean and bathymetry data, which controlled 19% of the loss. Ice sheet projections that exclude ocean-induced undercutting may underestimate mass loss by at least a factor of 2.


Figures

Fig. 1
Fig. 1. Regional comparison of ocean TF and glacier retreat during 1992–2017.
The reconstruction of ocean TF (°C)—the depth-averaged difference between the in situ water temperature and the salt- and pressure-dependent freezing point of seawater—and cumulative glacier retreat (Q^r, square kilometer) is shown for (A) all 226 marine-terminating glaciers (red; ±1σ of all regions), respectively, (B) northwest (NW), (C) central west (CW), (D) southwest (SW), (F) north (N), (G) northeast (NE), (H) central east (CE), and (I) southeast (SE) Greenland. Linear regressions in TF through stable, warming, and cooling periods are identified as three thin black lines. (E) Sample areas (thick black, numbered by region) used to evaluate TF in seven regions, with major ocean currents (white), overlaid on a reconstruction of potential temperature at 257-m depth from the MITgcm ocean model for November 2005 (3). IC, irminger current; WGC, west greenland current.
Fig. 2
Fig. 2. Schematic diagrams for four major categories of marine-terminating glaciers, with cold, fresh polar water (PW) on top of warm, salty AW.
(A) Glaciers in deep fjords with warm AW (DW) that undercuts the glacier face to affect basal resistance. (B) Glaciers with temporary floating extensions on a shallow ridge (SC), for which undercutting does not affect basal resistance. (C) Glaciers standing in shallow, cold waters (SC). (D) Glaciers develop long (>10 km) floating ice extensions (FE). Note that glacier and bed elevations, expressed in meters above sea level (m.a.s.l.), are approximations provided for illustration.
Fig. 3
Fig. 3. Spatial distribution of glacier retreat and categorization.
Greenland glaciers (226) are classified by bathymetry and water properties as deep and warm (DW; blue/white circle), calving on a ridge (CR; yellow circle), shallow and cold (SC; brown circle), terminating in a FE (gray circle); and by those with sustained retreat (SR; green circle) or NC (red circle). Circles are proportional to the grounded ice loss in square kilometer for 1992–2017, with blue for undercutting versus other ablation processes on DW glaciers. ΔTW and ΔTC are net changes in ocean TF during the 1998–2007 and 2008–2017 periods, respectively. Background ice velocity map is from (35), and bathymetry is from (19).
Fig. 4
Fig. 4. Summary of cumulative anomalies at the glacier terminus for ten examples.
(A to J) Example glaciers for the seven regions showing time series of observed ice front retreat, Q^r (black), retreat induced by surface thinning, Q^s (red), and cumulative anomalies in undercutting by the ocean Q^m (blue) and in ice advection, Q^f (green), for 1992–2017. Second and fourth columns show the ice front location color coded from 1992–2017 overlaid on Landsat 8 imagery or bed elevation. Note that the vertical axis is scaled differently for each example.

References

    1. Mouginot J., Rignot E., Bjørk A. A., van den Broeke M., Millan R., Morlighem M., Noël B., Scheuchl B., Wood M., Forty-six years of Greenland Ice Sheet mass balance from 1972 to 2018. Proc. Natl. Acad. Sci. U.S.A. 116, 9239–9244 (2019). - PMC - PubMed
    1. Holland D. M., Thomas R. H., de Young B., Ribergaard M. H., Lyberth B., Acceleration of Jakobshavn Isbræ triggered by warm subsurface ocean waters. Nat. Geosci. 1, 659–664 (2008).
    1. Rignot E., Fenty I., Menemenlis D., Xu Y., Spreading of warm ocean waters around Greenland as a possible cause for glacier acceleration. Ann. Glaciol. 53, 257–266 (2012).
    1. Seale A., Christoffersen P., Mugford R. I., O’Leary M., Ocean forcing of the Greenland Ice Sheet: Calving fronts and patterns of retreat identified by automatic satellite monitoring of eastern outlet glaciers. J. Geophys. Res. Earth Surf. 116, F03013 (2011).
    1. Wood M., Rignot E., Fenty I., Menemenlis D., Millan R., Morlighem M., Mouginot J., Seroussi H., Ocean-induced melt triggers glacier retreat in northwest Greenland. Geophys. Res. Lett. 45, 8334–8342 (2018).