. 2021 Jan 1;7(1):eabc2100.
doi: 10.1126/sciadv.abc2100. Print 2021 Jan.

Synthetic lethality across normal tissues is strongly associated with cancer risk, onset, and tumor suppressor specificity

Affiliations

Synthetic lethality across normal tissues is strongly associated with cancer risk, onset, and tumor suppressor specificity

Kuoyuan Cheng et al. Sci Adv. .

Abstract

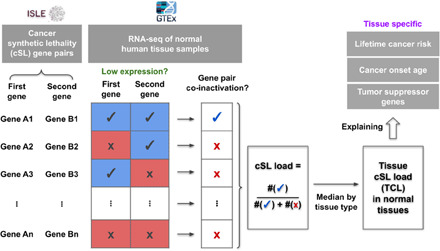
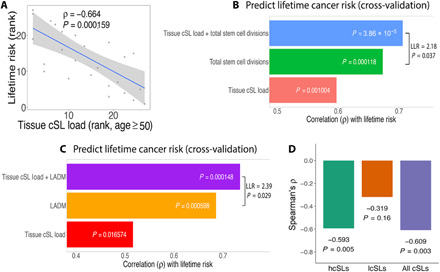
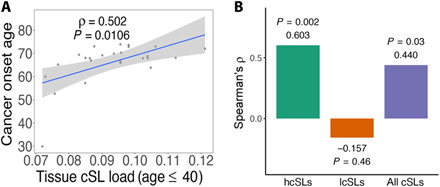
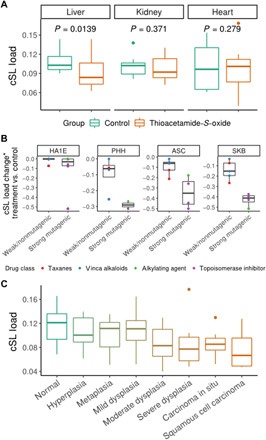
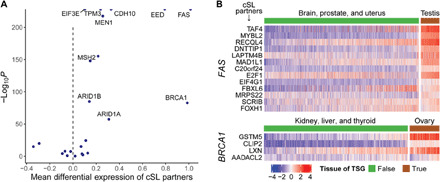
Various characteristics of cancers exhibit tissue specificity, including lifetime cancer risk, onset age, and cancer driver genes. Previously, the large variation in cancer risk across human tissues was found to strongly correlate with the number of stem cell divisions and abnormal DNA methylation levels. Here, we study the role of synthetic lethality in cancer risk. Analyzing normal tissue transcriptomics data in the Genotype-Tissue Expression project, we quantify the extent of co-inactivation of cancer synthetic lethal (cSL) gene pairs and find that normal tissues with more down-regulated cSL gene pairs have lower and delayed cancer risk. Consistently, more cSL gene pairs become up-regulated in cells treated by carcinogens and throughout premalignant stages in vivo. We also show that the tissue specificity of numerous tumor suppressor genes is associated with the expression of their cSL partner genes across normal tissues. Overall, our findings support the possible role of synthetic lethality in tumorigenesis.


Figures

Fig. 1
Fig. 1. A schematic diagram providing an overview of this study.
This diagram illustrates the computation of cSL load for each sample and each tissue type (i.e., TCL) and depicts the outline of this study, where we attempted to explain the tissue-specific lifetime cancer risk, cancer onset age, and TSGs using TCL. See main text and Methods for details.
Fig. 2
Fig. 2. TCL can explain the variance in lifetime cancer risk across human tissues.
(A) Scatterplot showing Spearman’s correlations between lifetime cancer risk and TCL computed for the older population (age ≥50 years) (ranked values are used as lifetime cancer risk spans several orders of magnitude.) (B) Lifetime cancer risks across tissues were predicted using linear models (under cross-validation) containing different sets of explanatory variables: (i) TCL only, (ii) the number of stem cell divisions (NCSD) only, and (iii) TCL and NSCD (27 data points). The prediction accuracy is measured by Spearman’s ρ, shown by the bar plots. The result of a likelihood ratio test between models (ii) and (iii) is also displayed. (C) A similar bar plot as in (B) comparing the predictive models for cancer risk involving the following variables: (i) TCL only, (ii) the LADM only, and (iii) TCL and LADM combined (21 data points only due to the smaller set of LADM data). A model containing all the three variables does not increase the prediction power (Spearman’s ρ = 0.77 under cross-validation) and is not shown. (D) Bar plot showing the correlations between lifetime cancer risk with TCLs computed (age ≥50 years) using subsets of cSLs: hcSLs, lcSLs, and all cSLs. Spearman’s ρ and P values are shown. The hcSLs and lcSLs are identified using data of matched TCGA cancer types and GTEx normal tissues (Methods), which correspond to only a subset of tissue types. To facilitate comparison, here, the correlation for all cSLs was also computed for the same subset of tissues, and therefore, the resulting correlation coefficient is different from that in (A).
Fig. 3
Fig. 3. TCL can explain the variance in cancer onset age across human tissues.
(A) Scatterplot showing Spearman’s correlations between cancer onset age and TCL (age ≤40 years). (B) Bar plot showing the correlations between cancer onset age with TCLs computed (age ≤40 years) using subsets of cSLs: hcSLs, lcSL, and all cSLs. Spearman’s ρ and P values are shown. As in Fig. 2D, this analysis was done for a subset of GTEx normal tissues for which we had matched TCGA cancer types to identify the hcSLs and lcSLs (Methods); therefore, the correlation result for all cSLs is also different from that in (A).
Fig. 4
Fig. 4. Experimental and clinical evidence further supports that cSL load may play a functional role in cancer development.
(A) Box plots showing the cSL loads in control versus thioacetamide-S-oxide–treated samples in human primary hepatocytes (“liver”), renal tube epithelial cells (“kidney”), and cardiomyocytes (“heart”), using the data from (25). One-sided Wilcoxon rank-sum test P values are shown. (B) Box plots showing the cSL load changes after treatment by different classes of chemotherapy drugs in four cell types, using the CMAP data (26). Asterisk indicates that the cSL load change is estimated indirectly from the CMAP drug treatment gene expression signatures (Methods). Strongly mutagenic drugs (n = 6), including alkylating agents (green points) and DNA topoisomerase inhibitors (purple points), lead to a significantly larger cSL load decrease compared to weak or nonmutagenic drugs (n = 5), including taxanes (red points) and vinca alkaloids (blue points); P = 0.03 from a linear model controlling for cell type. HA1E is an immortalized kidney cell line; PHH, primary human hepatocyte; ASC, adipose-derived stem cell; SKB, human skeletal myoblast. (C) Box plots showing the cSL load in samples of different stages of premalignant lesions in the lung (including normal tissue and lung squamous cell carcinoma) (28). The cSL load shows an overall decreasing trend from normal to different pre-cancer stages to cancer (one-sided Wilcoxon rank sum test of normal versus cancer P = 4.47 × 10⁻⁵; ordinal logistic regression has negative coefficient −28.7, P = 5.89 × 10⁻⁷).
Fig. 5
Fig. 5. The expression levels of the cSL partner genes of TSGs can explain their tissue specificity.
(A) For each tissue-specific TSG gene Gi, the expression levels of its cSL partner genes in the tissue type(s) where gene Gi is a TSG were compared to those where gene Gi is not an established TSG, using GTEx normal tissue expression data. The volcano plot summarizes the result of comparison with linear models. Positive linear model coefficients (x axis) mean that the expression levels of the cSL partner genes are, on average, higher in the tissue(s) where gene Gi is a TSG. Many cases have near-zero P values and are represented by points (half-dots) on the top border line of the plot. Overall, there is a dominant effect of the cSL partner genes of TSGs having higher expression levels in the tissues where the TSGs are known drivers (binomial test P = 0.023). All TSGs with FDR < 0.05 that also passed the random control tests are labeled. (B) Examples of two well-known TSGs, FAS and BRCA1, are given. The heatmaps display the normalized expression levels of their cSL partner genes (rows) in tissues of where these two genes are known to be TSGs [according to the annotation from the COSMIC database (11)] and in tissues where they are not established TSGs (columns), respectively. High and low expressions are represented by red and blue, respectively. For clarity, one typical tissue type where the TSG is a known driver (e.g., testis for FAS) and three other tissue types where the TSG is not an established driver (and the least frequently mutated) are shown.

References

    1. Surveillance, Epidemiology, and End Results (SEER) Program, “SEER*Stat Database Incidence - SEER 9 Regs Research Data, Nov 2017 Sub (1973–2015) - Linked To County Attributes - Total U.S., 1969–2016 Counties,” National Cancer Institute, DCCPS, Surveillance Research Program, released April 2018, based on the November 2017 submission (2018); www.seer.cancer.gov.
    1. Tomasetti C., Vogelstein B., Variation in cancer risk among tissues can be explained by the number of stem cell divisions. Science 347, 78–81 (2015). - PMC - PubMed
    1. Tomasetti C., Li L., Vogelstein B., Stem cell divisions, somatic mutations, cancer etiology, and cancer prevention. Science 355, 1330–1334 (2017). - PMC - PubMed
    1. Wu S., Powers S., Zhu W., Hannun Y. A., Substantial contribution of extrinsic risk factors to cancer development. Nature 529, 43–47 (2015). - PMC - PubMed
    1. Feinberg A. P., Ohlsson R., Henikoff S., The epigenetic progenitor origin of human cancer. Nat. Rev. Genet. 7, 21–33 (2006). - PubMed

Publication types

LinkOut - more resources