. 2021 Jan 1;7(1):eabd6889.
doi: 10.1126/sciadv.abd6889. Print 2021 Jan.

BBB pathophysiology-independent delivery of siRNA in traumatic brain injury

Affiliations

BBB pathophysiology-independent delivery of siRNA in traumatic brain injury

Wen Li et al. Sci Adv. .

Abstract

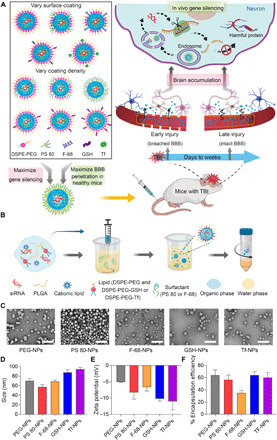
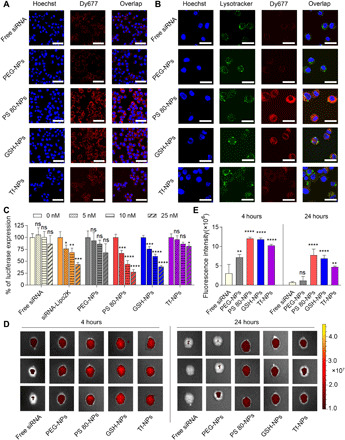
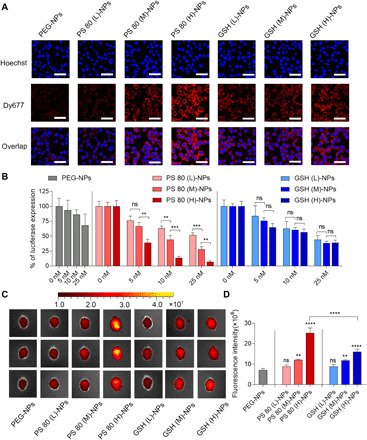
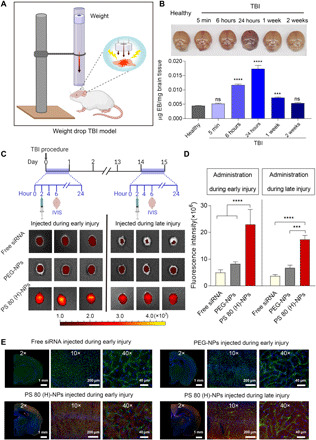
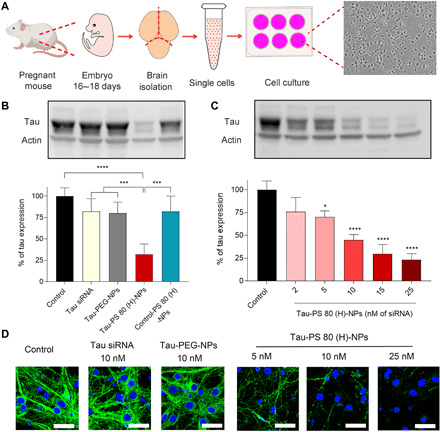
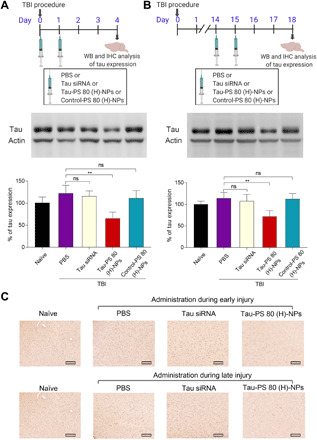
Small interfering RNA (siRNA)-based therapeutics can mitigate the long-term sequelae of traumatic brain injury (TBI) but suffer from poor permeability across the blood-brain barrier (BBB). One approach to overcoming this challenge involves treatment administration while BBB is transiently breached after injury. However, it offers a limited window for therapeutic intervention and is applicable to only a subset of injuries with substantially breached BBB. We report a nanoparticle platform for BBB pathophysiology-independent delivery of siRNA in TBI. We achieved this by combined modulation of surface chemistry and coating density on nanoparticles, which maximized their active transport across BBB. Engineered nanoparticles injected within or outside the window of breached BBB in TBI mice showed threefold higher brain accumulation compared to nonengineered PEGylated nanoparticles and 50% gene silencing. Together, our data suggest that this nanoparticle platform is a promising next-generation drug delivery approach for the treatment of TBI.


Figures

Fig. 1
Fig. 1. NPs with different surface coatings were prepared to achieve BBB pathophysiology–independent delivery of siRNA in TBI.
(A) Schematic illustrating the overall study design. siRNA-loaded NPs with different surface coating chemistries and coating densities were compared for their in vitro uptake and gene silencing efficiency in neural cells as well as their ability to cross intact BBB in healthy mice. NPs with maximum gene silencing efficiency and BBB permeability were then evaluated in TBI mice to determine brain accumulation and gene silencing efficiency when administered during early injury or late injury periods, corresponding to physically breached BBB and intact BBB, respectively. Upon neuronal uptake of NPs, siRNA is released and silences the harmful proteins involved in TBI pathophysiology. (B) Schematic for the preparation of siRNA-loaded PLGA NPs by a modified nanoprecipitation method. DSPE-PEG was used to impart stealth character. In addition, polysorbate 80 (PS 80), poloxamer 188 (F-68), DSPE-PEG-glutathione (GSH), or DSPE-PEG-transferrin (Tf) was used to augment BBB penetration. PEG, polyethylene glycol; DSPE, 1,2-distearoyl-sn-glycero-3-phosphoethanolamine. (C) Transmission electron microscopy images of siRNA-loaded NPs having different surface coatings. Scale bars, 200 nm. (D and E) Size and zeta potential of siRNA-loaded NPs having different surface coatings, as analyzed by dynamic light scattering. (F) Encapsulation efficiency of siRNA in different NPs. Data in (D) to (F) are means ± SD of technical repeats (n = 3, experiment performed at least twice). The illustrations (A and B) were created with the help of BioRender.com.
Fig. 2
Fig. 2. Surface coating affects the uptake of NPs by neural cells, gene silencing efficiency in vitro, and penetration of NPs across intact BBB.
(A) CLSM images of Neuro-2a cells incubated with free siRNA or siRNA-loaded NPs having different surface coatings (PEG-NPs, PS 80-NPs, GSH-NPs, or Tf-NPs) at 37°C for 2 hours. Dy677-labeled scrambled siRNA (red signal) was used. Nuclei were stained with Hoechst 33342 (blue signal). Scale bars, 50 μm. (B) CLSM images showing endosomal escape of siRNA in Neuro-2a cells. Cells were incubated with free siRNA or siRNA-loaded NPs at 37°C for 2 hours. Dy677-labeled siRNA (red signal) was used. Nuclei were stained by Hoechst 33342 (blue signal) and endosomes were stained with LysoTracker Green (green signal). Scale bars, 30 μm. (C) Luciferase expression in Neuro-2a cells. Luciferase-expressing Neuro-2a cells were incubated for 24 hours with medium containing different concentrations of free luciferase siRNA (free siRNA), luciferase siRNA–Lipofectamine 2000 complex (siRNA-Lipo2K), or luciferase siRNA–loaded NPs. Following an additional 48-hour incubation with medium only, luciferase expression was quantified using luminescence assay. *P < 0.05, **P < 0.01, ***P < 0.001, ****P < 0.0001 compared to 0 nM siRNA. ns, not significant. (D) In vivo imaging system (IVIS) images of brains from three representative healthy mice, excised at 4 or 24 hours after intravenous injection of free siRNA or siRNA-loaded NPs (50 nmol siRNA/kg). Dy677-labeled scrambled siRNA was used. (E) Fluorescence intensity measured over excised mice brains using IVIS. **P < 0.01, ****P < 0.0001 compared to free siRNA. Data in (C) are means ± SD of technical repeats (n = 3, experiment performed at least twice). Data in (E) are means ± SD (n = 3 mice/group, experiment performed twice). P values were determined using one-way analysis of variance (ANOVA) with Tukey’s post hoc analysis.
Fig. 3
Fig. 3. Surface coating density affects the uptake of NPs by neural cells, gene silencing efficiency in vitro, and penetration of NPs across intact BBB.
(A) CLSM images of Neuro-2a cells incubated with siRNA-loaded NPs having different coating densities of PS 80 or GSH at 37°C for 2 hours. PEG-NPs were used as control. Dy677-labeled scrambled siRNA (red signal) was loaded into NPs. Nuclei were stained with Hoechst 33342 (blue signal). Scale bars, 50 μm. (B) Luciferase expression in Neuro-2a cells. Luciferase-expressing Neuro-2a cells were incubated for 24 hours with medium containing luciferase siRNA–loaded NPs having different coating densities of PS 80 or GSH at varying concentrations of siRNA. Following an additional 48-hour incubation with medium only, luciferase expression was quantified using a luminescence assay. PEG-NPs were used as control. **P < 0.01 and ***P < 0.001. (C) IVIS images of brains from three representative healthy mice, excised at 4 hours after intravenous injection of siRNA-loaded NPs (50 nmol siRNA/kg) having different coating densities of PS 80 or GSH. PEG-NPs were used as control. Dy677-labeled scrambled siRNA was loaded into NPs. (D) Fluorescence intensity measured over excised mice brains using IVIS. **P < 0.01 and ****P < 0.0001 compared to PEG-NPs. ****P < 0.0001 for PS 80 (H)-NPs versus GSH (H)-NPs. Data in (B) are means ± SD of technical repeats (n = 3, experiment performed at least twice). Data in (D) are means ± SD (n = 3 mice per group, experiment performed twice). P values were determined by one-way ANOVA with Tukey’s post hoc analysis.
Fig. 4
Fig. 4. PS 80 (H)-NPs exhibit BBB pathophysiology–independent delivery of siRNA in a mouse model of TBI.
(A) Schematic showing the experimental procedure for the weight drop–induced TBI model. (B) Time window of physically breached BBB following TBI was characterized by Evans blue (EB) penetration assay. EB was intravenously injected into healthy mice or mice with TBI at different time points after injury. Two hours after EB administration, brains were excised and photographed. EB content in brain tissue was also quantified and expressed as micrograms of EB per milligram of brain tissue. ***P < 0.001, ****P < 0.0001 compared to healthy mice. (C) Experimental outline: Free siRNA, siRNA-loaded PEG-NPs, or PS 80 (H)-NPs were intravenously injected into mice after 2 hours or 2 weeks of TBI procedure, corresponding to early and late injury, respectively. Four hours after the administration of siRNA formulations, brains were excised and imaged using IVIS. Dy677-labeled scrambled siRNA was used at a dose of 50 nmol/kg. IVIS images of brains from three representative healthy mice injected during early or late injury are shown. (D) Fluorescence intensity measured over excised mice brains using IVIS. ***P < 0.001, ****P < 0.0001. (E) Representative fluorescence microscopy images of brain sections from mice injected intravenously with free siRNA, siRNA-loaded PEG-NPs, or PS 80 (H)-NPs during early or late injury. Dy677-labeled scrambled siRNA (red signal) was used. Nuclei were stained with Hoechst 33342 (blue signal), and blood vessels were labeled with fluorescein isothiocyanate lectin (green signal). Data in (B) and (D) are means ± SD (n = 3 mice per group, experiment performed twice). P values were determined by one-way ANOVA with Tukey’s post hoc analysis.
Fig. 5
Fig. 5. Tau siRNA–loaded PS 80 (H)-NPs suppress tau expression in murine primary neuronal cells.
(A) Schematic illustration depicting the isolation of primary neuronal cells from mouse embryos and bright-field image of primary cells after 10 days in culture. Pregnant female C57BL/6 mice at E18 were euthanized, and the cortex was dissected from embryo brains and enzymatically digested to obtain single cell suspension. Last, cells were cultured on plates precoated with poly-l-lysine. (B) Western blots and quantification of tau expression in primary neuronal cells. Cells were incubated for 24 hours with only medium (control) or medium containing free tau siRNA (Tau siRNA), tau siRNA–loaded PEG NPs (Tau-PEG-NPs), tau siRNA–loaded PS 80 (H)-NPs [Tau-PS 80 (H)-NPs], or scrambled siRNA–loaded PS 80 (H)-NPs [Control-PS 80 (H)-NPs]. The dose of siRNA was 15 nM. Following an additional 48-hour incubation with medium only, Western blot analysis was performed. ***P < 0.001, ****P < 0.0001. (C) Western blot and quantification of tau expression in primary neuronal cells treated with tau siRNA–loaded PS 80 (H)-NPs at different concentrations of siRNA. *P < 0.05, ****P < 0.0001 compared to control. (D) Immunofluorescence images of tau expression in primary neuronal cells. Cells were treated for 24 hours with medium only (control) or medium containing free tau siRNA (10 nM siRNA), tau-PEG-NPs (10 nM siRNA), or tau-PS 80 (H)-NPs (5, 10, or 25 nM siRNA). Following an additional 48-hour incubation with medium only, immunofluorescence staining was performed. Nuclei were stained with Hoechst 33342 (blue signal), and tau was stained with the anti-tau primary antibody followed by Alexa Fluor 488–labeled secondary antibody (green signal). Scale bars, 30 μm. Data in (B) and (C) are means ± SD of technical repeats (n = 3, experiment performed twice). P values were determined by one-way ANOVA with Tukey’s post hoc analysis.
Fig. 6
Fig. 6. Tau siRNA–loaded PS 80 (H)-NPs silence tau expression in vivo during early and late injury.
(A) Experimental outline: To evaluate tau silencing efficiency during early injury, mice received tail vein injection with PBS, free tau siRNA (Tau siRNA), tau siRNA–loaded PS 80 (H)-NPs [Tau-PS 80 (H)-NPs], or scrambled siRNA–loaded PS 80 (H)-NPs [Control-PS 80 (H)-NPs] at 2 hours and 1 day after injury. siRNA dose was 75 nmol/kg per day. Brains were dissected to isolate cortex on day 4 for quantification of tau expression using Western blot. Representative Western blots and quantification of tau expression are shown. Naïve animals were healthy mice with no treatment. **P < 0.01. (B) Experimental outline: To evaluate tau silencing efficiency during late injury, mice received tail vein injection of PBS, tau siRNA, tau-PS 80 (H)-NPs, or control-PS 80 (H)-NPs at days 14 and 15 after injury. siRNA dose was 75 nmol/kg per day. Brains were harvested on day 18 for quantification of tau expression using Western blot. Representative Western blot analysis and quantification of tau expression were shown. **P < 0.01. (C) Immunohistochemical staining of tau expression in brain tissue sections of naïve mice (healthy mice with no treatment) or TBI mice treated with PBS, tau siRNA, or tau-PS 80 (H)-NPs. Treatments were performed during the early or late injury phase at a siRNA dose of 75 nmol/kg per day. Scale bars, 150 μm. Data in (A) and (B) are means ± SD (n = 3 mice per group, experiment performed twice). P values were determined by one-way ANOVA with Tukey’s post hoc analysis.

References

    1. Roozenbeek B., Maas A. I. R., Menon D. K., Changing patterns in the epidemiology of traumatic brain injury. Nat. Rev. Neurol. 9, 231–236 (2013). - PubMed
    1. Simon D. W., McGeachy M. J., Bayır H., Clark R. S. B., Loane D. J., Kochanek P. M., The far-reaching scope of neuroinflammation after traumatic brain injury. Nat. Rev. Neurol. 13, 171–191 (2017). - PMC - PubMed
    1. Meabon J. S., Huber B. R., Cross D. J., Richards T. L., Minoshima S., Pagulayan K. F., Li G., Meeker K. D., Kraemer B. C., Petrie E. C., Raskind M. A., Peskind E. R., Cook D. G., Repetitive blast exposure in mice and combat veterans causes persistent cerebellar dysfunction. Sci. Transl. Med. 8, 321ra6 (2016). - PubMed
    1. Goldstein L. E., Fisher A. M., Tagge C. A., Zhang X.-L., Velisek L., Sullivan J. A., Upreti C., Kracht J. M., Ericsson M., Wojnarowicz M. W., Goletiani C. J., Maglakelidze G. M., Casey N., Moncaster J. A., Minaeva O., Moir R. D., Nowinski C. J., Stern R. A., Cantu R. C., Geiling J., Blusztajn J. K., Wolozin B. L., Ikezu T., Stein T. D., Budson A. E., Kowall N. W., Chargin D., Sharon A., Saman S., Hall G. F., Moss W. C., Cleveland R. O., Tanzi R. E., Stanton P. K., McKee A. C., Chronic traumatic encephalopathy in blast-exposed military veterans and a blast neurotrauma mouse model. Sci. Transl. Med. 4, 134ra160 (2012). - PMC - PubMed
    1. McKee A. C., Stein D., Nowinski C. J., Stern R. A., Daneshvar D. H., Alvarez V. E., Lee H.-S., Hall G., Wojtowicz S. M., Baugh C. M., Riley D. O., Kubilus C. A., Cormier K. A., Jacobs M. A., Martin B. R., Abraham C. R., Ikezu T., Reichard R. R., Wolozin B. L., Budson A. E., Goldstein L. E., Kowall N. W., Cantu R. C., The spectrum of disease in chronic traumatic encephalopathy. Brain 136, 43–64 (2013). - PMC - PubMed

Publication types

Substances