. 2021 Jan 1;7(1):eabe4310.
doi: 10.1126/sciadv.abe4310. Print 2021 Jan.

Nanoscale chromatin imaging and analysis platform bridges 4D chromatin organization with molecular function

Affiliations

Nanoscale chromatin imaging and analysis platform bridges 4D chromatin organization with molecular function

Yue Li et al. Sci Adv. .

Abstract

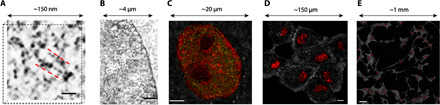
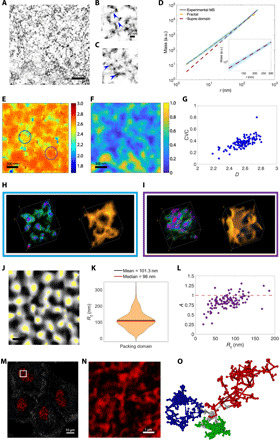
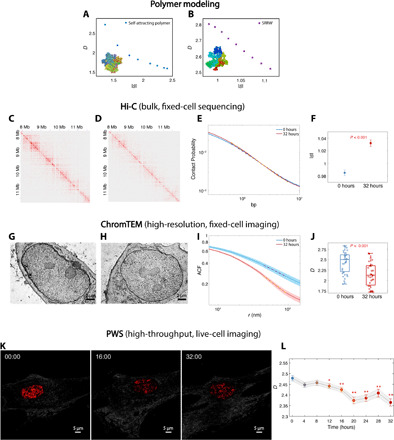
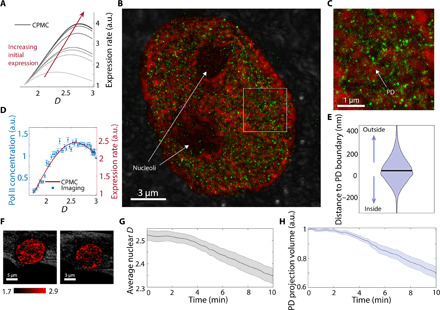
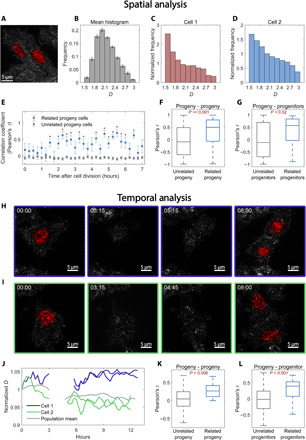
Extending across multiple length scales, dynamic chromatin structure is linked to transcription through the regulation of genome organization. However, no individual technique can fully elucidate this structure and its relation to molecular function at all length and time scales at both a single-cell level and a population level. Here, we present a multitechnique nanoscale chromatin imaging and analysis (nano-ChIA) platform that consolidates electron tomography of the primary chromatin fiber, optical super-resolution imaging of transcription processes, and label-free nano-sensing of chromatin packing and its dynamics in live cells. Using nano-ChIA, we observed that chromatin is localized into spatially separable packing domains, with an average diameter of around 200 nanometers, sub-megabase genomic size, and an internal fractal structure. The chromatin packing behavior of these domains exhibits a complex bidirectional relationship with active gene transcription. Furthermore, we found that properties of PDs are correlated among progenitor and progeny cells across cell division.


Figures

Fig. 1
Fig. 1. nano-ChIA platform.
(A) ChromSTEM HAADF tomography characterizes the 3D chromatin structure of an A549 cell (contrast inverted). The inverted image contrast is inversely proportional to the local DNA density: As the electrons encounter a higher density of DNA along their trajectory, the image contrast appears darker. Individual nucleosomes and linker DNA are resolved at 2-nm spatial resolution. Scale bar, 30 nm. (B) ChromTEM imaging of a BJ cell nucleus on a 50-nm resin section prepared by ChromEM staining. Similar to ChromSTEM, ChromTEM also maps the DNA distribution, but the image contrast follows Beer’s law. Scale bar, 1 μm. (C) Coregistered PWS and STORM imaging of chromatin packing scaling (D, red pseudocolor) and active RNA Polymerase-II (RNAP II) (green) of an M248 cell nucleus. Scale bar, 3 μm. (D and E) Label-free PWS images of live A549 cells of both one field of view where chromatin packing variations within nuclei are visible (D) (scale bar, 20 μm) and a 9 × 9, stitched together, image to demonstrate the ability of PWS to visualize chromatin packing structure of cell populations (E) (scale bar, 100 μm). The pseudocolor represents the chromatin packing scaling inside the cell nuclei.
Fig. 2
Fig. 2. nano-ChIA identifies fractal PDs.
(A) Virtual 2D slice from ChromSTEM HAADF tomography reconstruction of chromatin from an A549 cell nucleus (contrast inverted). (B and C) High-resolution tomography reveals fine chromatin structures such as (B) linker DNA and (C) individual nucleosomes. (D) Average chromatin mass scaling shows two power-law scaling regimes fit with linear regression in log-log scale: the fractal PD regime (r < 102.4 nm; yellow dashed line) and the nonfractal supra-domain regime (r > 102.4 nm; red dashed line). Inset: Magnification of (D) highlighting the supra-domain regime. (E and F) Corresponding mapping of (E) D and (F) CVC of an A549 cell. (G) Relationship between D and CVC. (H and I) Supranucleosomal packing configurations for two PDs with different Ds highlighted in (E) by (H) the blue circle and (I) the purple circle. In the leftmost rendering of each panel, the DNA concentration increases from green to red. The rightmost rendering shows the surface topology. (J) Segmentation of D mapping. Identified PDs are in white, and the center regions of PDs, as determined by the flooding algorithm, are in yellow. (K) Distribution of PD radii (Rf), defined as the upper bound of the fractal regime of the mass scaling (MS) curve. (L) Dependence of packing efficiency factor A on Rf. Red dashed line denotes A = 1, which represents optimal packing. (M and N) PWS D mapping of several cells with nuclei shown in red. (N) PWS D mapping corresponding to the inset in (M). Each red cluster represents a diffraction-limited observation of PDs. (O) Rendering of three spatially separable PDs (green, blue, and red) with distinct packing scaling behavior.
Fig. 3
Fig. 3. Relationship between s and D.
(A and B) A general inverse relationship between s and D is demonstrated using (A) self-attracting polymer and (B) SRRW simulations. (C and D) Hi-C contact maps for BJ cells treated with DXM treatment for (C) 0 hours and (D) 32 hours. (E) Intrachromosomal contact probability plotted against genomic distance in log-log scale. (F) s for BJ cells treated with DXM for 0 and 32 hours. The linear regression fit was performed on contact probability versus genomic distance between 105.8 and 106.8 bp. (G and H) ChromTEM images of BJ cells (G) without and (H) with DXM treatment for 32 hours. (I) The average ACF of chromatin mass density for untreated cells (blue) significantly differs from that of treated cells (red). D was measured inside the fractal PD (50 to 100 nm) by a linear regression fit of the ACF in log-log scale. (J) Using ChromTEM ACF analysis on fixed cells, an increase in D was observed after the 32-hour DXM treatment (N = 31 cells per condition; P < 0.001). (K and L) Live-cell PWS analysis of BJ cells treated with DXM. (K) PWS images of BJ cells with DXM treatment at 0-, 16-, and 32-hour time points. (L) Time course PWS measurements showed a significant decrease in D for all time points after 12 hours (N > 67 cells; *P < 0.05 and **P < 0.001) compared to the 0-hour time point.
Fig. 4
Fig. 4. nano-ChIA platform investigates the relationship between chromatin structure and transcription.
(A) Multiple realizations of the CPMC model with varying molecular conditions for low- and high-expression genes show that in all cases, the surrounding chromatin packing scaling has a nonmonotonic relationship with gene expression. (B) STORM image of an M248 ovarian cancer cell with labeled active RNAP II (green) overlaid on top of chromatin packing scaling D map measured by PWS (red). (C) A magnified view of the white square in (B). (D) The relationship between D (chromatin packing scaling) and the local concentration of active RNAP II (gene expression level) (N = 4 cells) compared with one realization of the CPMC model. (E) A violin plot shows the distribution of distances between enriched Pol II regions and their nearest PD. The plot shows that active RNAP II tends to distribute around the boundary of PDs (N = 4 cells). (F) PWS imaging of a live BJ fibroblast cell during Act-D treatment. The pseudocolor is coded by the D values inside the nuclei. (G) After transcriptional elongation is halted with Act-D, average nuclear chromatin packing scaling decreases steadily within minutes as measured by PWS (P < 0.001 comparing t = 0 and 10 min). (H) The change in the volume fraction of the nucleus containing PDs as measured by PWS (P < 0.001 comparing t = 0 and 10 min).
Fig. 5
Fig. 5. Time-resolved PWS imaging of HCT116 cells determines heritability of chromatin packing scaling for N = 10 progenitor cells and N = 20 progeny cells.
(A) PWS D map of two progeny cells originating from the same progenitor. (B) Average spatial D distribution of all cells imaged 5 hours after cell division. (C and D) Histogram ratio of the spatial D distribution for each individual progeny cell [from (A)] normalized by the average histogram of all cells at that time point [from (B)]. (E) After cell division, the normalized histograms of paired progeny cells are more highly correlated with each other than with unrelated progeny cells at the same time point (*P < 0.05). (F) Across all time points, normalized histograms of paired progeny cells are more significantly correlated compared to those of unrelated progeny. (G) Comparing all progeny cells 3 hours after division to all progenitors 3 hours before division shows that progeny cells have a higher correlation with their “parent” than with unrelated progenitors (P = 0.021). (H and I) PWS D maps at four time points before, during, and after cell division. During cell division, nuclei exit the objective’s depth of field by lifting off the glass and return to the glass when they have finished dividing. (J) Average nuclear D tracked over time [from cells in (H) and (I)]. After ~5 hours, both cells have finished dividing, and their progeny cells were tracked for an additional ~7 hours. (K) D of progeny cells is more strongly correlated with that of their paired progeny than with other unrelated cells (P < 0.001). (L) Progeny cells are more correlated with their parent progenitor cells than with other unrelated cells.

References

    1. Phillips-Cremins J. E., Sauria M. E. G., Sanyal A., Gerasimova T. I., Lajoie B. R., Bell J. S. K., Ong C.-T., Hookway T. A., Guo C., Sun Y., Bland M. J., Wagstaff W., Dalton S., McDevitt T. C., Sen R., Dekker J., Taylor J., Corces V. G., Architectural protein subclasses shape 3D organization of genomes during lineage commitment. Cell 153, 1281–1295 (2013). - PMC - PubMed
    1. Clowney E. J., LeGros M. A., Mosley C. P., Clowney F. G., Markenskoff-Papadimitriou E. C., Myllys M., Barnea G., Larabell C. A., Lomvardas S., Nuclear aggregation of olfactory receptor genes governs their monogenic expression. Cell 151, 724–737 (2012). - PMC - PubMed
    1. Becker J. S., McCarthy R. L., Sidoli S., Donahue G., Kaeding K. E., He Z., Lin S., Garcia B. A., Zaret K. S., Genomic and proteomic resolution of heterochromatin and its restriction of alternate fate genes. Mol. Cell 68, 1023–1037.e15 (2017). - PMC - PubMed
    1. Taberlay P. C., Achinger-Kawecka J., Lun A. T. L., Buske F. A., Sabir K., Gould C. M., Zotenko E., Bert S. A., Giles K. A., Bauer D. C., Smyth G. K., Stirzaker C., O’Donoghue S. I., Clark S. J., Three-dimensional disorganization of the cancer genome occurs coincident with long-range genetic and epigenetic alterations. Genome Res. 26, 719–731 (2016). - PMC - PubMed
    1. Panikker P., Xu S.-J., Zhang H., Sarthi J., Beaver M., Sheth A., Akhter S., Elefant F., Restoring Tip60 HAT/HDAC2 balance in the neurodegenerative brain relieves epigenetic transcriptional repression and reinstates cognition. J. Neurosci. 38, 4569–4583 (2018). - PMC - PubMed

Publication types

LinkOut - more resources