

Structures of Rhodopseudomonas palustris RC-LH1 complexes with open or closed quinone channels
- PMID: 33523887
- PMCID: PMC7806223
- DOI: 10.1126/sciadv.abe2631
Structures of Rhodopseudomonas palustris RC-LH1 complexes with open or closed quinone channels
Abstract
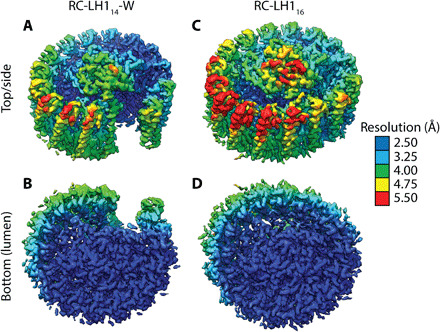
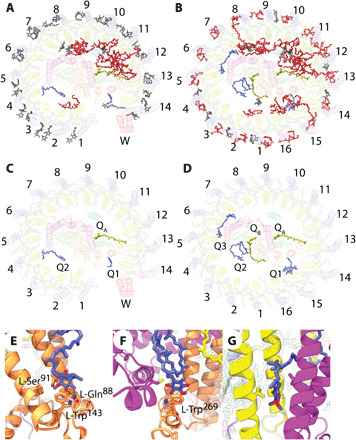
The reaction-center light-harvesting complex 1 (RC-LH1) is the core photosynthetic component in purple phototrophic bacteria. We present two cryo-electron microscopy structures of RC-LH1 complexes from Rhodopseudomonas palustris A 2.65-Å resolution structure of the RC-LH114-W complex consists of an open 14-subunit LH1 ring surrounding the RC interrupted by protein-W, whereas the complex without protein-W at 2.80-Å resolution comprises an RC completely encircled by a closed, 16-subunit LH1 ring. Comparison of these structures provides insights into quinone dynamics within RC-LH1 complexes, including a previously unidentified conformational change upon quinone binding at the RC QB site, and the locations of accessory quinone binding sites that aid their delivery to the RC. The structurally unique protein-W prevents LH1 ring closure, creating a channel for accelerated quinone/quinol exchange.
Copyright © 2021 The Authors, some rights reserved; exclusive licensee American Association for the Advancement of Science. No claim to original U.S. Government Works. Distributed under a Creative Commons Attribution License 4.0 (CC BY).
Figures


Similar articles
-
Cryo-EM structure of the monomeric Rhodobacter sphaeroides RC-LH1 core complex at 2.5 Å.Biochem J. 2021 Oct 29;478(20):3775-3790. doi: 10.1042/BCJ20210631. Biochem J. 2021. PMID: 34590677 Free PMC article.
-
Identification of protein W, the elusive sixth subunit of the Rhodopseudomonas palustris reaction center-light harvesting 1 core complex.Biochim Biophys Acta Bioenerg. 2018 Feb;1859(2):119-128. doi: 10.1016/j.bbabio.2017.11.001. Epub 2017 Nov 7. Biochim Biophys Acta Bioenerg. 2018. PMID: 29126780 Free PMC article.
-
Structural basis for the assembly and quinone transport mechanisms of the dimeric photosynthetic RC-LH1 supercomplex.Nat Commun. 2022 Apr 13;13(1):1977. doi: 10.1038/s41467-022-29563-3. Nat Commun. 2022. PMID: 35418573 Free PMC article.
-
A comparative look at structural variation among RC-LH1 'Core' complexes present in anoxygenic phototrophic bacteria.Photosynth Res. 2020 Aug;145(2):83-96. doi: 10.1007/s11120-020-00758-3. Epub 2020 May 19. Photosynth Res. 2020. PMID: 32430765 Free PMC article. Review.
-
Novel features of LH1-RC from Thermochromatium tepidum revealed from its atomic resolution structure.FEBS J. 2018 Dec;285(23):4359-4366. doi: 10.1111/febs.14679. Epub 2018 Oct 30. FEBS J. 2018. PMID: 30328658 Review.
Cited by
-
Role of hydrogen-bond networks on the donor side of photosynthetic reaction centers from purple bacteria.Biophys Rev. 2023 Aug 18;15(5):921-937. doi: 10.1007/s12551-023-01109-x. eCollection 2023 Oct. Biophys Rev. 2023. PMID: 37974998 Free PMC article. Review.
-
Cryo-EM structure of the monomeric Rhodobacter sphaeroides RC-LH1 core complex at 2.5 Å.Biochem J. 2021 Oct 29;478(20):3775-3790. doi: 10.1042/BCJ20210631. Biochem J. 2021. PMID: 34590677 Free PMC article.
-
Single-Molecule Detection of the Encounter and Productive Electron Transfer Complexes of a Photosynthetic Reaction Center.J Am Chem Soc. 2024 Jul 24;146(29):20019-20032. doi: 10.1021/jacs.4c03913. Epub 2024 Jul 11. J Am Chem Soc. 2024. PMID: 38991108 Free PMC article.
-
The structure and assembly of reaction centre-light-harvesting 1 complexes in photosynthetic bacteria.Biosci Rep. 2023 May 31;43(5):BSR20220089. doi: 10.1042/BSR20220089. Biosci Rep. 2023. PMID: 37098760 Free PMC article.
-
A distinct double-ring LH1-LH2 photocomplex from an extremophilic phototroph.Nat Commun. 2025 Feb 6;16(1):1410. doi: 10.1038/s41467-024-55811-9. Nat Commun. 2025. PMID: 39915441 Free PMC article.
References
-
- S. Romagnoli, R. F. Tabita, Carbon dioxide metabolism and its regulation in nonsulfur purple photosynthetic bacteria, in The Purple Phototrophic Bacteria, C. N. Hunter, F. Daldal, M. C. Thurnauer, J. T. Beatty, Eds. (Springer Netherlands, 2009), pp. 563–576.
-
- B. Masepohl, R. G. Kranz, Regulation of nitrogen fixation, in The Purple Phototrophic Bacteria, C. N. Hunter, F. Daldal, M. C. Thurnauer, J. T. Beatty, Eds. (Springer, 2009), pp. 759–775.
Publication types
Grants and funding
LinkOut - more resources
Full Text Sources
Other Literature Sources
