. 2021 Jan 15;7(3):eabc4897.
doi: 10.1126/sciadv.abc4897. Print 2021 Jan.

Multiple screening approaches reveal HDAC6 as a novel regulator of glycolytic metabolism in triple-negative breast cancer

Affiliations

Multiple screening approaches reveal HDAC6 as a novel regulator of glycolytic metabolism in triple-negative breast cancer

Catríona M Dowling et al. Sci Adv. .

Abstract

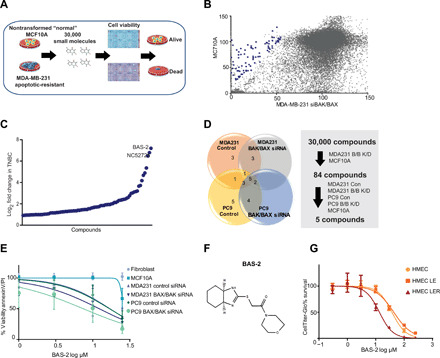
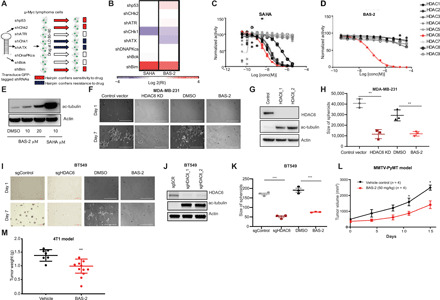
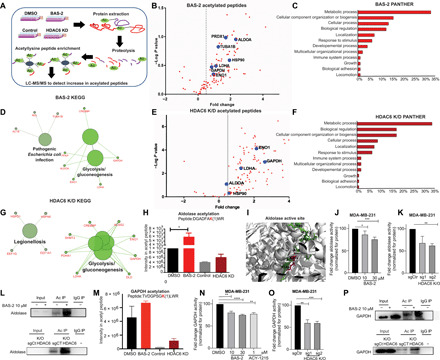
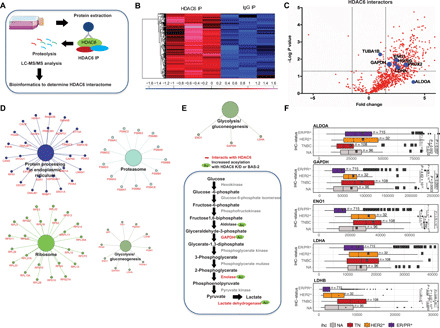
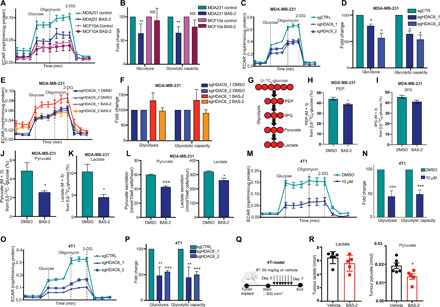
Triple-negative breast cancer (TNBC) is a subtype of breast cancer without a targeted form of therapy. Unfortunately, up to 70% of patients with TNBC develop resistance to treatment. A known contributor to chemoresistance is dysfunctional mitochondrial apoptosis signaling. We set up a phenotypic small-molecule screen to reveal vulnerabilities in TNBC cells that were independent of mitochondrial apoptosis. Using a functional genetic approach, we identified that a "hit" compound, BAS-2, had a potentially similar mechanism of action to histone deacetylase inhibitors (HDAC). An in vitro HDAC inhibitor assay confirmed that the compound selectively inhibited HDAC6. Using state-of-the-art acetylome mass spectrometry, we identified glycolytic substrates of HDAC6 in TNBC cells. We confirmed that inhibition or knockout of HDAC6 reduced glycolytic metabolism both in vitro and in vivo. Through a series of unbiased screening approaches, we have identified a previously unidentified role for HDAC6 in regulating glycolytic metabolism.


Figures

Fig. 1
Fig. 1. Identification of a compound that kills cancer cells independent of BAX/BAK.
(A) Schematic of the phenotypical screen. MDA231 cells were transfected with two siRNAs against BAX and BAK proteins. The MDA231 and MCF10a were treated with 30,000 small molecules in duplicate from diverse libraries. (B) Cell viability of the MCF10a and MDA231 (BAX/BAK siRNA) cells for each of the 30,000 compounds test. Blue dots indicate the compounds that were cherry picked for a secondary screen. (C) The fold change in response of the MDA231 cells to cherry-picked compounds compared with MCF10a cells. (D) Pie chart represents the number of compounds that showed a response in the indicated cells. (E) Cell survival of the indicated cell lines following a 48-hour treatment with BAS-2 (n = 3, mean ± SEM). (F) Chemical structure of the lead compound, BAS-2. (G) Cell survival of the indicated cell lines following a 48-hour treatment with BAS-2 (n = 3, mean ± SEM).
Fig. 2
Fig. 2. Functional genetic approach to establish the target of BAS-2.
(A) Schematic of the GFP-based competition assays. LD, lethal dose. (B) Heatmap showing the response of cells expressing the indicated shRNAs to SAHA and BAS-2. (C and D) Inhibition of trifluoroacetyllysine substrate processing by suberoylanilide hydroxamic acid (SAHA) (C) and BAS-2 (D) (mean of triplicate measurements). (E) Western blot for acetylated tubulin following indicated treatments with BAS-2 and SAHA. (F) Images of MDA231 cells grown in Matrigel for 7 days with HDAC6 KD or following treatment with 30 μM BAS-2. (G) Western blot of HDAC6 and acetylated tubulin levels in control and HDAC6 KD cells. (H) Dot plots show the size of colonies in all treatment groups (n = 3, mean ± SEM). (I) Images of BT-549 cells grown as described in (F). (J) Western blot of HDAC6 and acetylated tubulin levels in control or HDAC6 KO cells. (K) Dot plots show the size of colonies in all treatment groups (n = 3, mean ± SEM). (L) MMTv-PyMT tumors were measured and plotted as average total tumor burden following randomization to vehicle [dimethyl sulfoxide (DMSO)] or BAS-2 (50 mg/kg; n = 4, mean ± SEM). (M) BALB/cJ mice were subcutaneously inoculated with 4T1 cells and treated with BAS-2 (50 mg/kg) for 14 days, and tumor weight was plotted (n = 10, mean ± SEM). **P < 0.01 and ***P < 0.001.
Fig. 3
Fig. 3. Quantitative proteomics of the BAS-2 acetylome and HDAC6 KD converges on the glycolytic pathway.
(A) Proteomics workflow. (B) Volcano plot showing enhanced acetylated peptides following BAS-2 treatment (30 μM) for 48 hours. (C) Bar graph of biological pathways with increased acetylated peptides, as assessed by Panther (C) and as assessed by KEGG pathway (D). (E to G) The same as (B) to (D) but for HDAC6 KD compared with control. (H) Bar graph representing intensity of acetyl peptide of aldolase following BAS-2 treatment or HDAC6 KD. (I) Image of aldolase crystal structure extracted from the Protein Data Bank. The peptide from (H) shown in green (inserted by Pymol), and the lysine residue that is acetylated is in pink. (J and K) Measurement of aldolase enzymatic activity in MDA231 cells following 24-hour BAS-2 treatment (J) and following HDAC6 KO (K). (L) Western blots for immunoprecipitated (IP) acetylated proteins in MDA231 cells following BAS-2 treatment (10 μM) for 24 hours or with HDAC6 KO. IgG, immunoglobulin G. (M) Bar graph representing intensity of the acetyl peptide of GAPDH following BAS-2 treatment or HDAC6 KD. (N and O) Measurement of GAPDH enzymatic activity in MDA231 cells following 24-hour BAS-2 treatment (N) and HDAC6 KO (O). (P) Western blots for immunoprecipitated acetylated proteins in MDA231 cells following BAS-2 treatment (10 μM) for 24 hours or with HDAC6 KO (n = 3, mean ± SEM). *P < 0.05, **P < 0.01, and ***P < 0.001.
Fig. 4
Fig. 4. HDAC6 interactome shows binding with glycolytic enzymes.
(A) Proteomic workflow. (B) Heatmap of z-score log-transformed ion current intensities of significantly enriched proteins of HDAC6 immunoprecipitation. (C) Volcano plot illustrating the proteins interacting with HDAC6. (D) Significantly enriched KEGG pathways from HDAC6-interacting proteins. (E) Significantly enriched KEGG pathways from the 15 overlapping proteins from HDAC6 IP and acetylation experiments. Glycolytic pathway showing the proteins that HDAC6 interacts with and the proteins that have increased acetylation following BAS-2 treatment or HDAC6 KD. (F) Analysis of the expression of ALDOA, GAPDH, ENO1, LDHA, and LDHB in patients with TNBC in published RNA-sequencing data from TCGA. IHC, immunohistochemistry; ALDOA, aldolase A; ENO1, enolase 1; LDHA, lactate dehydrogenase A.
Fig. 5
Fig. 5. Chemical inhibition and knockout of HDAC6 reduces glycolysis.
(A) Representative ECAR traces (mpH min−1 μg−1 of protein) are shown (mean ± SEM) for MCF10a (n = 2) and MDA231 (n = 4) cells treated with DMSO or BAS-2 (10 μM) for 24 hours. (B) Fold change in glycolysis and glycolytic capacity (n = 2/4, mean ± SD). NS, not significant. (C and E) Representative ECAR traces for MDA231 cells following HDAC6 KO (C) and treated with BAS-2 (10 μM) for 24 hours (E). (D and F) Fold change in glycolysis and glycolytic capacity (n = 3, mean ± SEM). (G) MDA231 cells were traced with 10 mM U13C6 glucose following 10 μM BAS-2 treatment for 24 hours. (H to K) Percentages of phosphoenolpyruvate (PEP; M + 3) (H), 3-phosphoglyceric acid (3PG) (M + 3) (I), pyruvate (M + 3) (J), and lactate (K) from glucose are shown (n = 3, mean ± SEM). (L) Lactate and pyruvate secreted from MDA231 cells treated with 10 μM BAS-2 for 24 hours (n = 3, mean ± SEM). (M) Representative ECAR traces for 4T1 cells treated with DMSO or BAS-2 for 24 hours. (N) Fold change in glycolysis and glycolytic capacity (n = 3, mean ± SEM). (O) ECAR values (mpH min−1 μg−1 of protein) shown for 4T1 following HDAC6 KO. (P) Fold change in glycolysis and glycolytic capacity (n = 3, mean ± SEM). (Q) Schematic of in vivo experiment. (R) Metabolites extracted from tumors were analyzed (n = 5, mean ± SD). *P < 0.05, **P < 0.01, and ***P < 0.001.

References

    1. Perou C. M., Sørlie T., Eisen M. B., van de Rijn M., Jeffrey S. S., Rees C. A., Pollack J. R., Ross D. T., Johnsen H., Akslen L. A., Fluge Ø., Pergamenschikov A., Williams C., Zhu S. X., Lønning P. E., Børresen-Dale A.-L., Brown P. O., Botstein D., Molecular portraits of human breast tumours. Nature 406, 747–752 (2000). - PubMed
    1. Bianchini G., Balko J. M., Mayer I. A., Sanders M. E., Gianni L., Triple-negative breast cancer: Challenges and opportunities of a heterogeneous disease. Nat. Rev. Clin. Oncol. 13, 674–690 (2016). - PMC - PubMed
    1. Carey L., Winer E., Viale G., Cameron D., Gianni L., Triple-negative breast cancer: Disease entity or title of convenience? Nat. Rev. Clin. Oncol. 7, 683–692 (2010). - PubMed
    1. Liedtke C., Mazouni C., Hess K. R., André F., Tordai A., Mejia J. A., Symmans W. F., Gonzalez-Angulo A. M., Hennessy B., Green M., Cristofanilli M., Hortobagyi G. N., Pusztai L., Response to neoadjuvant therapy and long-term survival in patients with triple-negative breast cancer. J. Clin. Oncol. 26, 1275–1281 (2008). - PubMed
    1. Holohan C., Van Schaeybroeck S., Longley D. B., Johnston P. G., Cancer drug resistance: An evolving paradigm. Nat. Rev. Cancer 13, 714–726 (2013). - PubMed

Publication types

MeSH terms

Substances

LinkOut - more resources