

Systemic inequalities for LGBTQ professionals in STEM
- PMID: 33523910
- PMCID: PMC7810386
- DOI: 10.1126/sciadv.abe0933
Systemic inequalities for LGBTQ professionals in STEM
Abstract
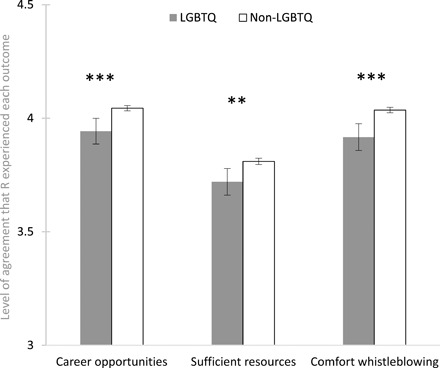
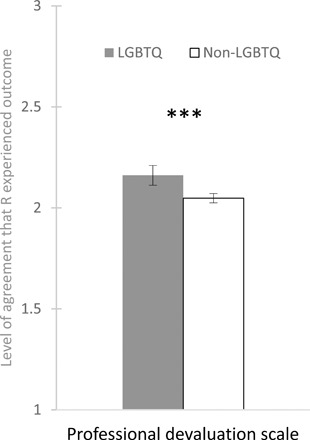
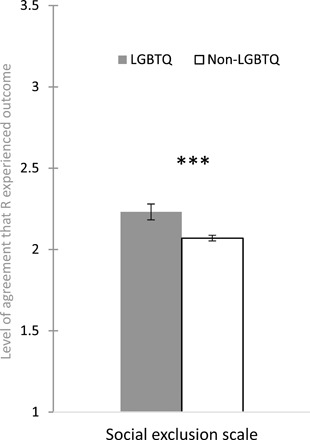
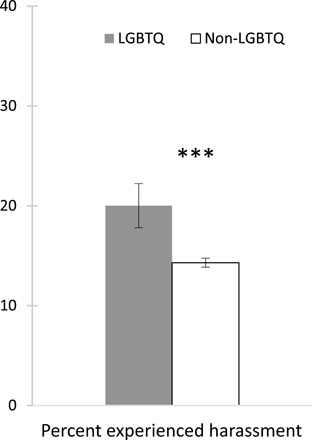
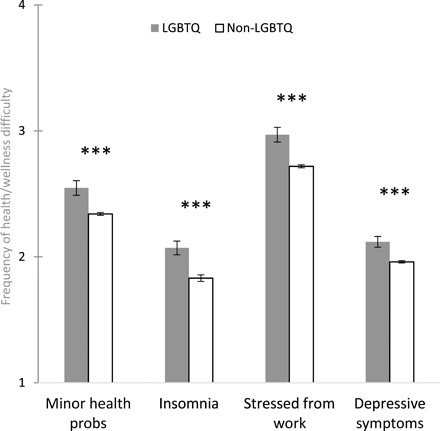
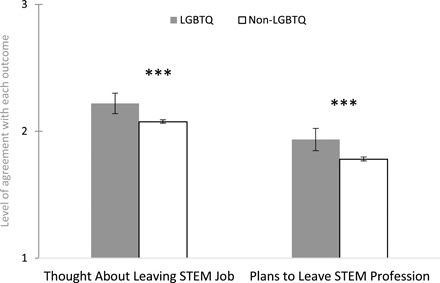
Researchers have documented race and gender inequality in science, technology, engineering, and math (STEM) for decades. Do lesbian, gay, bisexual, transgender, and queer (LGBTQ) professionals face parallel experiences of disadvantage in STEM? Using representative survey data from 21 STEM professional societies (N sample = 25,324; N LGBTQ = 1006), this paper presents multidimensional and methodologically robust documentation of 5 dimensions of LGBTQ inequality in STEM. Controlling for variation by demographic, discipline, and job factors, LGBTQ STEM professionals were more likely to experience career limitations, harassment, and professional devaluation than their non-LGBTQ peers. They also reported more frequent health difficulties and were more likely to intend to leave STEM. These trends were similar across STEM disciplines and employment sectors. We found no differences by LGBTQ status in education level, work effort, or job commitment. These findings reveal LGBTQ status as a clear axis of inequality in STEM and motivate further research into the mechanisms producing such outcomes.
Copyright © 2021 The Authors, some rights reserved; exclusive licensee American Association for the Advancement of Science. No claim to original U.S. Government Works. Distributed under a Creative Commons Attribution NonCommercial License 4.0 (CC BY-NC).
Figures
References
-
- NAESM, Promising Practices for Addressing the Underrepresentation of Women in Science, Engineering, and Medicine: Opening Doors (National Academies of Sciences Engineering and Medicine, 2020). - PubMed
-
- NAESM, Sexual Harassment of Women: Climate, Culture, and Consequences in Academic Sciences, Engineering, and Medicine (National Academies of Sciences Engineering and Medicine, 2018). - PubMed
-
- Tao Y., Earnings of academic scientists and engineers: intersectionality of gender and race/ethnicity effects. Am. Behav. Sci. 62, 625–644 (2018).
-
- Sommers S. R., On racial diversity and group decision making: Identifying multiple effects of racial composition on jury deliberations. J. Pers. Soc. Psychol. 90, 597–612 (2006). - PubMed
Publication types
Grants and funding
LinkOut - more resources
Full Text Sources
Other Literature Sources
