. 2021 Jan 22;7(4):eaay5347.
doi: 10.1126/sciadv.aay5347. Print 2021 Jan.

Development of optically controlled "living electrodes" with long-projecting axon tracts for a synaptic brain-machine interface

Affiliations

Development of optically controlled "living electrodes" with long-projecting axon tracts for a synaptic brain-machine interface

Dayo O Adewole et al. Sci Adv. .

Abstract

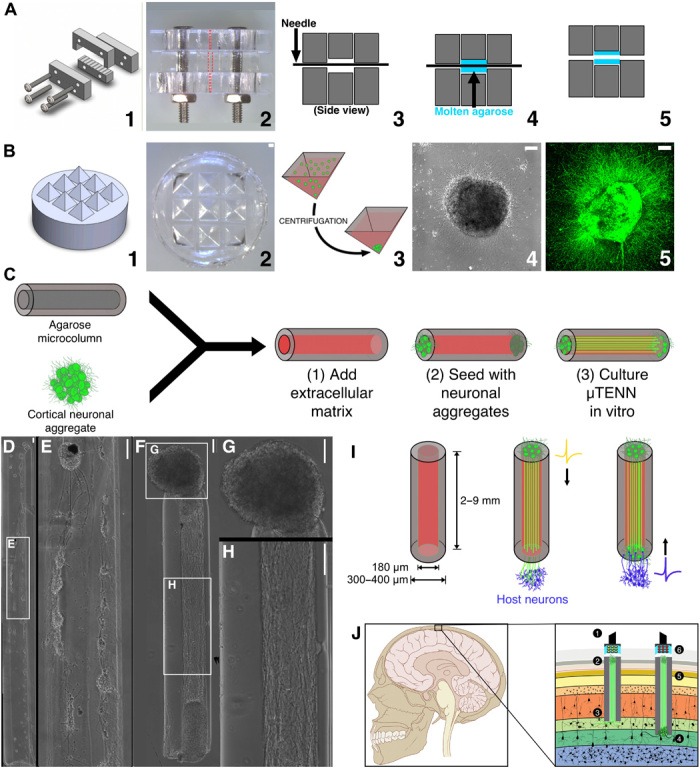
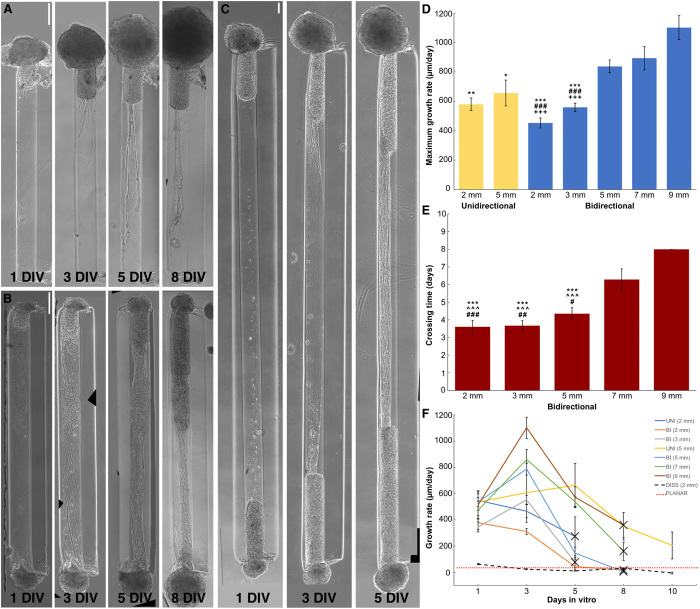
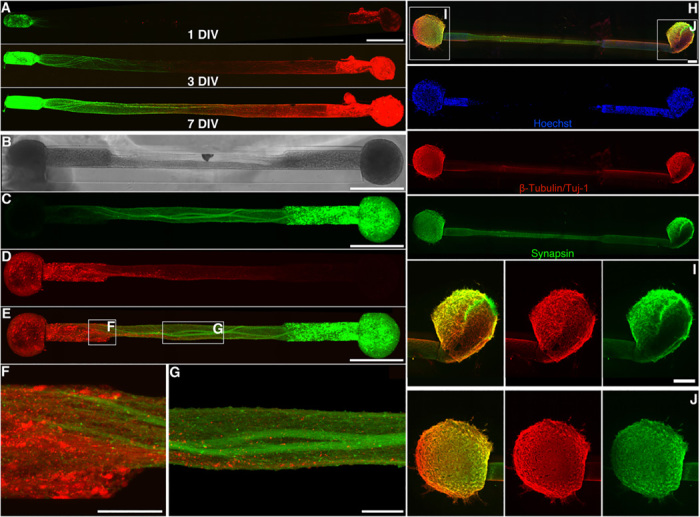
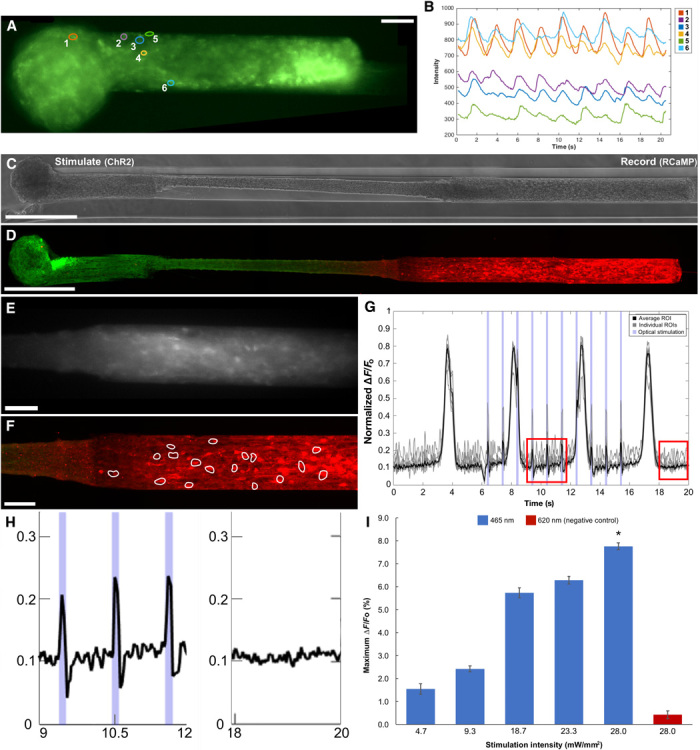
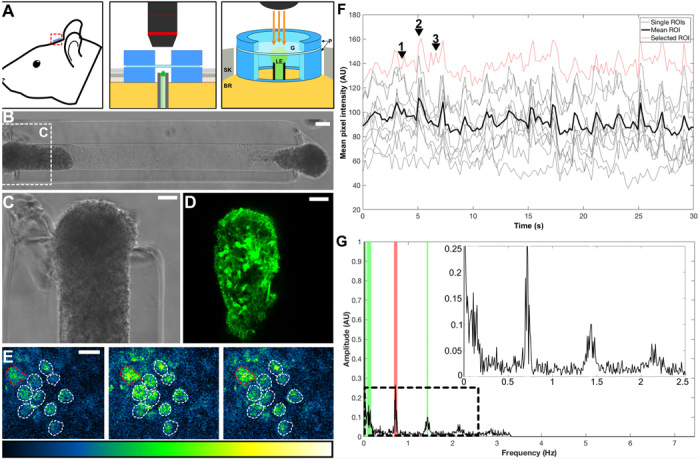
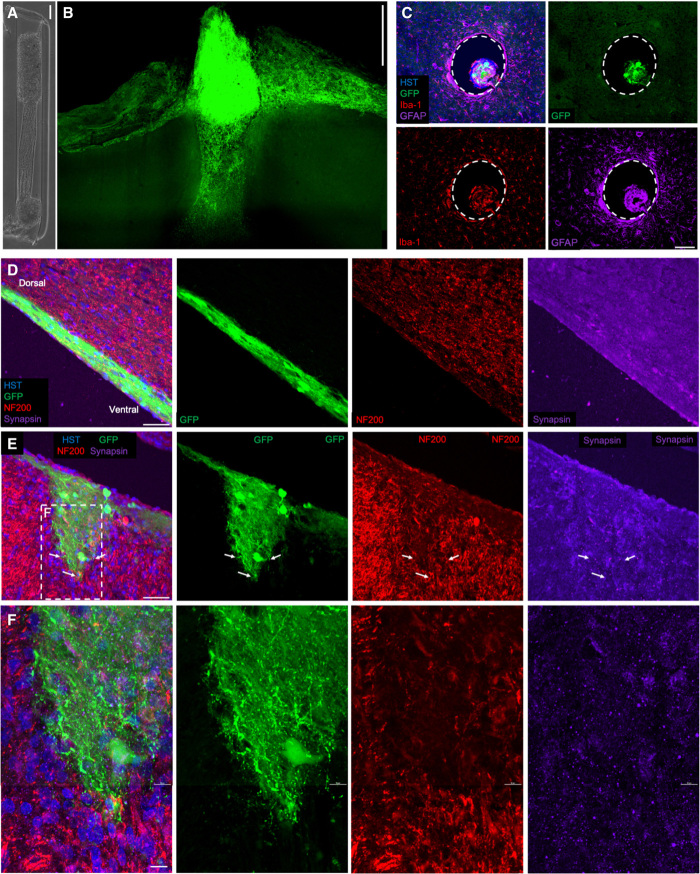
For implantable neural interfaces, functional/clinical outcomes are challenged by limitations in specificity and stability of inorganic microelectrodes. A biological intermediary between microelectrical devices and the brain may improve specificity and longevity through (i) natural synaptic integration with deep neural circuitry, (ii) accessibility on the brain surface, and (iii) optogenetic manipulation for targeted, light-based readout/control. Accordingly, we have developed implantable "living electrodes," living cortical neurons, and axonal tracts protected within soft hydrogel cylinders, for optobiological monitoring/modulation of brain activity. Here, we demonstrate fabrication, rapid axonal outgrowth, reproducible cytoarchitecture, and simultaneous optical stimulation and recording of these tissue engineered constructs in vitro. We also present their transplantation, survival, integration, and optical recording in rat cortex as an in vivo proof of concept for this neural interface paradigm. The creation and characterization of these functional, optically controllable living electrodes are critical steps in developing a new class of optobiological tools for neural interfacing.


Figures

Fig. 1
Fig. 1. Aggregate μTENN fabrication and living electrode concept.
μTENNs comprise a hydrogel microcolumn, living neuronal aggregates, and an extracellular matrix lumen. (A) 1: A customizable acrylic mold for generating microcolumns. 2: Top view of the mold dashed lines indicate the outer diameter (OD; middle) and the inner diameter (ID; top and bottom). 3: Needles of the desired inner diameter are inserted into the mold. 4: Microcolumns are cast in agarose (blue). 5: Microcolumns are removed after needle removal and mold disassembly. (B) 1: A three-dimensional (3D) printed mold for square pyramidal wells. 2: Pyramidal wells cast in polydimethylsiloxane (PDMS). 3: Dissociated neurons (green) centrifuged in the wells to form spheroidal aggregates. 4: Phase image of an aggregate 24 hours after plating. 5: Confocal reconstruction of aggregate at 72 hours, labeled with green fluorescent protein (GFP). (C) Microcolumns (gray) are filled with an extracellular collagen-laminin matrix (red). Neuronal aggregates are then placed at the microcolumn terminal(s) and grown in vitro. (D) Early-generation μTENNs fabricated with dissociated neurons yielded limited control over the final network structure (E). Aggregate μTENNs (F) exhibit robust axonal growth and more controllable architecture, with discrete regions of cell bodies (G) and neuritic projections (H). (I) Left: Current μTENN dimensions for implantable living electrodes. Middle: Unidirectional μTENNs synapse host neurons (purple) to relay external inputs to targeted cortical regions. Right: Host neurons synapse bidirectional μTENNs, relaying activity from host cortex for monitoring via the dorsal aggregate. (J) Optogenetically active μTENNs as transplantable input/output channels. Inputs: An LED array (1) optically stimulates a unidirectional, channelrhodopsin-positive μTENN (2) to activate layer IV neurons (3). Outputs: Layer V neurons (4) synapse a bidirectional μTENN (5); relayed neuronal activity is recorded by a photodiode array on the brain surface (6). Scale bars, 100 μm. Photo credit: Dayo O. Adewole, University of Pennsylvania.
Fig. 2
Fig. 2. Axonal growth in aggregate μTENNs over time.
Aggregate μTENNs grow rapidly over 1 to 8 DIV; unidirectional μTENNs (A) project axons to the opposing terminal, while bidirectional μTENNs (B) axons cross the microcolumn and synapse with the opposing aggregate. Representative 2-mm μTENNs shown at 1, 3, 5, and 8 DIV. (C) Representative 5-mm μTENN shown at 1, 3, and 5 DIV. (D) Average maximum growth rates across μTENN lengths. In general, longer bidirectional μTENNs displayed higher peak growth rates. Symbols indicate a significantly lower maximum growth rate than a specific group: 9-mm bidirectional (*), 7-mm bidirectional (#), and 5-mm bidirectional (+) μTENNs, respectively. Symbol count denotes significance level (1: P < 0.05; 2: P < 0.01; 3: P < 0.001). (E) Average crossing times across μTENN groups. Similarly, longer constructs tended to take more time to develop. Unidirectional (5 mm) μTENNs did not fully cross the microcolumn by 10 DIV and were not included. Symbols and symbol counts match those described in (D), with the addition of significance versus 8-mm bidirectional (^). (F) Growth rates for unidirectional, bidirectional, and dissociated μTENNs at 1, 3, 5, 8, and 10 DIV. Growth rates were quantified by identifying the longest neurite from an aggregate in phase microscopy images (×10 magnification) at the specified time points. Crosses indicate axons crossing the length of the microcolumn (unidirectional) or connecting between aggregates (bidirectional). Error bars denote SEM. Scale bars, 200 μm.
Fig. 3
Fig. 3. Aggregate μTENN architecture.
Bidirectional μTENNs were labeled with GFP (green) and mCherry (red) to observe aggregate-specific axonal growth and structure in vitro. (A) Confocal reconstructions of a bidirectional, GFP/mCherry-labeled μTENN at 1, 3, and 7 DIV. (B) Phase image of a bidirectional, GFP/mCherry-labeled μTENN at 5 DIV. (C to E) Confocal reconstruction of the μTENN from (B) at 7 DIV, with insets showing axons from each aggregate making contact with the opposing population (F) and growing along each other (G) in the microcolumn lumen. (H) Confocal reconstruction of a representative bidirectional μTENN at 10 DIV, immunolabeled for cell nuclei (Hoechst, blue), axons (β-tubulin III/Tuj-1, red), and synapses (synapsin, green). Cell bodies are localized to the microcolumn terminals with axonal tracts spanning the distance. Insets in (H) refer to callout boxes (I) and (J) showing aggregate zoom-ins of synapses, axonal networks, and their overlay. Scale bars, 500 μm (A to C and E); 100 μm (F and G); and 200 μm (H and I).
Fig. 4
Fig. 4. Calcium imaging and optical stimulation in aggregate μTENNs.
(A) Representative GCaMP+ μTENN at 10 DIV with single-neuron ROIs outlined. (B) Average fluorescent intensities of the ROIs from (A) recorded over time indicate neuronal activity similar to constructs in earlier work (15). Intensity traces are normalized to a background (empty) region. Phase image (C) and confocal reconstruction (D) of a μTENN at 10 DIV in vitro, virally transduced such that the left aggregate expresses ChR2 (optical actuator) and the right aggregate expresses the calcium reporter RCaMP, enabling simultaneous control and monitoring with light. (E) The RCaMP+ aggregate from (C) and (D) under fluorescent microscopy during recording (16 frames per second). (F) Confocal image of the RCaMP+ aggregate poststimulation. ROIs containing single neurons were manually defined (white outlines). (G) Normalized pixel intensity of ROIs within the RCaMP+ aggregate from (A) to (C) during stimulation. Gray lines indicate representative, user-defined ROIs randomly selected for analysis, which were averaged to obtain a mean ROI of the aggregate (solid black line). A single train of 1-Hz, 100-ms stimulation pulses is shown as blue bands along the abscissa. The changes in pixel intensity due to stimulation of the input aggregate can be seen as sharp spikes occurring within the endogenous, large-amplitude slow-wave activity. (H) Zoom-ins of the red insets from (D) showing μTENN activity during (left) stimulation and after (right) optical stimulation. (I) Average maximum ∆F/Fo across stimulation intensities. Although the maximum ∆F/Fo trended upward, the differences were not significant across intensities. Statistical comparison revealed that stimulation with the control wavelength (620 nm) yielded significantly lower maximum ∆F/Fo than with 465 nm (*P < 0.05). Scale bars, 100 μm.
Fig. 5
Fig. 5. Living electrode function in vivo.
(A) Conceptual schematic of the living electrode and cranial window, with adjacent zoom-ins (middle and right) showing the PDMS rings (P) sized to the skull craniotomy (SK), securing the glass coverslip (G), and protecting the implanted living electrode (LE) and underlying brain (BR), which may then be imaged chronically (orange arrows). (B) Phase image of a bidirectional GCaMP+ μTENN before implant in rodent cortex with a zoom-in (C) of the dorsal aggregate. (D) Multiphoton image of the same dorsal μTENN aggregate acquired immediately after implant. (E) Single frames from multiphoton recording of the living electrode from (B) to (D) at 10 days after implant during low activity (left), breathing (middle), and nonartifact neuronal activity (right). ROIs containing single neurons are outlined. The Lookup Table (LUT) scale (0 to 4096) is provided below. (F) Time course of calcium fluorescence acquisition from (D), showing the individual (gray/red) and mean (black) ROIs. The red trace represents the ROI outlined in red in (E). Numbered arrowheads denote timestamps from (D). (G) Frequency analysis via Fourier transform of the data from (E), showing spectral peaks due to breathing (red) and neuronal activity (green). Inset shows low-frequency activity similar to that observed in vitro. Scale bars, 50 μm (B and C) and 20 μm (D). AU, arbitrary units.
Fig. 6
Fig. 6. Living electrode survival and integration in vivo.
(A) Phase image of a bidirectional μTENN before implantation; aggregates have been internalized to the microcolumn. (B) Multiphoton image of the μTENN from (F) at 1 month after implant, showing GCaMP+ μTENN neurons and processes within and immediately surrounding the construct. At 1 month, the dorsal aggregate had descended into the microcolumn, suggesting that externalized aggregates may be required to maintain a cohesive neuronal population at the surface. (C) Axial view of implant showing μTENN neurons/axons in the lumen at 1 month after implant. To visualize the extent of the inflammation response at 1 month following delivery, sections orthogonal to the implant site were stained for microglia/macrophages (Iba-1, red) and astrocytes (GFAP, far red). Minimal host neuroinflammatory response was observed at this time point surrounding the implanted construct. Dashed lines denote the host brain-μTENN interface. (D to F) Longitudinal view of implanted μTENN within the corticothalamic tract at 1 month after implant, with evidence that the construct retained its axonal tracts and overall axosomatic architecture (GFP, green). (E) μTENN neurons and axons (GFP, green) were found projecting ventrally with neurons and neurites interfacing with host tissue at the (deep) ventral end. GFP+ μTENN neurons were visualized in discrete regions with axons extending within the lumen parallel to the cortical-thalamic axis. These findings demonstrate that following stereotaxic microinjection, aggregate μTENNs survive, with neurite extension and integration out to at least 1 month in vivo. Arrows denote μTENN neurites penetrating the host brain and putative synapse formation, with dashed inset representing zoom-in (F). Scale bars, 100 μm (A to C); 50 μm (D and E); and 10 μm (F). HST, Hoechst.

References

    1. Adewole D. O., Serruya M. D., Harris J. P., Burrell J. C., Petrov D., Chen H. I., Wolf J. A., Cullen D. K., The evolution of neuroprosthetic interfaces. Crit. Rev. Biomed. Eng. 44, 123–152 (2016). - PMC - PubMed
    1. Tresco P. A., Winslow B. D., The challenge of integrating devices into the central nervous system. Crit. Rev. Biomed. Eng. 39, 29–44 (2011). - PubMed
    1. Harris J. P., Tyler D. J., Biological, mechanical, and technological considerations affecting the longevity of intracortical electrode recordings. Crit. Rev. Biomed. Eng. 41, 435–456 (2013). - PubMed
    1. Grill W. M., Norman S. E., Bellamkonda R. V., Implanted neural interfaces: Biochallenges and engineered solutions. Annu. Rev. Biomed. Eng. 11, 1–24 (2009). - PubMed
    1. Polikov V. S., Tresco P. A., Reichert W. M., Response of brain tissue to chronically implanted neural electrodes. J. Neurosci. Methods 148, 1–18 (2005). - PubMed

Publication types