

Molecular subtyping of Alzheimer's disease using RNA sequencing data reveals novel mechanisms and targets
- PMID: 33523961
- PMCID: PMC7787497
- DOI: 10.1126/sciadv.abb5398
Molecular subtyping of Alzheimer's disease using RNA sequencing data reveals novel mechanisms and targets
Abstract
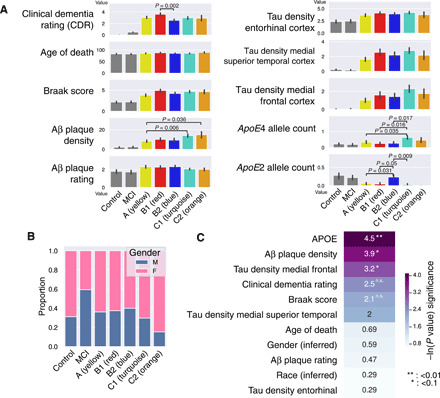
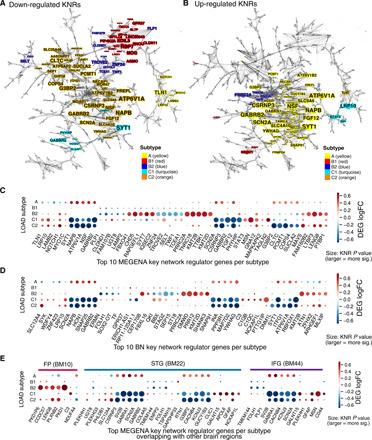
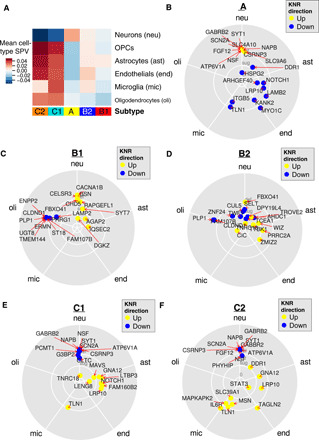
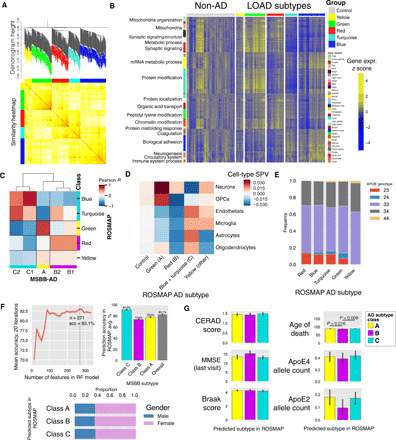
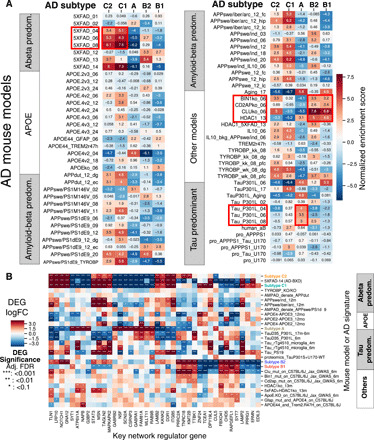
Alzheimer's disease (AD), the most common form of dementia, is recognized as a heterogeneous disease with diverse pathophysiologic mechanisms. In this study, we interrogate the molecular heterogeneity of AD by analyzing 1543 transcriptomes across five brain regions in two AD cohorts using an integrative network approach. We identify three major molecular subtypes of AD corresponding to different combinations of multiple dysregulated pathways, such as susceptibility to tau-mediated neurodegeneration, amyloid-β neuroinflammation, synaptic signaling, immune activity, mitochondria organization, and myelination. Multiscale network analysis reveals subtype-specific drivers such as GABRB2, LRP10, MSN, PLP1, and ATP6V1A We further demonstrate that variations between existing AD mouse models recapitulate a certain degree of subtype heterogeneity, which may partially explain why a vast majority of drugs that succeeded in specific mouse models do not align with generalized human trials across all AD subtypes. Therefore, subtyping patients with AD is a critical step toward precision medicine for this devastating disease.
Copyright © 2021 The Authors, some rights reserved; exclusive licensee American Association for the Advancement of Science. No claim to original U.S. Government Works. Distributed under a Creative Commons Attribution NonCommercial License 4.0 (CC BY-NC).
Figures

References
-
- Alzheimer’s Association, 2019 Alzheimer’s Disease Facts and Figures (2019); https://alz.org/media/Documents/alzheimers-facts-and-figures-2019-r.pdf.
-
- Fiandaca M. S., Mapstone M. E., Cheema A. K., Federoff H. J., The critical need for defining preclinical biomarkers in Alzheimer’s disease. Alzheimers Dement. 10, S196–S212 (2014). - PubMed
-
- De Strooper B., Karran E., The cellular phase of Alzheimer’s disease. Cell 164, 603–615 (2016). - PubMed
-
- Sekiya M., Wang M., Fujisaki N., Sakakibara Y., Quan X., Ehrlich M. E., De Jager P. L., Bennett D. A., Schadt E. E., Gandy S., Ando K., Zhang B., Iijima K. M., Integrated biology approach reveals molecular and pathological interactions among Alzheimer’s Aβ42, Tau, TREM2, and TYROBP in Drosophila models. Genome Med. 10, 26 (2018). - PMC - PubMed
-
- Iacono D., Resnick S. M., O’Brien R., Zonderman A. B., An Y., Pletnikova O., Rudow G., Crain B., Troncoso J. C., Mild cognitive impairment and asymptomatic alzheimer disease subjects: Equivalent β-amyloid and tau loads with divergent cognitive outcomes. J. Neuropathol. Exp. Neurol. 73, 295–304 (2014). - PMC - PubMed
Publication types
MeSH terms
Substances
Grants and funding
- U01 AG046152/AG/NIA NIH HHS/United States
- R01 AG072562/AG/NIA NIH HHS/United States
- RF1 AG057440/AG/NIA NIH HHS/United States
- RF1 AG054014/AG/NIA NIH HHS/United States
- K01 AG062683/AG/NIA NIH HHS/United States
- RF1 AG059319/AG/NIA NIH HHS/United States
- R01 AG068030/AG/NIA NIH HHS/United States
- RF1 AG044546/AG/NIA NIH HHS/United States
- T32 GM007280/GM/NIGMS NIH HHS/United States
- U01 AG058635/AG/NIA NIH HHS/United States
- RF1 AG048923/AG/NIA NIH HHS/United States
- P30 AG066514/AG/NIA NIH HHS/United States
- U01 AG052411/AG/NIA NIH HHS/United States
- U01 AG032984/AG/NIA NIH HHS/United States
- R01 AG030146/AG/NIA NIH HHS/United States
- U01 AG046170/AG/NIA NIH HHS/United States
- R01 AG057907/AG/NIA NIH HHS/United States
- I01 BX003380/BX/BLRD VA/United States
- R01 AG017917/AG/NIA NIH HHS/United States
- RF1 AG058501/AG/NIA NIH HHS/United States
- I01 RX002290/RX/RRD VA/United States
- P30 AG010161/AG/NIA NIH HHS/United States
- R56 AG058655/AG/NIA NIH HHS/United States
- R01 AG062355/AG/NIA NIH HHS/United States
- R01 AG036836/AG/NIA NIH HHS/United States
- R01 AG015819/AG/NIA NIH HHS/United States
LinkOut - more resources
Full Text Sources
Other Literature Sources
Medical
Research Materials
Miscellaneous
