. 2021 Jan 6;7(2):eabe5948.
doi: 10.1126/sciadv.abe5948. Print 2021 Jan.

Mass spectrometry imaging identifies abnormally elevated brain l-DOPA levels and extrastriatal monoaminergic dysregulation in l-DOPA-induced dyskinesia

Affiliations

Mass spectrometry imaging identifies abnormally elevated brain l-DOPA levels and extrastriatal monoaminergic dysregulation in l-DOPA-induced dyskinesia

Elva Fridjonsdottir et al. Sci Adv. .

Abstract

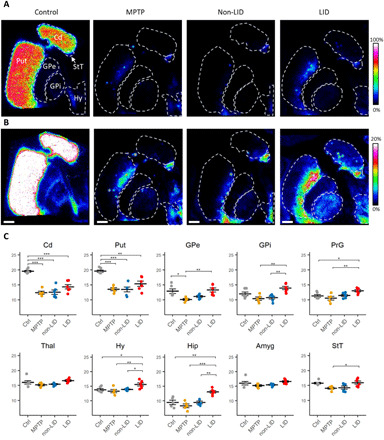
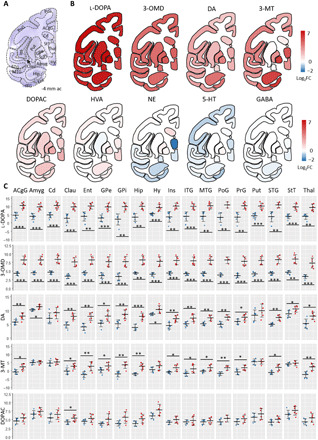
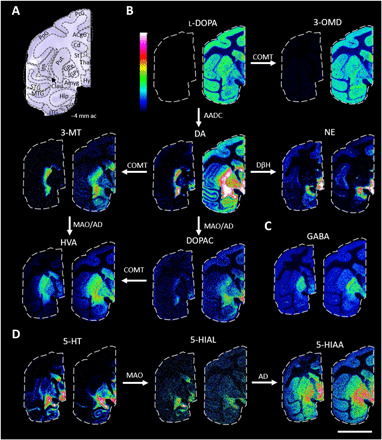
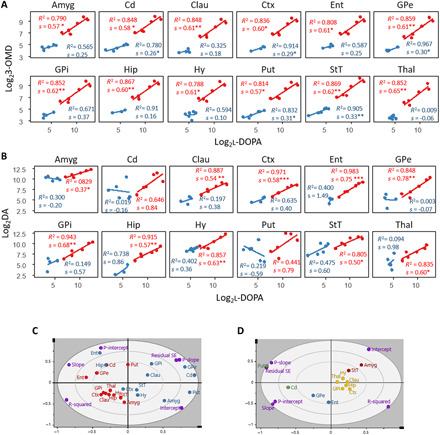
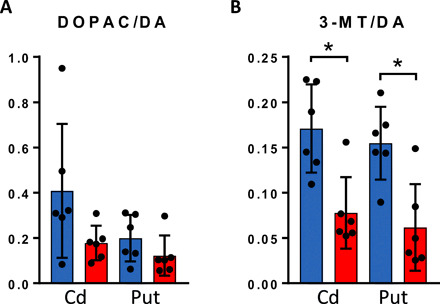
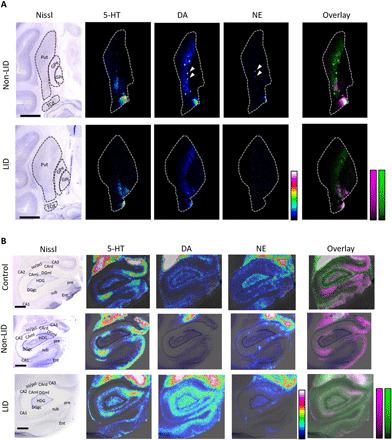
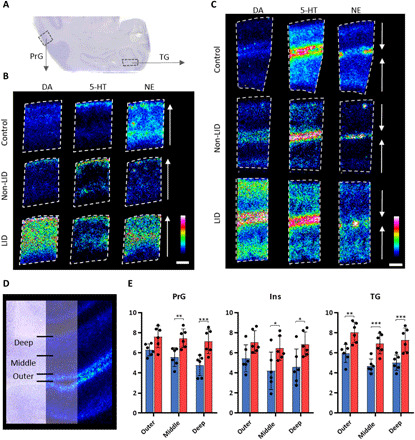
l-DOPA treatment for Parkinson's disease frequently leads to dyskinesias, the pathophysiology of which is poorly understood. We used MALDI-MSI to map the distribution of l-DOPA and monoaminergic pathways in brains of dyskinetic and nondyskinetic primates. We report elevated levels of l-DOPA, and its metabolite 3-O-methyldopa, in all measured brain regions of dyskinetic animals and increases in dopamine and metabolites in all regions analyzed except the striatum. In dyskinesia, dopamine levels correlated well with l-DOPA levels in extrastriatal regions, such as hippocampus, amygdala, bed nucleus of the stria terminalis, and cortical areas, but not in the striatum. Our results demonstrate that l-DOPA-induced dyskinesia is linked to a dysregulation of l-DOPA metabolism throughout the brain. The inability of extrastriatal brain areas to regulate the formation of dopamine during l-DOPA treatment introduces the potential of dopamine or even l-DOPA itself to modulate neuronal signaling widely across the brain, resulting in unwanted side effects.


Figures

Fig. 1
Fig. 1. Tissue distribution of DA in basal ganglia structures and regional quantitation of DA.
DA distribution in basal ganglia structures in (A) control, MPTP, non-LID, and LID tissue sections, scaled to 0 to 100% of maximum intensity and (B) to 0 to 20% of maximum intensity. Lateral resolution, 80 μm; all images are log-transformed and RMS-normalized; scale bars, 4 mm. Coronal level, −4 mm ac. (C) Regional quantitation of DA; y axis shows log2AUC of DA. n = 6 for Ctrl, non-LID, and LID; n = 5 for MPTP. A two-way ANOVA followed by a Tukey’s multiple comparisons test was performed. *P < 0.05; **P < 0.01; ***P < 0.001. Amyg, amygdala; Cd, caudate; Ctrl, control; GPe, external globus pallidus; GPi, internal globus pallidus; Hip, hippocampus; Hy, hypothalamus; PrG, precentral gyrus; Put, putamen; StT, nucleus of stria terminalis; Thal, thalamus.
Fig. 2
Fig. 2. Regional alterations of metabolites in non-LID versus LID.
(A) Nissl-stained macaque brain tissue section at −4 mm ac with annotated brain regions. (B) Regional heat maps color-coded according to log2FC between non-LID and LID. Blue indicates elevated levels in non-LID, red indicates higher levels in LID, and white indicates no change. (C) Regional quantitation of metabolites in non-LID and LID. Log2-transformed AUC values for each sample are shown. Blue, non-LID; red, LID. Crossbar and error bars show means and SDs. A Shapiro-Wilk normality test was used to determine normal distribution of samples; a Student’s t test was used when passing normality test; otherwise, a Mann-Whitney U test was used. *P < 0.05; **P < 0.01; ***P < 0.001. For all metabolites in all regions, n = 6, except n = 5 for PoG in LID group, n = 3 for PoG in non-LID group, and n = 5 for Hip in non-LID. Statistical results are summarized in table S2. ac, anterior commissure; ACgG, anterior cingulate gyrus; Clau, claustrum; Ent, entorhinal area; Ins, insula; ITG, inferior temporal gyrus; MTG, middle temporal gyrus; PoG, postcentral gyrus; STG, superior temporal gyrus.
Fig. 3
Fig. 3. MALDI-MS images of neurotransmitters and metabolites in non-LID and LID.
(A) Nissl-stained macaque brain tissue section at −4 mm ac with annotated brain regions. (B) Catecholaminergic metabolic pathway. All MALDI-MS images are RMS-normalized and log-transformed intensities. l-DOPA, 3-OMD, 3-MT, HVA, and DOPAC are scaled to 0 to 100% of maximum intensity, and DA and NE are scaled to 0 to 10% of maximum intensity. (C) GABA, scaled to 0 to 100% of maximum intensity. (D) 5-HT metabolic pathway: 5-HT scaled to 0 to 15%, 5-HIAL scaled to 0 to 20%, and 5-HIAA scaled to 0 to 50% of maximum intensity. For all images: left section, non-LID; right section, LID; scale bar, 20 mm; lateral resolution, 150 μm. Enzymes involved are annotated by the arrows. COMT, catechol-O-methyl transferase; MAO, monoamine oxidase; AADC, aromatic l-amino acid decarboxylase; DβH, dopamine-β-hydroxylase; AD, aldehyde dehydrogenase.
Fig. 4
Fig. 4. Correlation of l-DOPA to 3-OMD or DA in non-LID and LID.
(A) LR of the change in 3-OMD content in response to l-DOPA. (B) LR of the change in DA content in response to l-DOPA. (A and B) Blue, non-LID; red, LID. A significant linear relationship is indicated with *P < 0.05, **P < 0.005, and ***P < 0.001. For all linear models, n = 6 in the LID group, and Cd, Hy, Put, and StT in the non-LID group. For the remaining non-LID regions, n = 5 in Amyg and Thal, n = 4 in Clau, Ctx, GPe, and GPi, n = 3 in Hip in both correlations, n = 4 in Ent in l-DOPA to 3-OMD, and n = 3 in Ent in l-DOPA to DA. (C) PCA model computed from results of LR models in (B); blue, non-LID; red, LID; purple, loadings. (D) PCA model computed from results of LR analysis for change in DA in response to increased l-DOPA in LID only. Regions are color-coded according to hierarchical clustering and grouping structures that respond similarly to changes in l-DOPA content. P-intercept, P value for intercept; P-slope, P value for slope; R-squared, R2; Residual SE, SE of residuals.
Fig. 5
Fig. 5. DA metabolism in striatum.
(A) DOPAC/DA ratio (MAO metabolism of DA) and (B) 3-MT/DA ratio (COMT metabolism of DA) in Cd and Put in non-LID (blue) and LID (red). Bars show means, and error bars show SDs (n = 6 for both groups in both regions). A Mann-Whitney U test was used; results are summarized in table S4. *P < 0.05.
Fig. 6
Fig. 6. Comparison of 5-HT, DA, and NE localization in basal ganglia and hippocampus.
(A) Nissl-stained section showing basal ganglia structures at −6 mm ac and MALDI-MS images of 5-HT (scaled to 0 to 25%), DA (scaled 0 to 30%), and NE (scaled to 0 to 40%) in non-LID and LID. Lateral resolution, 50 μm. Scale bars, 5 mm. White arrows indicate DA and NE patches that colocalize. (B) Nissl-stained section of Hip at −4 mm ac and MALDI-MS images of 5-HT, DA, and NE (all scaled to 0 to 20%) in control, non-LID, and LID macaque brain. Lateral resolution, 80 μm. Scale bars, 2 mm. For (A) and (B), images are RMS-normalized and log-transformed, and overlays show DA in green and 5-HT in magenta. CA, Cornu ammonis; CAml, molecular layer of the Hip; CArd, stratum radiatum; DGgc, granular layer of the dentate gyrus; DGml, molecular layer of the dentate gyrus; HDG, hilus of the dentate gyrus; so, stratum oriens; pcl, pyramidal cell layer; pre, presubiculum; sub, subiculum; TCd, tail of caudate nucleus.
Fig. 7
Fig. 7. Mapping of DA throughout cortical areas and layers.
(A) Nissl-stained coronal tissue section at −4 mm ac illustrating the location of the analyzed cortical area. (B) MS images of DA, 5-HT, and NE in PrG and (C) TG at −4 mm ac. Color intensity scale is 0 to 50% for DA and 5-HT and 0 to 30% for NE. Lateral resolution, 50 μm; scale bar, 1 mm; images are RMS-normalized. The arrows in (B) and (C) show the orientation of the sample pointing toward the outer layers of the cortex. (D) Nissl-stained cortex section overlaid with DA distribution illustrating the three layers of the cortex that were analyzed. (E) Relative quantitation of DA in outer, middle, and deep cortical layers at −4 mm ac in the PrG, Ins, and TG. Bars show means, and error bars show SDs; blue, non-LID; red, LID. Statistics were performed using a two-way ANOVA and a post hoc Sidak’s multiple comparisons test (n = 6 for both groups in all cortical layers). *P < 0.05; **P < 0.01; ***P < 0.001. Two-way ANOVA results are summarized in table S5.

References

    1. Ahlskog J. E., Muenter M. D., Frequency of levodopa-related dyskinesias and motor fluctuations as estimated from the cumulative literature. Mov. Disord. 16, 448–458 (2001). - PubMed
    1. Politis M., Wu K., Loane C., Brooks D. J., Kiferle L., Turkheimer F. E., Bain P., Molloy S., Piccini P., Serotonergic mechanisms responsible for levodopa-induced dyskinesias in Parkinson’s disease patients. J. Clin. Invest. 124, 1340–1349 (2014). - PMC - PubMed
    1. de la Fuente-Fernandez R., Sossi V., Huang Z., Furtado S., Lu J.-Q., Calne D. B., Ruth T. J., Stoessl A. J., Levodopa-induced changes in synaptic dopamine levels increase with progression of Parkinson’s disease: Implications for dyskinesias. Brain 127, 2747–2754 (2004). - PubMed
    1. Bastide M. F., Meissner W. G., Picconi B., Fasano S., Fernagut P. O., Feyder M., Francardo V., Alcacer C., Ding Y., Brambilla R., Fisone G., Stoessl A. J., Bourdenx M., Engeln M., Navailles S., De Deurwaerdere P., Ko W. K., Simola N., Morelli M., Groc L., Rodriguez M. C., Gurevich E. V., Quik M., Morari M., Mellone M., Gardoni F., Tronci E., Guehl D., Tison F., Crossman A. R., Kang U. J., Steece-Collier K., Fox S., Carta M., Cenci M. A., Bezard E., Pathophysiology of L-dopa-induced motor and non-motor complications in Parkinson’s disease. Prog. Neurobiol. 132, 96–168 (2015). - PubMed
    1. Tanaka H., Kannari K., Maeda T., Tomiyama M., Suda T., Matsunaga M., Role of serotonergic neurons in L-DOPA-derived extracellular dopamine in the striatum of 6-OHDA-lesioned rats. Neuroreport 10, 631–634 (1999). - PubMed

Publication types

LinkOut - more resources