. 2021 Feb 1;17(2):e1008537.
doi: 10.1371/journal.pcbi.1008537. eCollection 2021 Feb.

Factors influencing estimates of HIV-1 infection timing using BEAST

Affiliations

Factors influencing estimates of HIV-1 infection timing using BEAST

Bethany Dearlove et al. PLoS Comput Biol. .

Abstract

While large datasets of HIV-1 sequences are increasingly being generated, many studies rely on a single gene or fragment of the genome and few comparative studies across genes have been done. We performed genome-based and gene-specific Bayesian phylogenetic analyses to investigate how certain factors impact estimates of the infection dates in an acute HIV-1 infection cohort, RV217. In this cohort, HIV-1 diagnosis corresponded to the first RNA positive test and occurred a median of four days after the last negative test, allowing us to compare timing estimates using BEAST to a narrow window of infection. We analyzed HIV-1 sequences sampled one week, one month and six months after HIV-1 diagnosis in 39 individuals. We found that shared diversity and temporal signal was limited in acute infection, and insufficient to allow timing inferences in the shortest HIV-1 genes, thus dated phylogenies were primarily analyzed for env, gag, pol and near full-length genomes. There was no one best-fitting model across participants and genes, though relaxed molecular clocks (73% of best-fitting models) and the Bayesian skyline (49%) tended to be favored. For infections with single founders, the infection date was estimated to be around one week pre-diagnosis for env (IQR: 3-9 days) and gag (IQR: 5-9 days), whilst the genome placed it at a median of 10 days (IQR: 4-19). Multiply-founded infections proved problematic to date. Our ability to compare timing inferences to precise estimates of HIV-1 infection (within a week) highlights that molecular dating methods can be applied to within-host datasets from early infection. Nonetheless, our results also suggest caution when using uniform clock and population models or short genes with limited information content.


Conflict of interest statement

The authors have declared that no competing interests exist.

Figures

Fig 1
Fig 1. Informative sites identified in the first six months of infection across the 9 HIV-1 genes and genome for 39 participants in the RV217 cohort.
A) The number of polymorphic sites. B) The proportion of polymorphic sites. C) The number of informative sites. D) The proportion of polymorphic sites that were only found in one sequence. Genes are ordered by median sequence length across participants. Points are colored gray for participants with infections founded by a single variant, and pink for those founded by multiple variants.
Fig 2
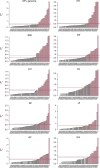
Fig 2. Identification of infections with single versus multiple HIV-1 founders.
The principal eigenvalues from the modified graph Laplacian are compared for each participant and gene. Barplots are sorted in increasing order, and values shifted so that the smallest value is zero. Bars are colored according to whether participants were classified as a single founder (gray) or multiple founder (pink) with NFL genomes. White bars show sequence datasets in which there were no informative sites. Lines indicating thresholds inferred from the median (brown), jump (blue), and partition (red) criteria of the principal eigenvalue test of founder multiplicity are shown.
Fig 3
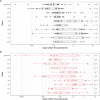
Fig 3. Estimates of the date of infection by gene and founder type.
Points are colored gray for participants with infections founded by a single variant (A), and pink for those founded by multiple variants (B). The scale is shown with a power modulus transformation for visibility, and is different for infections with single or multiple HIV-1 founders.
Fig 4
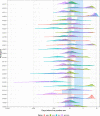
Fig 4. Posterior distributions of the date of infection for participants with a single founder population.
Vertical lines mark the median. The shaded blue area corresponds to the interval between the last negative and first positive HIV-1 RNA test (or diagnosis date). The shaded gray rectangle highlights the period between 7 and 14 days before diagnosis.
Fig 5
Fig 5. Comparison of model rankings for each model combination for single founders for each gene and NFL genome.
Each combination of the four clock (strict, uncorrelated exponential (UCED) relaxed, uncorrelated lognormal relaxed (UCLD), and random local (RLC)) and four population models (constant, exponential, skyline and birth-death) are represented on the x-axis, and the model placing on the y-axis. Each dot represents the model fitted for one participant. Models were ranked by their estimated marginal likelihood and rankings scaled by the total number of models fitted for that participant and gene.
Fig 6
Fig 6. Estimates of the date of infection for the best-fitting model, compared to the UCLD-skyline and strict-constant models.
Points are colored according to the relative rank of that model out of all models fitted for that participant and gene. Not all participants had a UCLD-skyline or strict-constant model fitted.
Fig 7
Fig 7. Improved BEAST estimates on the subpopulations from infections with multiple founder variants for the NFL genome.
The posterior distributions for the best-fitting model for each identified founder population are shown, with vertical lines marking the median. The shaded blue area corresponds to the interval between the last negative and first positive HIV-1 RNA test (or diagnosis date). Black crosses show the median estimate from assuming a single population (crosses not shown for estimates beyond 365 days prior to diagnosis, which are figured in Fig 3B). The number of visits, sequences and polymorphic sites corresponding to each subpopulation are reported, along with the overlap coefficient for posterior distributions when two subpopulations were analyzed. Only subpopulations with sequences covering at least two time points, a minimum of five sequences with more than one informative site, and significant temporal signal were analyzed.

References

    1. Fiebig EW, Wright DJ, Rawal BD, Garrett PE, Schumacher RT, Peddada L, et al. Dynamics of HIV viremia and antibody seroconversion in plasma donors: implications for diagnosis and staging of primary HIV infection. AIDS. 2003;17: 1871–1879. 10.1097/00002030-200309050-00005 - DOI - PubMed
    1. Kahn JO, Walker BD. Acute human immunodeficiency virus type 1 infection. The New England Journal of Medicine. 1998;339: 33–39. 10.1056/NEJM199807023390107 - DOI - PubMed
    1. McMichael AJ, Borrow P, Tomaras GD, Goonetilleke N, Haynes BF. The immune response during acute HIV-1 infection: clues for vaccine development. Nature Reviews Immunology. 2010;10: 11–23. 10.1038/nri2674 - DOI - PMC - PubMed
    1. Cohen MS, Gay CL, Busch MP, Hecht FM. The Detection of Acute HIV Infection. Journal of Infectious Diseases. 2010;202: S270–S277. 10.1086/655651 - DOI - PubMed
    1. Delaney KP, Hanson DL, Masciotra S, Ethridge SF, Wesolowski L, Owen SM. Time Until Emergence of HIV Test Reactivity Following Infection With HIV-1: Implications for Interpreting Test Results and Retesting After Exposure. Clinical infectious diseases. 2017;64: 53–59. 10.1093/cid/ciw666 - DOI - PubMed

Publication types