. 2021 Feb 1;17(2):e1008602.
doi: 10.1371/journal.pcbi.1008602. eCollection 2021 Feb.

Directed attenuation to enhance vaccine immunity

Affiliations

Directed attenuation to enhance vaccine immunity

Rustom Antia et al. PLoS Comput Biol. .

Abstract

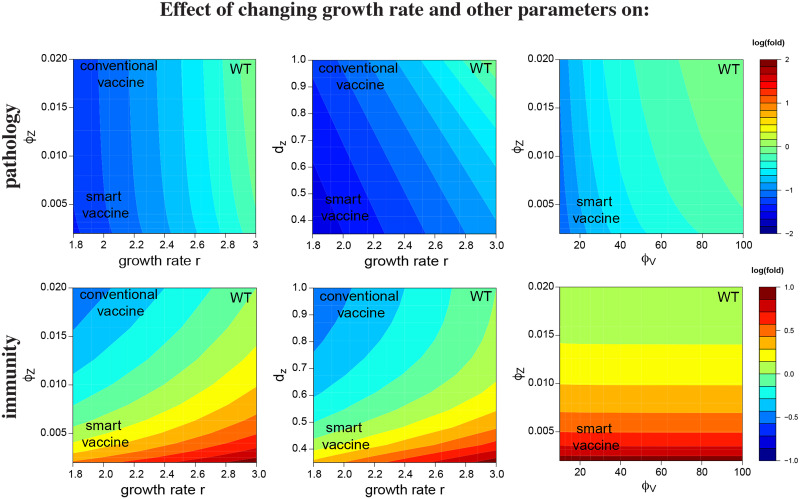
Many viral infections can be prevented by immunizing with live, attenuated vaccines. Early methods of attenuation were hit-and-miss, now much improved by genetic engineering. However, even current methods operate on the principle of genetic harm, reducing the virus's ability to grow. Reduced viral growth has the undesired side-effect of reducing the host immune response below that of infection with wild-type. Might some methods of attenuation instead lead to an increased immune response? We use mathematical models of the dynamics of virus with innate and adaptive immunity to explore the tradeoff between attenuation of virus pathology and immunity. We find that modification of some virus immune-evasion pathways can indeed reduce pathology yet enhance immunity. Thus, attenuated vaccines can, in principle, be directed to be safe yet create better immunity than is elicited by the wild-type virus.


Conflict of interest statement

The authors have declared that no competing interests exist.

Figures

Fig 1
Fig 1. Typical dynamics of an acute infection.
Virus (V) is shown in red, innate immunity (Z) in black and adaptive immunity (X) in blue. The scale for virus and adaptive immunity is fold change over the initial value (V(0) and X(0) are set to 1). The scale for innate immunity is percent of its maximum possible value (100), and in this simulation Z attains only about 10% of its maximum. Parameters are chosen for a biologically relevant regime as described earlier [36] and are shown in Table 1.
Fig 2
Fig 2. Attenuation by reducing the growth rate r of the virus.
Solid lines indicate wild-type; dashed and dotted indicate attenuated. Reducing virus growth rate results in lower viral load as well as a reduction in the final level of adaptive immunity. (A) Dynamics for the wild-type infection in solid lines (red for virus, blue and black for adaptive and innate immunity) and for viruses with a 20% (dashed) and 40% reduced growth rate (dotted). (B) Impact of the degree of attenuation (reduction in r) on both the final level of adaptive immunity (blue) and the pathology (maximum virus load, red). (C) The tradeoff between pathology and peak adaptive immunity from changing growth rate r: reducing the growth rate results in lower pathology but also lower immunity. Parameters values are given in Table 1.
Fig 3
Fig 3. Effect of changing single parameters on the levels of pathology and immunity.
Red curves give the pathology, with scale on the right vertical axis; blue lines give the final level of adaptive immunity, with scale on the left vertical axis. The baseline parameters chosen for the wild-type virus are indicated by ‘wt’ on the horizontal axis. A vaccine strain would be designed to lower pathology, and the arrow immediately above the horizontal axis gives the direction of change in the parameter value that would reduce pathology. The goal of directed attenuation is to achieve a decline in the red curve and an increase (or no change) in the blue curve relative to wild-type; several attenuation designs achieve this outcome. Baseline parameters are as in Fig 1 except for the parameter whose value is changed in the panel.
Fig 4
Fig 4. Comparison of immunity-pathology tradeoffs generated by changing single parameters.
Wild-type values are given at the intersection of the curves, so viable attenuation strategies would lie to the left. As the goal is to attenuate and to increase the immune response, the desirable attenuation strategies lie in the upper left quadrant. The tradeoff for the classic mode of attenuation—lowering growth rate r (black line)—has the undesirable effect of lowering immunity, a pattern mimicked by changes in several other parameters. In contrast, decreasing the rate of loss of innate immunity (dZ↓ (brown)), or increasing the rate of proliferation or sensitivity of adaptive immunity (sX↑ (red), ϕZ↓ (blue)) leads to lower pathology and increased immunity.
Fig 5
Fig 5. Heat maps for the log10 fold changes in pathology (top row) and immunity (bottom row) for changes in two parameters.
The effect of changing a single parameter alone is seen by moving parallel to the respective axis. The goal of attenuation is to reduce pathology from wild-type values (increase the level of blue, top row) and to increase immunity (increase redness, bottom row). Values of wild-type virus are given in upper right of each panel, values of the prospective vaccine in lower left. The goal is to have pathology become increasingly blue and immunity become increasingly red in traversing from wild-type to vaccine. The conventional attenuation strategy arising from reductions in the parameter r is seen to reduce both pathology and immunity (moving left along the horizontal axis in any of the left four panels). However, combining reductions in r with increasing the sensitivity of the adaptive immune response (i.e. decreasing ϕZ) or increasing the duration of innate immunity (i.e. increasing dZ) restores the level of immunity generated by the vaccine to that induced by the wild-type virus while reducing pathology (left two columns). The right column shows attenuation achieved by changes in a pair of parameters that does not include r.

References

    1. Plotkin S. History of vaccination. Proc Natl Acad Sci USA. 2014;111(34):12283–12287. 10.1073/pnas.1400472111 - DOI - PMC - PubMed
    1. Fenner F, Cairns J. Variation in virulence in relation to adaptaton to new hosts In: Burnet FM, Stanley WM, editors. The Viruses, Vol. 3. Animal viruses. vol. 3 New York, NY: Academic Press; 1959. p. 225–249.
    1. Hanley KA. The double-edged sword: How evolution can make or break a live-attenuated virus vaccine. Evolution. 2011;4(4):635–643. - PMC - PubMed
    1. Lauring AS, Jones JO, Andino R. Rationalizing the development of live attenuated virus vaccines. Nature biotechnology. 2010;28(6):573–579. 10.1038/nbt.1635 - DOI - PMC - PubMed
    1. Burns CC, Shaw J, Campagnoli R, Jorba J, Vincent A, Quay J, et al. Modulation of poliovirus replicative fitness in HeLa cells by deoptimization of synonymous codon usage in the capsid region. J Virol. 2006;80(7):3259–72. 10.1128/JVI.80.7.3259-3272.2006 - DOI - PMC - PubMed

Publication types