. 2021 Feb 26;49(4):1951-1971.
doi: 10.1093/nar/gkab032.

SUMOylation regulates the protein network and chromatin accessibility at glucocorticoid receptor-binding sites

Affiliations

SUMOylation regulates the protein network and chromatin accessibility at glucocorticoid receptor-binding sites

Ville Paakinaho et al. Nucleic Acids Res. .

Abstract

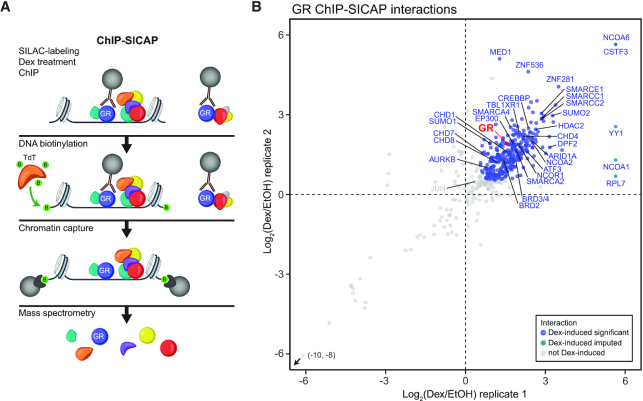
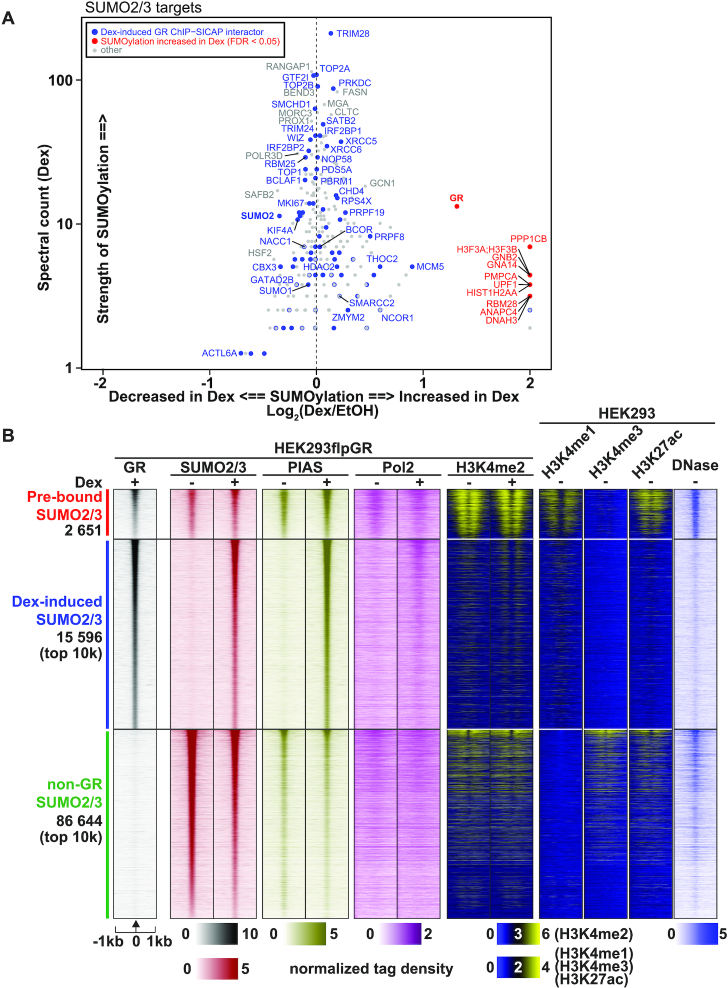
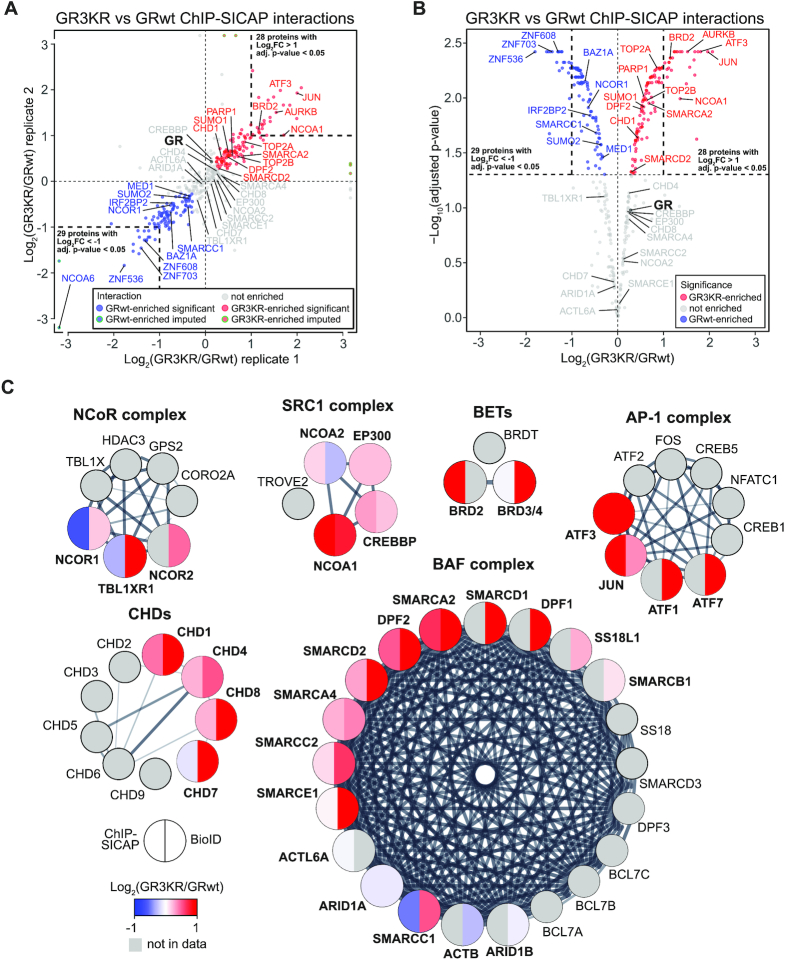
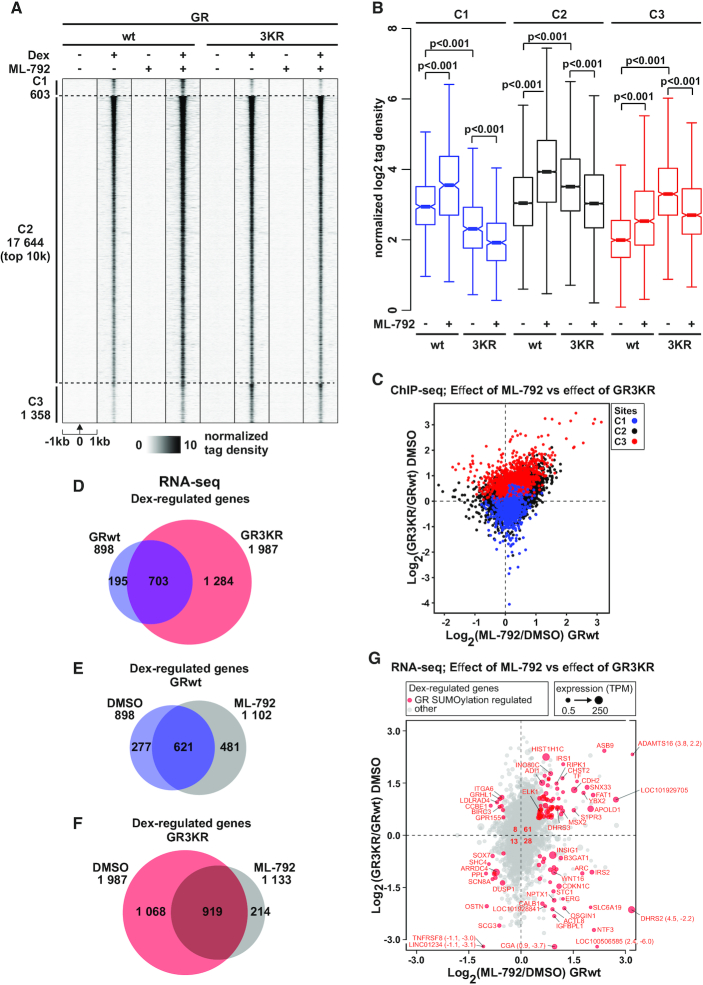
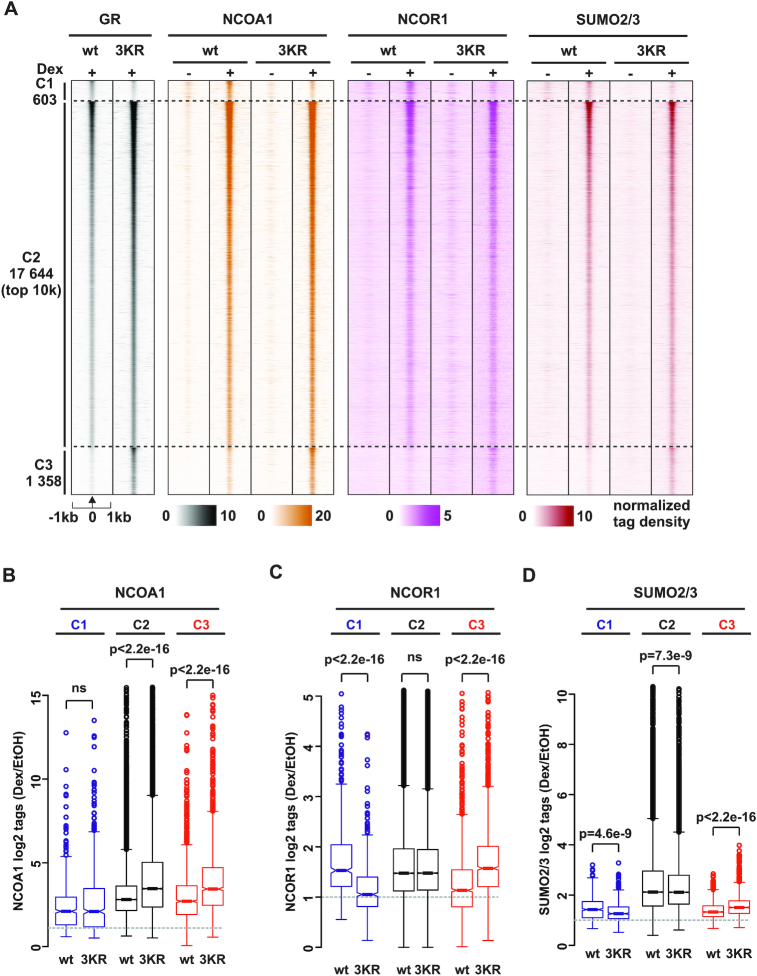
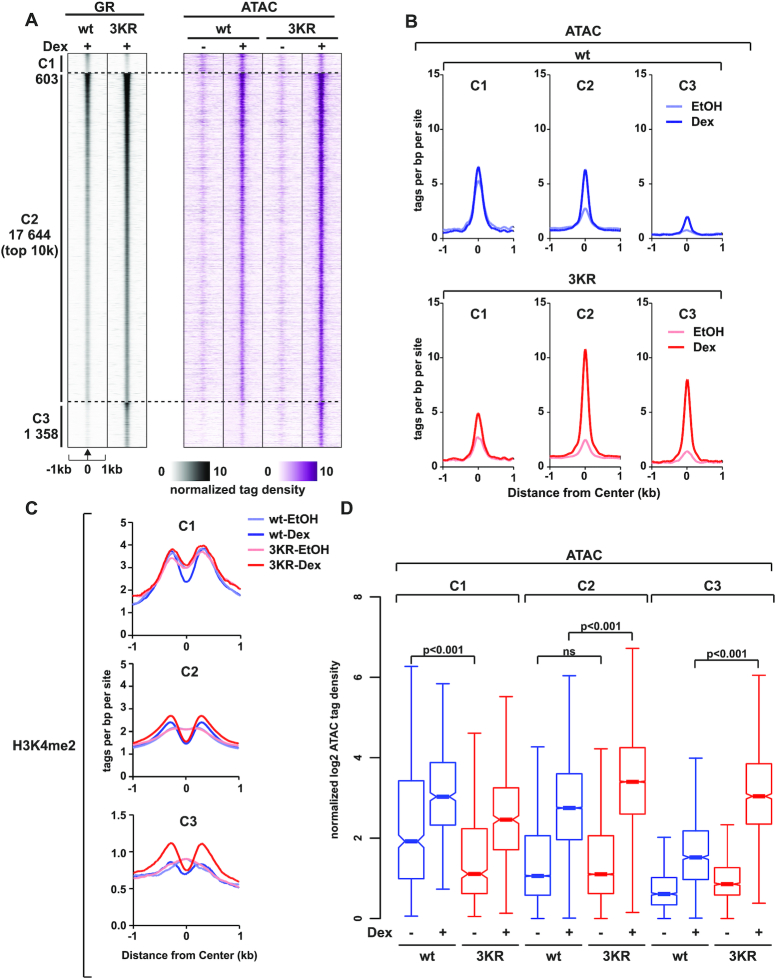
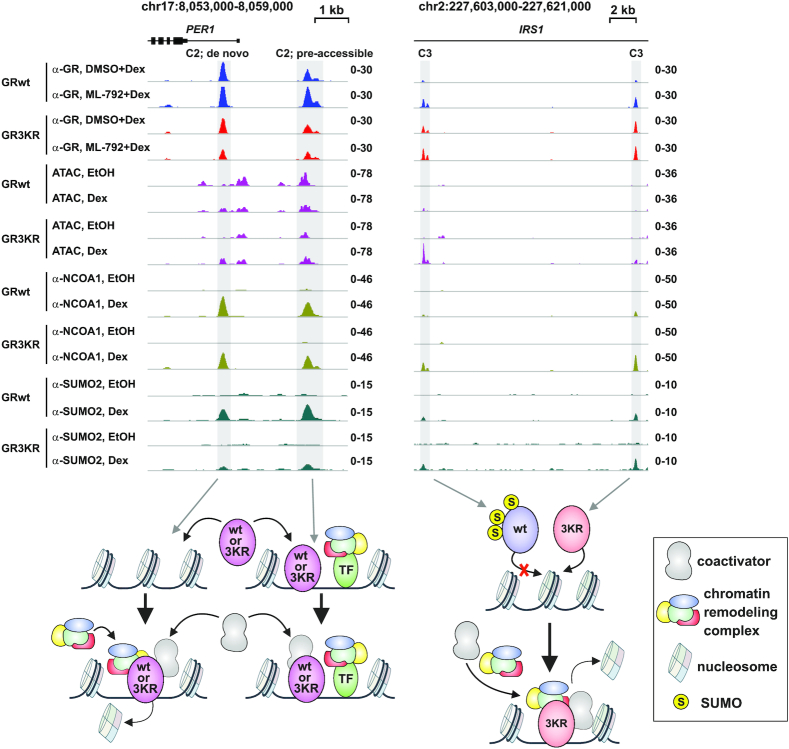
Glucocorticoid receptor (GR) is an essential transcription factor (TF), controlling metabolism, development and immune responses. SUMOylation regulates chromatin occupancy and target gene expression of GR in a locus-selective manner, but the mechanism of regulation has remained elusive. Here, we identify the protein network around chromatin-bound GR by using selective isolation of chromatin-associated proteins and show that the network is affected by receptor SUMOylation, with several nuclear receptor coregulators and chromatin modifiers preferring interaction with SUMOylation-deficient GR and proteins implicated in transcriptional repression preferring interaction with SUMOylation-competent GR. This difference is reflected in our chromatin binding, chromatin accessibility and gene expression data, showing that the SUMOylation-deficient GR is more potent in binding and opening chromatin at glucocorticoid-regulated enhancers and inducing expression of target loci. Blockage of SUMOylation by a SUMO-activating enzyme inhibitor (ML-792) phenocopied to a large extent the consequences of GR SUMOylation deficiency on chromatin binding and target gene expression. Our results thus show that SUMOylation modulates the specificity of GR by regulating its chromatin protein network and accessibility at GR-bound enhancers. We speculate that many other SUMOylated TFs utilize a similar regulatory mechanism.


Figures

Figure 1.
Figure 1.
GR interacts with various coregulators on chromatin. (A) Schematic representation of the ChIP-SICAP protocol. (B) Scatter plot showing chromatin-associated proteins identified with GR ChIP-SICAP. Blue dots with blue rim represent significantly (adj. P-value < 0.05) Dex-induced interactions, blue dots with green rim represent imputed Dex-induced interactions and grey dots represent interactions that are not Dex-induced.
Figure 2.
Figure 2.
GR and its chromatin partners are SUMO2/3 targets. (A) Scatterplot showing proteins identified as significantly SUMOylated (enriched over IgG, SAINTexpress FDR < 0.05) in SUMO2/3-pulldown in HEK293 cells expressing GR. X-axis shows the effect of Dex on the SUMOylation of each protein as Log2(Dex/EtOH). Spectral count (Dex) on the y-axis represents relative abundancy of the protein in the anti-SUMO2/3 immunoprecipitates. Spectral counts were normalized to the total spectral count sum of each sample. Significant (adj. P-value < 0.05) or imputed Dex-induced interactors identified with GR ChIP-SICAP are shown in blue. Proteins with significantly (FDR < 0.05) increased SUMOylation in Dex compared to vehicle are shown in red. There were no Dex-induced GR ChIP-SICAP interactors with significantly increased SUMOylation in Dex. (B) Heat maps representing GR, SUMO2/3, PIAS, Pol2 and H3K4me2 ChIP-seq data from HEK293flpGR (wt) in the presence and absence of Dex, and H3K4me1, H3K4me3 and H3K27ac ChIP-seq data from HEK293, and DNase-seq (DNase) data from HEK293T cells. Each heat map represents ±1kb around the center of the SUMO2/3 peak. Binding intensity (tags per bp per site) scale is noted below on a linear scale. All heat maps are normalized to a total of 10 million reads, and further to local tag density. Clusters represent from top to bottom; GR sites with pre-bound SUMO2/3, GR sites with Dex-induced SUMO2/3 (only top 10k shown), and non-GR SUMO2/3 sites (only top 10k shown).
Figure 3.
Figure 3.
A number of transcriptional regulators prefer SUMOylation-deficient GR to SUMOylation-competent GR. (A) Scatter plot showing correlation of on-chromatin GR interactors enriched in GR3KR over GRwt cells in the biological replicates. Only Dex-induced interactions are shown. Blue dots represent GRwt-enriched interactions (adjusted P-value < 0.05 or imputed, and log2[3KR/wt] < 0), red dots GR3KR-enriched interactions (adjusted P-value < 0.05 or imputed, and log2[3KR/wt] > 0) and gray dots interactions that are not enriched. (B) Volcano plot representing significance of interactions that are differentially enriched with GR3KR compared to GRwt. Only Dex-induced interactions are shown. Dot colors are the same as in (A), but imputed values are not shown. (C) GR interactor enrichment in nuclear protein complexes. Color of each protein represents enrichment in GRwt (blue) compared with GR3KR (red). Left side of the circle represents interactor enrichment in ChIP-SICAP and right side in BioID data. Proteins in grey belong to the protein complex but were not found in proteomics data. Interactions between complex subunits were acquired from the STRING database. Edge thickness represents confidence of interaction.
Figure 4.
Figure 4.
SUMOylation inhibitor ML-792 blunts the differences in GR chromatin binding and target gene expression between GRwt and GR3KR cells. (A) GR ChIP-seq profiles from DMSO- or ML-792-treated HEK293flpGRwt (wt) and HEK293flpGR3KR (3KR) cells in the presence or absence of Dex. Each heat map represents ±1 kb around the center of the GR peak. C1 represents GRwt-preferred, C2-shared, and C3 GR3KR-preferred binding sites. Only top 10 000 sites (top 10k) are shown for C2. Binding intensity (tags per bp per site) scale is noted below on a linear scale. All heat maps are normalized to a total of 10 million reads, and further to local tag density. (B) Box plots representing normalized log2 tag density of ML-792 GR ChIP-seq data at C1 (blue), C2 (black) and C3 (red) sites. P-values were calculated with one-way ANOVA with Bonferroni post hoc test. All box plots are normalized to total of 10 million reads. Blue color represents GRwt (wt), red color GR3KR (3KR). (C) Scatter plot representing GR ChIP-seq log2 tag density of ML-792/DMSO from GRwt cells (x-axis) and GR3KR/GRwt from DMSO treated cells (y-axis). GR-binding clusters are color coded, C1 (blue), C2 (black) and C3 (red). (D–F) Comparison of Dex-regulated genes from RNA-seq between (D) DMSO-treated GRwt and GR3KR cells, (E) ML-792- and DMSO-treated GRwt cells, and (F) ML-792- and DMSO-treated GR3KR cells. (G) Scatter plot representing RNA-seq log2 fold change of ML-792/DMSO from GRwt cells (x-axis) and GR3KR/GRwt from DMSO treated cells (y-axis). Circle size depicts TPM values. Genes that are significantly regulated by both ML-792 (adjusted P-value < 0.01 and log2[ML-792/DMSO] > 0.5 or < –0.5) and GR3KR (adjusted P-value < 0.01 and log2[GR3KR/GRwt] > 0.5 or < –0.5) are highlighted in red (GR SUMOylation regulated genes). Number of GR SUMOylation regulated genes belonging to each sector is shown in the middle. Figure shows only genes that are Dex-regulated (adjusted P-value < 0.01 and log2[Dex/EtOH] > 0.5 or < –0.5).
Figure 5.
Figure 5.
Recruitment of NCOA1, but not NCOR1, to chromatin is influenced by SUMOylation status of GR. (A) Heat maps showing GR, NCOA1, NCOR1 and SUMO2/3 ChIP-seq profiles from HEK293flpGRwt (wt) and HEK293flpGR3KR (3KR) cells in the presence and absence of Dex. Each heat map represents ±1 kb around the center of the GR peak. C1 represent GRwt preferred, C2 shared, and C3 GR3KR preferred binding sites. Only top 10 000 sites (top 10k) are shown for C2. Binding intensity (tags per bp per site) scale is noted below on a linear scale. All heat maps are normalized to a total of 10 million reads, and further to local tag density. (B–D) Box plots representing normalized log2 tag density of Dex/EtOH for (B) NCOA1 (C) NCOR1 and (D) SUMO2/3 at C1 (blue), C2 (black) and C3 (red) sites. P-values were calculated using unpaired two-sample t-test. All box plots are normalized to total of 10 million reads.
Figure 6.
Figure 6.
SUMOylation regulates the pioneer-like activity of GR in chromatin opening. (A) Heat maps showing GR ChIP-seq and ATAC-seq data from HEK293flpGRwt (wt) and HEK293flpGR3KR (3KR) cells in the presence and absence of Dex. Each heat map represents ±1 kb around the center of the GR peak. Binding intensity (tags per bp per site) scale is noted below on a linear scale. All heat maps are normalized to a total of 10 million reads, and further to local tag density. Sites have been sorted by GR signal, with the strongest GR signal on top. (B) Aggregate plots of ATAC-seq data for C1 (left), C2 (middle), and C3 (right) in GRwt (top, blue) and GR3KR (bottom, red) cells. Aggregate plots represent ±1kb around the center of the accessible region and are normalized to a total of 10 million reads, and further to local tag density. (C) Aggregate plots of H3K4me2 ChIP-seq data in the presence or absence of Dex for C1 (top), C2 (middle), and C3 (bottom) sites. Aggregate plots represent ±1kb around the center of the GR-binding site. Data are normalized to a total of 10 million reads, and further to local tag density. (D) Box plots representing normalized log2 tag density of ATAC-seq data at C1 (left), C2 (middle) and C3 (right) sites. P-values were calculated with One-way ANOVA with Bonferroni post hoc test. All box plots are normalized to total of 10 million reads. Blue color represents GRwt (wt), red color GR3KR (3KR).
Figure 7.
Figure 7.
Model examples of GR target loci differentially regulated by GR SUMOylation. Example of genome browser tracks of PER1 (left) and IRS1 (right) loci showing GR ChIP-seq, ATAC-seq, NCOA1 and SUMO2/3 ChIP-seq data from GRwt and GR3KR cells. PER1 is Dex induced in both cells. IRS1 is Dex induced only in GR3KR cells. Dex induction of IRS1 is increased in GRwt cells upon ML-792 treatment. PER1 loci harbor two GR binding sites, one at pre-accessible and one at de novo chromatin site. GRwt and GR3KR can bind to both sites and recruit NCOA1. At de novo site, both receptor forms induce chromatin accessibility. IRS1 locus harbors two GR3KR specific binding sites all de novo chromatin sites. GR3KR induces the recruitment of NCOA1 and chromatin accessibility at these sites. GRwt is able to bind to these sites upon ML-792 treatment.

Similar articles

Cited by

References

    1. Vandevyver S., Dejager L., Libert C.. Comprehensive overview of the structure and regulation of the glucocorticoid receptor. Endocr. Rev. 2014; 35:671–693. - PubMed
    1. Weikum E.R., Knuesel M.T., Ortlund E.A., Yamamoto K.R.. Glucocorticoid receptor control of transcription: precision and plasticity via allostery. Nat. Rev. Mol. Cell Biol. 2017; 18:159–174. - PMC - PubMed
    1. Cain D.W., Cidlowski J.A.. Immune regulation by glucocorticoids. Nat. Rev. Immunol. 2017; 17:233–247. - PMC - PubMed
    1. Pui C.H., Evans W.E.. Treatment of acute lymphoblastic leukemia. N. Engl. J. Med. 2006; 354:166–178. - PubMed
    1. Millard C.J., Watson P.J., Fairall L., Schwabe J.W.. An evolving understanding of nuclear receptor coregulator proteins. J. Mol. Endocrinol. 2013; 51:T23–36. - PMC - PubMed

Publication types

MeSH terms

Substances